

Adropin as a potential marker of enzyme-positive acute coronary syndrome
- PMID: 27196807
- PMCID: PMC5423434
- DOI: 10.5830/CVJA-2016-055
Adropin as a potential marker of enzyme-positive acute coronary syndrome
Abstract
Aim: Enzyme-positive acute coronary syndrome (EPACS) can cause injury to or death of the heart muscle owing to prolonged ischaemia. Recent research has indicated that in addition to liver and brain cells, cardiomyocytes also produce adropin. We hypothesised that adropin is released into the bloodstream during myocardial injury caused by acute coronary syndrome (ACS), so serum and saliva levels rise as the myocytes die. Therefore, it could be useful to investigate how ACS affects the timing and significance of adropin release in human subjects.
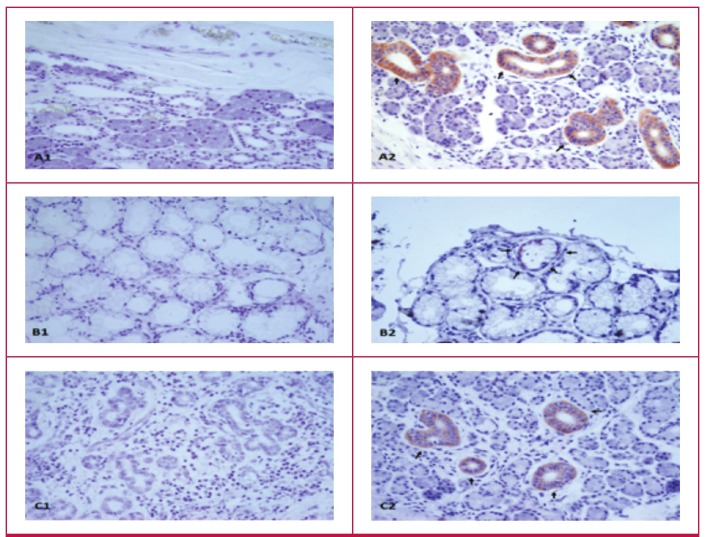
Methods: Samples were taken over three days after admission, from 22 EPACS patients and 24 age- and gendermatched controls. The three major salivary glands (submandibular, sublingual and parotid) were immunohistochemically screened for adropin production, and serum and saliva adropin levels were measured by an enzyme-linked immunosorbent assay (ELISA). Salivary gland cells produce and secrete adropin locally.
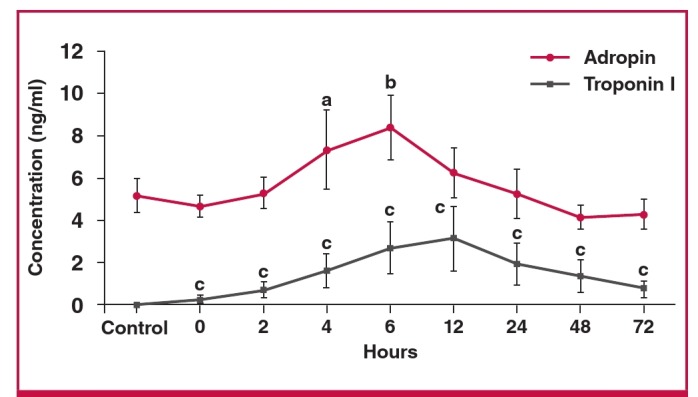
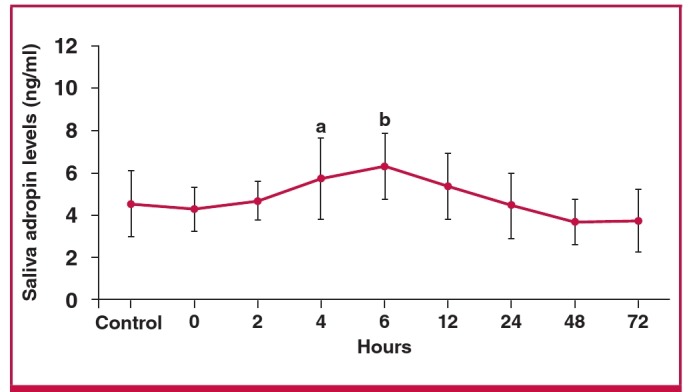
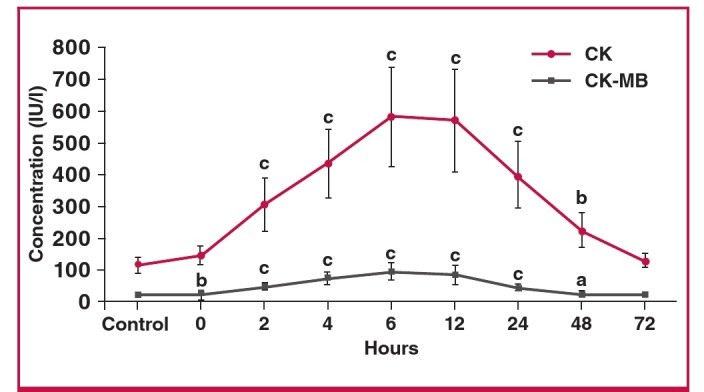
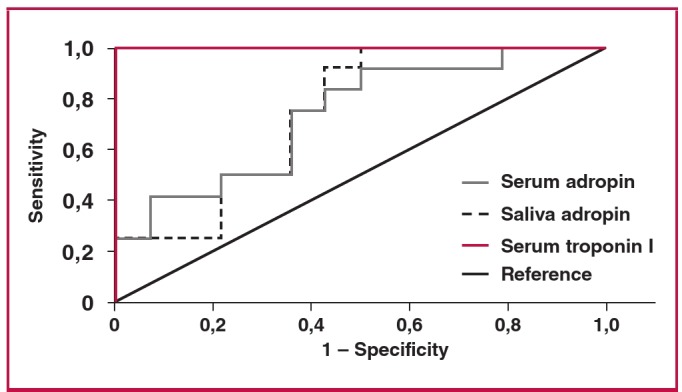
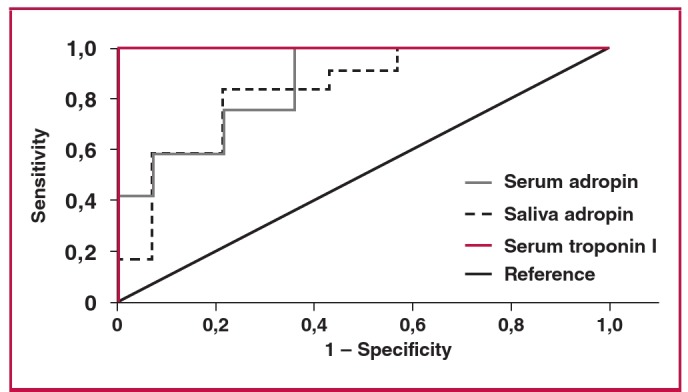
Results: Serum adropin, troponin I, CK and CK-MB concentrations in the EPACS group became gradually higher than those in the control group up to six hours (p < 0.05), and troponin I continued to rise up to 12 hours after EPACS. The same relative increase in adropin level was observed in the saliva. Troponin I, CK and CK-MB levels started to decrease after 12 hours, while saliva and serum adropin levels started to decrease at six hours after EPACS. In samples taken four hours after EPACS, when the serum adropin value averaged 4.43 ng/ml, the receiver operating characteristic curve showed that the serum adropin concentration indicated EPACS with 91.7% sensitivity and 50% specificity, while when the cut-off adropin value in saliva was 4.12 ng/ml, the saliva adropin concentration indicated EPACS with 91.7% sensitivity and 57% specificity.
Conclusion: In addition to cardiac troponin and CK-MB assays, measurement of adropin level in saliva and serum samples is a potential marker for diagnosing EPACS.
Figures
Similar articles
-
Elevated adropin: a candidate diagnostic marker for myocardial infarction in conjunction with troponin-I.Peptides. 2014 Aug;58:91-7. doi: 10.1016/j.peptides.2014.06.001. Epub 2014 Jun 14. Peptides. 2014. PMID: 24932661
-
Heart-type fatty acid binding protein--a reliable marker of myocardial necrosis in a heterogeneous group of patients with acute coronary syndrome without persistent ST elevation.Kardiol Pol. 2008 Mar;66(3):253-9, discussion 260-1. Kardiol Pol. 2008. PMID: 18393112
-
The comparison of cardiac biomarkers positivities in hemodialysis patients without acute coronary syndrome.Ren Fail. 2011;33(6):578-81. doi: 10.3109/0886022X.2011.585264. Ren Fail. 2011. PMID: 21663388
-
Creatine kinase isoenzyme MB mass, cardiac troponin T, and myosin light chain isotype 1 as serological markers of myocardial injury and their prognostic importance in acute coronary syndrome.Dan Med Bull. 1998 Feb;45(1):34-50. Dan Med Bull. 1998. PMID: 9504265 Review.
-
Laboratory diagnosis of patients with acute chest pain.Clin Chem Lab Med. 2000 Mar;38(3):187-97. doi: 10.1515/CCLM.2000.027. Clin Chem Lab Med. 2000. PMID: 10905753 Review.
Cited by
-
Diagnostic accuracy of adropin as a preliminary test to exclude acute pulmonary embolism: a prospective study.BMC Pulm Med. 2022 Sep 18;22(1):351. doi: 10.1186/s12890-022-02156-y. BMC Pulm Med. 2022. PMID: 36115957 Free PMC article.
-
Low Levels of Adropin Predict Adverse Clinical Outcomes in Outpatients with Newly Diagnosed Prediabetes after Acute Myocardial Infarction.Biomedicines. 2024 Aug 15;12(8):1857. doi: 10.3390/biomedicines12081857. Biomedicines. 2024. PMID: 39200321 Free PMC article.
-
Cardiac Hepatopathy: New Perspectives on Old Problems through a Prism of Endogenous Metabolic Regulations by Hepatokines.Antioxidants (Basel). 2023 Feb 17;12(2):516. doi: 10.3390/antiox12020516. Antioxidants (Basel). 2023. PMID: 36830074 Free PMC article. Review.
-
New Peptides as Potential Players in the Crosstalk Between the Brain and Obesity, Metabolic and Cardiovascular Diseases.Front Physiol. 2021 Aug 23;12:692642. doi: 10.3389/fphys.2021.692642. eCollection 2021. Front Physiol. 2021. PMID: 34497533 Free PMC article. Review.
-
Adropin/Tirzepatide Combination Mitigates Cardiac Metabolic Aberrations in a Rat Model of Polycystic Ovarian Syndrome, Implicating the Role of the AKT/GSK3β/NF-κB/NLRP3 Pathway.Int J Mol Sci. 2024 Dec 24;26(1):1. doi: 10.3390/ijms26010001. Int J Mol Sci. 2024. PMID: 39795860 Free PMC article.
References
-
- Neuspiel DR, Kuller LH. Sudden and unexpected natural death in childhood and adolescence. J Am Med Assoc. 1985;254(10):1321–1325. - PubMed
-
- Damiani G, Slavatori E, Silvestrini G, Ivanova I, Bojovic L, Iodice L. et al. Influence of socioeconomic factors on hospital readmissions for heart failure and acute myocardial infarction in patients 65 years and older: evidence from a systematic review. Clin Interv Aging. 2015;10:237–245. - PMC - PubMed
-
- Thadani U. Oral nitrates: more than symptomatic therapy in coronary artery disease? Cardiovasc Drugs Ther. 1997;11(Suppl 1):213–218. - PubMed
-
- Suades R, Padro T, Vilahur G, Badimon L. Circulating and plateletderived microparticles in human blood enhance thrombosis on atherosclerotic plaques. Thromb Haemost. 2012;108(6):1208–1219. - PubMed
-
- Davies MJ. macro and micro view of coronary vascular insult in ischemic heart disease. Circulation. 1990;82(Suppl 3):II38–46. - PubMed
MeSH terms
Substances
LinkOut - more resources
Full Text Sources
Other Literature Sources
Research Materials
Miscellaneous
