. 2016 Jul 1;76(13):3719-31.
doi: 10.1158/0008-5472.CAN-15-3190. Epub 2016 Apr 28.

Exome-Scale Discovery of Hotspot Mutation Regions in Human Cancer Using 3D Protein Structure

Affiliations

Exome-Scale Discovery of Hotspot Mutation Regions in Human Cancer Using 3D Protein Structure

Collin Tokheim et al. Cancer Res. .

Abstract

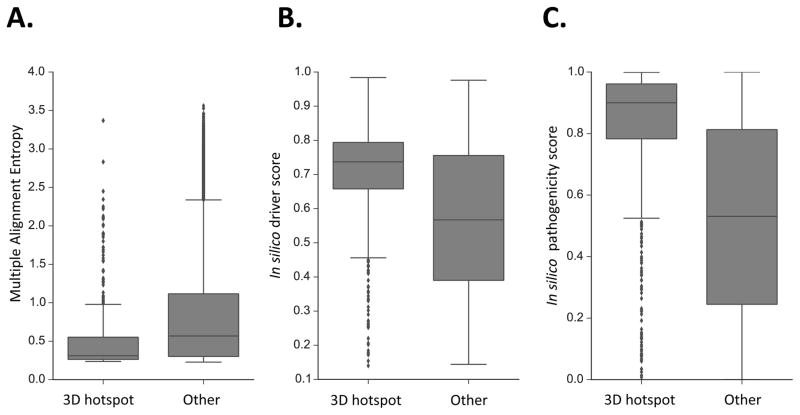
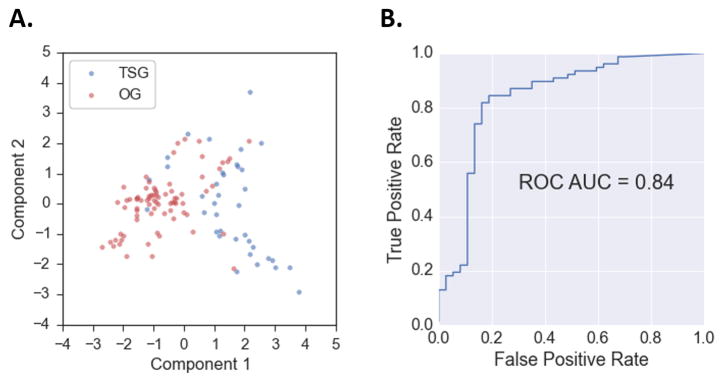
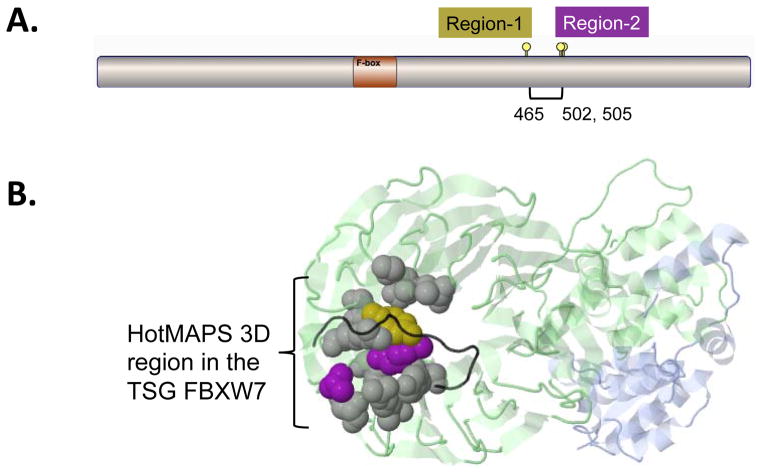
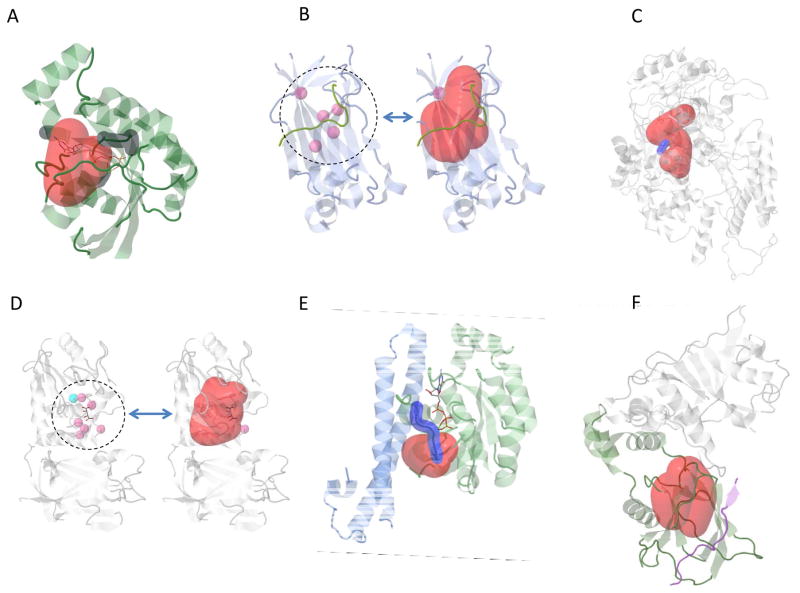
The impact of somatic missense mutation on cancer etiology and progression is often difficult to interpret. One common approach for assessing the contribution of missense mutations in carcinogenesis is to identify genes mutated with statistically nonrandom frequencies. Even given the large number of sequenced cancer samples currently available, this approach remains underpowered to detect drivers, particularly in less studied cancer types. Alternative statistical and bioinformatic approaches are needed. One approach to increase power is to focus on localized regions of increased missense mutation density or hotspot regions, rather than a whole gene or protein domain. Detecting missense mutation hotspot regions in three-dimensional (3D) protein structure may also be beneficial because linear sequence alone does not fully describe the biologically relevant organization of codons. Here, we present a novel and statistically rigorous algorithm for detecting missense mutation hotspot regions in 3D protein structures. We analyzed approximately 3 × 10(5) mutations from The Cancer Genome Atlas (TCGA) and identified 216 tumor-type-specific hotspot regions. In addition to experimentally determined protein structures, we considered high-quality structural models, which increase genomic coverage from approximately 5,000 to more than 15,000 genes. We provide new evidence that 3D mutation analysis has unique advantages. It enables discovery of hotspot regions in many more genes than previously shown and increases sensitivity to hotspot regions in tumor suppressor genes (TSG). Although hotspot regions have long been known to exist in both TSGs and oncogenes, we provide the first report that they have different characteristic properties in the two types of driver genes. We show how cancer researchers can use our results to link 3D protein structure and the biologic functions of missense mutations in cancer, and to generate testable hypotheses about driver mechanisms. Our results are included in a new interactive website for visualizing protein structures with TCGA mutations and associated hotspot regions. Users can submit new sequence data, facilitating the visualization of mutations in a biologically relevant context. Cancer Res; 76(13); 3719-31. ©2016 AACR.


Conflict of interest statement

No conflicts of interest

Figures

Fig. 1
Fig. 1. 3D Hotspot regions are different from other mutated protein residues
Three distinguishing features of HotMAPS regions. A. HotMAPS mutated residues are more conserved in vertebrate evolution than mutated residues not in hotspot regions, as shown by lower Multiple Alignment Entropy (p=1.2E-29; Mann-Whitney U test). Multiple Alignment Entropy is calculated as the Shannon entropy of protein-translated 46-way vertebrate genome alignments from UCSC Genome Browser, which is lowest for the most conserved residues. B. HotMAPS missense mutations have higher in silico cancer driver scores from the CHASM algorithm (p=5.3E-47; Mann-Whitney U test) than those mutations not in hotspot regions, and C. higher in silico pathogenicity scores from the VEST algorithm (p=7.0E-162; Mann-Whitney U-test). Finally, HotMAPS mutated residues occur more frequently at protein-protein interfaces (p=1.3E-11; one-tailed Fisher’s Exact test) (Table S8).
Fig. 2
Fig. 2. HotMAPS regions have different characteristic features in oncogenes (OGs) and tumor suppressor genes (TSGs)
A. Principal components analysis (PCA) plot shows a clustering pattern in hotspot regions identified in OGs (red) and TSGs (blue). Each point is a region represented by six numeric features, projected into two dimensions. The features are region size, mutational diversity, vertebrate evolutionary conservation, residue relative solvent accessibility, mutation net change in hydropobicity and mutation net change in residue volume. B. OG and TSG HotMAPS regions can be discriminated with machine learning, based on four features. A Gaussian Naive Bayes classifier trained on provides a reasonable separation between the two classes with AUC=0.84 out of 1.0. Performance of a random classifier is AUC=0.5. ROC=Receiver Operating Characteristic (ROC), AUC = area under the ROC curve.
Fig. 3
Fig. 3. Comparison of hot spot detection in the TSG FBXW7 in 1D and 3D
A. A simplified 1D version of HotMAPS found two regions in FBXW7. The 3D version of HotMAPS found a single larger region, encompassing both regions. Diagram shows protein sequence of FBXW7, which contains a single F-box functional domain. Region-1 = residue 465 (left lollipop), Region-2 = residues 502 and 505 (right lollipops). B. HotMAPS identifies a single 3D hotspot region in FBXW7. Structure of SCFFbw7 ubiquitin ligase complex (PDB 2OVQ), containing FBXW7 (Green), SKP1 (Blue) and CCNE1 fragment (degron peptide) (Black). Residue coloring: 1D Region-1 (Gold), 1D Region-2 (Purple). Residues missed by 1D detection but included in HotMAPS 3D=Gray. Although the 1D regions are far in the primary protein sequence, residues 505 and 465 spatially contact at the interface with CCNE1. Protein structure figures are generated by JSMol in MuPIT (http://mupit.us).
Fig. 4
Fig. 4. HotMAPS hotspot regions overlap and are proximal to important functional sites
A. HNSC hotspot region (red) in RAC1 (green) and GTP/GDP binding residues (dark gray) (PDB 2FJU). B. PRAD hotspot region (red) in SPOP-substrate complex (PDB 3HGH) with SPOP (blue) and H2AFY substrate (green). Left shows 5 residues (pink) that when mutated show strongly reduced affinity for substrate. C. BLCA Hotspot region (red) in ERCC2 (gray) shown on theoretical model of ERCC2 helicase ATP-binding domain. The hotspot is proximal to the DEAH box (blue), a highly conserved motif containing residues that interact with Mg2+ and are critical for ATP binding and helicase activity. D. UCEC hotspot region (red) in PTEN (PDB 1D5R) with active site phosphocysteine residue (blue), residues when mutated annotated to reduce phosphatase activity (pink). E. STAD hotspot region (red) in RHOA with a GTP analog bound (sticks) (PDB 1CXZ). GTP binding residues and effector region (dark blue). F. KIRC hotspot region (red) in VHL-TCEB1-TCEB2 complex, bound to HIF1A peptide (PDB 4AJY). Proximity to the interaction site of VHL (Green) and HIF1A (Blue), suggests possible decreased ubiquitination of HIF1A, resulting in increased protein expression of HIF1A. TCEB1 and TCEB2 (Gray). HNSC= Head and Neck Squamous Cell Carcinoma, PRAD= Prostate Adenocarcinoma BLCA= Bladder Urothelial Carcinoma, UCEC= Uterine Corpus Endometrial Carcinoma, STAD= Stomach Adenocarcinoma. KIRC = Kidney Renal Clear Cell Carcinoma.

References

    1. Vogelstein B, Papadopoulos N, Velculescu VE, Zhou S, Diaz LA, Jr, Kinzler KW. Cancer genome landscapes. Science. 2013;339(6127):1546–58. - PMC - PubMed
    1. Wood LD, Parsons DW, Jones S, Lin J, Sjoblom T, Leary RJ, et al. The genomic landscapes of human breast and colorectal cancers. Science. 2007;318(5853):1108–13. - PubMed
    1. Greenman C, Stephens P, Smith R, Dalgliesh GL, Hunter C, Bignell G, et al. Patterns of somatic mutation in human cancer genomes. Nature. 2007;446(7132):153–8. - PMC - PubMed
    1. Dees ND, Zhang Q, Kandoth C, Wendl MC, Schierding W, Koboldt DC, et al. MuSiC: identifying mutational significance in cancer genomes. Genome Res. 2012;22(8):1589–98. - PMC - PubMed
    1. Lawrence MS, Stojanov P, Polak P, Kryukov GV, Cibulskis K, Sivachenko A, et al. Mutational heterogeneity in cancer and the search for new cancer-associated genes. Nature. 2013;499(7457):214–8. - PMC - PubMed

Publication types

Substances