. 2016 Jun 1;76(11):3411-21.
doi: 10.1158/0008-5472.CAN-15-3198. Epub 2016 Apr 11.

NOTCH Signaling Regulates Asymmetric Cell Fate of Fast- and Slow-Cycling Colon Cancer-Initiating Cells

Affiliations

NOTCH Signaling Regulates Asymmetric Cell Fate of Fast- and Slow-Cycling Colon Cancer-Initiating Cells

Tara Srinivasan et al. Cancer Res. .

Abstract

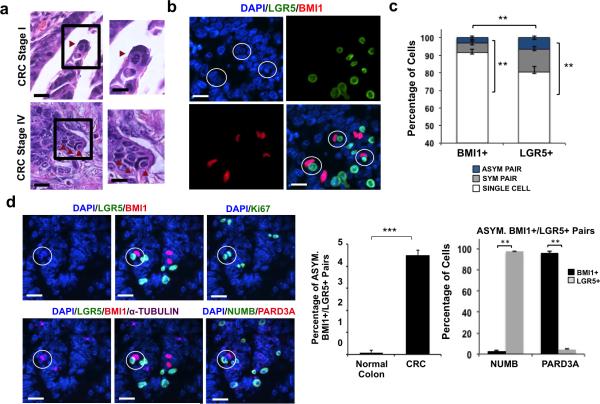
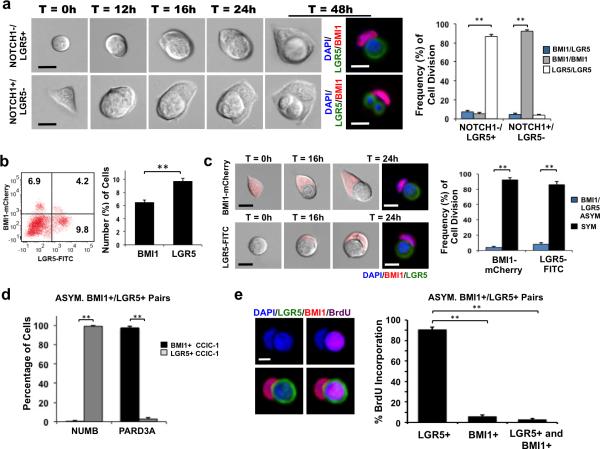
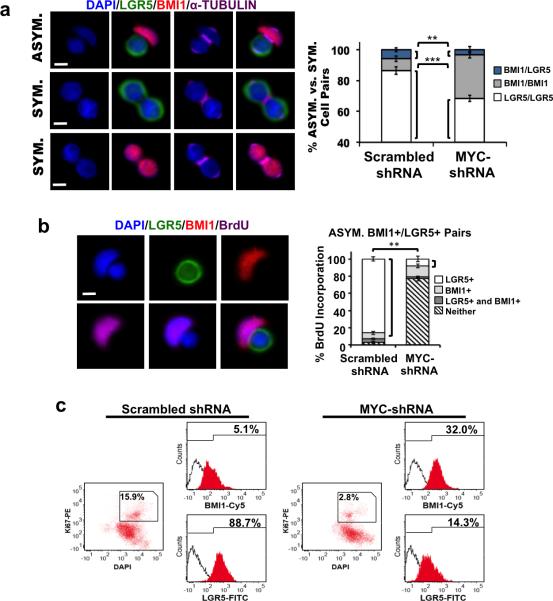
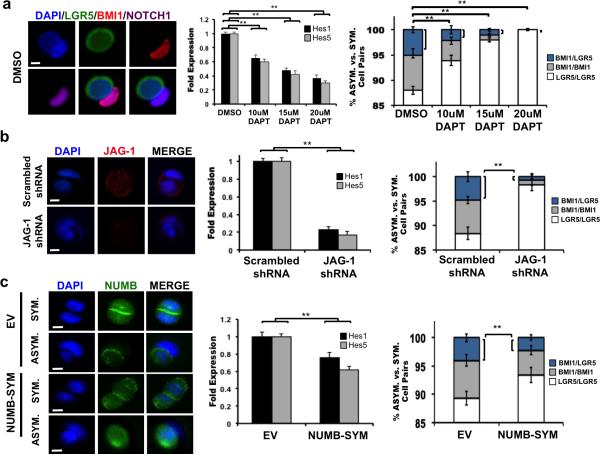
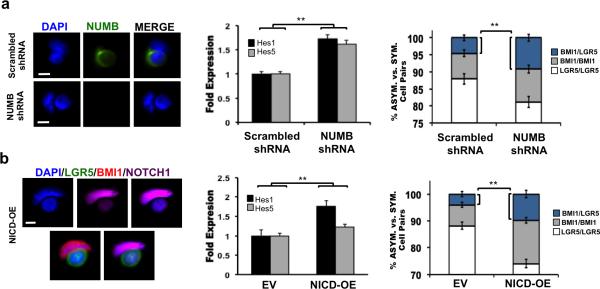
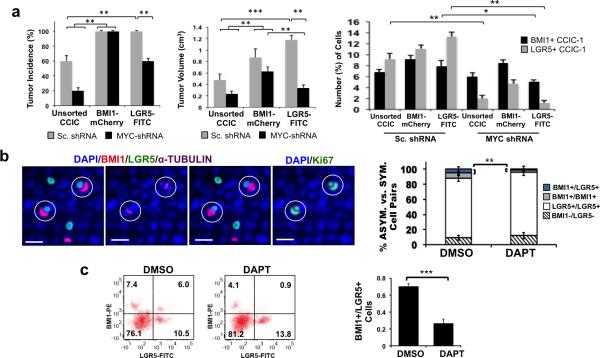
Colorectal cancer cells with stem-like properties, referred to as colon cancer-initiating cells (CCIC), have high tumorigenic potential. While CCIC can differentiate to promote cellular heterogeneity, it remains unclear whether CCIC within a tumor contain distinct subpopulations. Here, we describe the co-existence of fast- and slow-cycling CCIC, which can undergo asymmetric division to generate each other, highlighting CCIC plasticity and interconvertibility. Fast-cycling CCIC express markers, such as LGR5 and CD133, rely on MYC for their proliferation, whereas slow-cycling CCIC express markers, such as BMI1 and hTERT, are independent of MYC. NOTCH signaling promotes asymmetric cell fate, regulating the balance between these two populations. Overall, our results illuminate the basis for CCIC heterogeneity and plasticity by defining a direct interconversion mechanism between slow- and fast-cycling CCIC. Cancer Res; 76(11); 3411-21. ©2016 AACR.


Figures

Figure 1
Figure 1. Primary CRC tumors contain BMI1+/LGR5+ cell pairs
(a) H&E images of human Colorectal Cancer (CRC) Stage I (top row) and Stage IV (bottom row) at low (left) and high (right) magnifications. Scale bar: 50 μm (left), 25 μm (right). (b) Representative co-IF from CRC stage IV showing BMI1+(red)/LGR5 (green) asymmetric CCIC pairs. DAPI (blue) labels nuclei; scale bar: 25μm. (c) Percent of BMI1+ or LGR5+ cells associated as single cells, symmetrically dividing (α-TUBULIN+) pairs, or BMI1+/LGR5+ asymmetrically dividing cell pairs in CRC tumor tissue based on co-IF. Data represents mean ± SD of n = 20 tumors from 500 cells/specimen (**, p = 0.01; Student t-test). (d) Left: Representative co-IF of CRC specimen showing LGR5 (green), BMI1 (red), and α-TUBULIN (purple) expression. Also shown is NUMB (green) and PARD3A (red) expression. Ki67 staining (green); DAPI (blue); scale bar: 25 μm. Middle: Frequency of dividing (α-TUBULIN+) BMI1+/LGR5+ asymmetric cell pairs in normal colon vs. CRC tumor tissue based on co-IF. Data represents mean ± SD of n = 20 normal or CRC specimens from 500 TUBULIN+ pairs/specimen(***, p = 0.001; Student t-test). Right: Percent of BMI1+ or LGR5+ cells expressing NUMB or PARD3A in asymmetric BMI1+/LGR5+ pairs. The data represents the mean ± SD from n = 20 tumors (**, p = 0.01; Student t-test).
Figure 2
Figure 2. Asymmetric BMI1+/LGR5+ CCIC-1 daughter pairs
(a) Left: Time-lapse series of single NOTCH1−/LGR5+ CCIC (top panel) and NOTCH1+/LGR5− CCIC (bottom panel) undergoing asymmetric division over 48 hours. Co-IF after fixation at 48 hours: LGR5 (green), BMI1 (red), DAPI (blue); scale bar: 10μm. Right: Frequency of asymmetric BMI1+/LGR5+ (blue), symmetric BMI1+/BMI1+ (grey), or symmetric LGR5+/LGR5+ (white) cell pairs in sorted NOTCH1/LGR5 CCIC. Data represents the mean ± SD from 3 independent experiments with n = 100 LGR5+ cells/replicate or n = 1000 NOTCH1+(BMI1+) cells/replicate (**, p = 0.01; Student t-test). (b) CCICs were lentivirally transduced with a BMI1-mCherry promoter reporter construct. Left: FACS plot (left) and the percent of BMI1+ and LGR5+ CCIC determined by FACS (right). Data represents mean ± SD from 3 independent experiments. (**, p =0.01; Student t-test). (c) Left: Time-lapse series of single BMI1+ CCIC (top panel) and LGR5+ CCIC (bottom panel) undergoing asymmetric division over 24 hours. BF: BMI1-mCherry (red). Co-IF antibody staining at 24 hours: BMI1 (red); LGR5 (green); DAPI (blue); scale bar: 10μm. Right: Frequency of asymmetric BMI1+/LGR5+ (blue) or symmetric (black) cell pairs in sorted BMI1+ or LGR5+ CCIC. The data represents the mean ± SD from 3 independent experiments with n = 100 LGR5+ cells/replicate or n = 1000 BMI1+ cells/replicate (**, p = 0.01; Student t-test). (d) Quantitative analysis of the percent of BMI1+ or LGR5+ daughters expressing NUMB or PARD3A in asymmetric BMI1+/LGR5+ CCIC pairs. The data represents mean ± SD from 3 independent experiments with n = 500 pairs/replicate (**, p = 0.01; Student t-test). (e) BrdU incorporation following division of CCIC. Left: LGR5 (green), BMI1 (red), and BrdU (purple) staining. DAPI (blue); scale bar: 10μm. Right: Quantitative analysis in asymmetric BMI1+/LGR5+ pairs with percentage of BrdU incorporation in LGR5+ CCIC, BMI1+ CCIC or both LGR5+ and BMI1+ CCIC daughters indicated (**, p = 0.004, one-way ANOVA). The data represents mean ± SD of 3 independent experiments with n = 500 cell pairs/replicate.
Figure 3
Figure 3. MYC knockdown in BMI1+/LGR5+ CCIC-1 daughter pairs
(a) Single CCIC were lentivirally transduced with scrambled shRNA (Sc. shRNA) or MYC-shRNA. Left: CCIC daughter pairs undergoing BMI1+/LGR5+ asymmetric, LGR5+ symmetric, or BMI1+ symmetric division. LGR5 (green), BMI1 (red), α-TUBULIN (purple), DAPI (blue), scale bar: 10μm. Right: Percentage of BMI1+/LGR5+ asymmetric (blue), BMI1+/BMI1+ symmetric (grey), or LGR5+/LGR5+ symmetric (white) CCIC pairs determined by co-IF for LGR5, BMI1, and α-TUBULIN expression. The data represents mean ± SD from three independent experiments with n = 500 TUBULIN+ pairs/replicate (**, p = 0.0033, one-way ANOVA). (b) BrdU incorporation following division of a single CCIC transduced with MYC-shRNA. Left: co-IF: LGR5 (green), BMI1 (red), BrdU (purple), DAPI (blue); scale bar: 10μm. Right: Quantitative analysis in asymmetric BMI1+/LGR5+ pairs with percentage of BrdU incorporation in LGR5+ CCIC, BMI1+ CCIC, both LGR5+ and BMI1+ CCICs, or neither indicated (**, p = 0.005, one-way ANOVA). The data represents mean ± SD of 3 independent experiments with n = 500 cells/replicate. (c) FACS analysis of CCIC transduced with scrambled shRNA (left) or MYC-shRNA (right) showing expression of LGR5 and BMI1 within the gated Ki67+ population.
Figure 4
Figure 4. NOTCH suppression decreases BMI1+/LGR5+ CCIC-1 daughter pairs
(a) Pair-cell assay of CCIC treated with DMSO vs. DAPT. Left: NOTCH1 (purple) expression in BMI1+(red)/LGR5+(green) pair. DAPI labels nuclei; scale bar: 10μm. Middle: RT-qPCR measurements of Hes1 and Hes5 expression. Right: Fraction of BMI1+/LGR5+ asymmetric (blue), BMI1+/BMI1+ symmetric (grey) and LGR5+/LGR5+ symmetric (white) cell pairs for each treatment condition (**, p = 0.01; one-way ANOVA). (b) Left: JAG-1 (red) staining of CCIC daughter pairs infected with scrambled shRNA (control) or JAG-1 shRNA. Scale bar: 10μm. Middle: JAG-1 knockdown decreased Hes1 and Hes5. Right: JAG-1 shRNA reduced the frequency of asymmetric BMI1+/LGR5+ pairs (blue) in CCICs (**, p = 0.0028; Student t-test). (c) Left: NUMB (green) staining in empty vector (EV) or NUMB-SYM-transduced CCIC. Scale bar: 10μm. Middle: Hes1 and Hes5 expression measured by RT-qPCR. Right: Fraction of asymmetric BMI1+/LGR5+ cell pairs (blue) decreased in NUMB-SYM expressing CCICs (**, p = 0.0022; Student t-test). In all panels, RT-PCR was performed in triplicate and is presented as mean ± SD; data from cell pair assays represents mean ± SD from three independent experiments with n = 500 TUBULIN+ pairs/replicate.
Figure 5
Figure 5. NOTCH signaling promotes BMI1+/LGR5+ CCIC-1 daughter pairs
(a) Left: NUMB (green) staining of CCIC daughter pairs infected with scrambled shRNA (control) or NUMB-shRNA. Scale bar: 10μm. Middle: NUMB knockdown increased Hes1 and Hes5 expression. Right: Frequency of asymmetric BMI1+/LGR5+ pairs (blue) increased upon NUMB knockdown (**, p = 0.008; Student t-test). (b) CCICs were infected with an ectopic NICD expression (NICD-OE) construct. Left: Co-IF of NICD-OE BMI1+(red)/ LGR5+(green) CCIC pair, indicating differential asymmetric NOTCH1 (purple) expression. Middle: Hes1 and Hes5 levels measured by RT-qPCR. Right: NICD-OE increased the frequency of asymmetric BMI1+/LGR5+ pairs (blue) (**, p = 0.0019; Student t-test). In all panels, RT-PCR was performed in triplicate and is presented as mean ± SD; data from cell pair assays represents mean ± SD from three independent experiments with n = 500 TUBULIN+ pairs/replicate.
Figure 6
Figure 6. Xenograft tumors derived from CCIC-1 line
(a) CCIC-1 cells expressing a BMI1-mcherry promoter reporter were lentivirally transduced with scrambled shRNA (Sc. shRNA) or MYC-shRNA. 1×10⁶ unsorted, BMI1+, or LGR5+ sorted CCICs were injected s.c. into NOD/SCID mice (n = 5) to develop tumors for 4 weeks. Tumor incidence (left), tumor volume (middle), and the percentage of BMI1+ or LGR5+ CCIC from tumors (right) are indicated. The data represents mean ± SD. (***, p =0.0004; **, p=0.01; *, p=0.02; one-way ANOVA). (b) 1×10⁶ unsorted CCICs were injected s.c. into NOD/SCID mice (n = 6) to develop tumors for 4 weeks; tumors were then injected with DMSO or DAPT over 72 hours. Left: Tumor co-IF: BMI1+(red), LGR5+(green), α-TUBULIN (purple), Ki67 (green), DAPI (blue); scale bar: 25 μm. Right: Frequency of BMI1+/LGR5+ asymmetric (blue), BMI1+/BMI1+ symmetric (grey), or LGR5+/LGR5+ symmetric (white) cell pairs in xenograft tumors determined by co-IF for LGR5, BMI1, and α-TUBULIN. The data represent mean ± SD of n = 500 TUBULIN+ dividing pairs/mouse (**, p = 0.003, Student t-test). (c) RepresentativeFACS plots (left) and the ratio of BMI1+/LGR5+ cells determined by FACS (right) from tumors described in (f). Data represents mean ± SD of n = 3 mice/condition. (***, p =0.0002; Student t-test).

References

    1. Kreso A, van Galen P, Pedley NM, Lima-Fernandes E, Frelin C, Davis T, et al. Self-renewal as a therapeutic target in human colorectal cancer. Nature medicine. 2014;20(1):29–36. doi: 10.1038/nm.3418. PubMed PMID: 24292392. - PubMed
    1. Dick JE. Stem cell concepts renew cancer research. Blood. 2008;112(13):4793–807. doi: 10.1182/blood-2008-08-077941. PubMed PMID: 19064739. - PubMed
    1. Meacham CE, Morrison SJ. Tumour heterogeneity and cancer cell plasticity. Nature. 2013;501(7467):328–37. doi: 10.1038/nature12624. PubMed PMID: 24048065. - PMC - PubMed
    1. Sikandar SS, Pate KT, Anderson S, Dizon D, Edwards RA, Waterman ML, et al. NOTCH signaling is required for formation and self-renewal of tumor-initiating cells and for repression of secretory cell differentiation in colon cancer. Cancer research. 2010;70(4):1469–78. doi: 10.1158/0008-5472.CAN-09-2557. PubMed PMID: 20145124; PubMed Central PMCID: PMC4010106. - PMC - PubMed
    1. Dalerba P, Dylla SJ, Park IK, Liu R, Wang X, Cho RW, et al. Phenotypic characterization of human colorectal cancer stem cells. Proceedings of the National Academy of Sciences of the United States of America. 2007;104(24):10158–63. doi: 10.1073/pnas.0703478104. PubMed PMID: 17548814; PubMed Central PMCID: PMC1891215. - PMC - PubMed

MeSH terms