. 2016 Jul;26(7):863-73.
doi: 10.1101/gr.202440.115. Epub 2016 May 18.

Selection and explosive growth alter genetic architecture and hamper the detection of causal rare variants

Affiliations

Selection and explosive growth alter genetic architecture and hamper the detection of causal rare variants

Lawrence H Uricchio et al. Genome Res. 2016 Jul.

Abstract

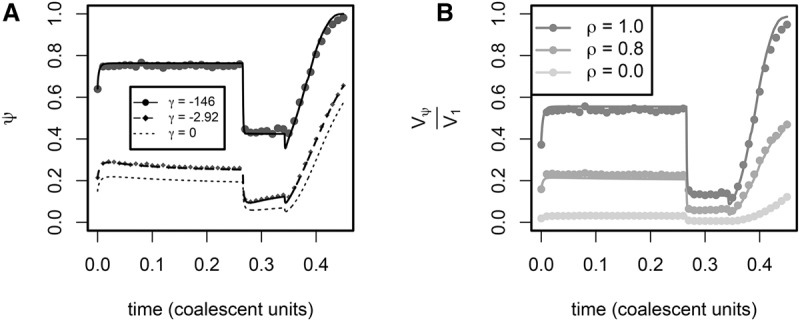
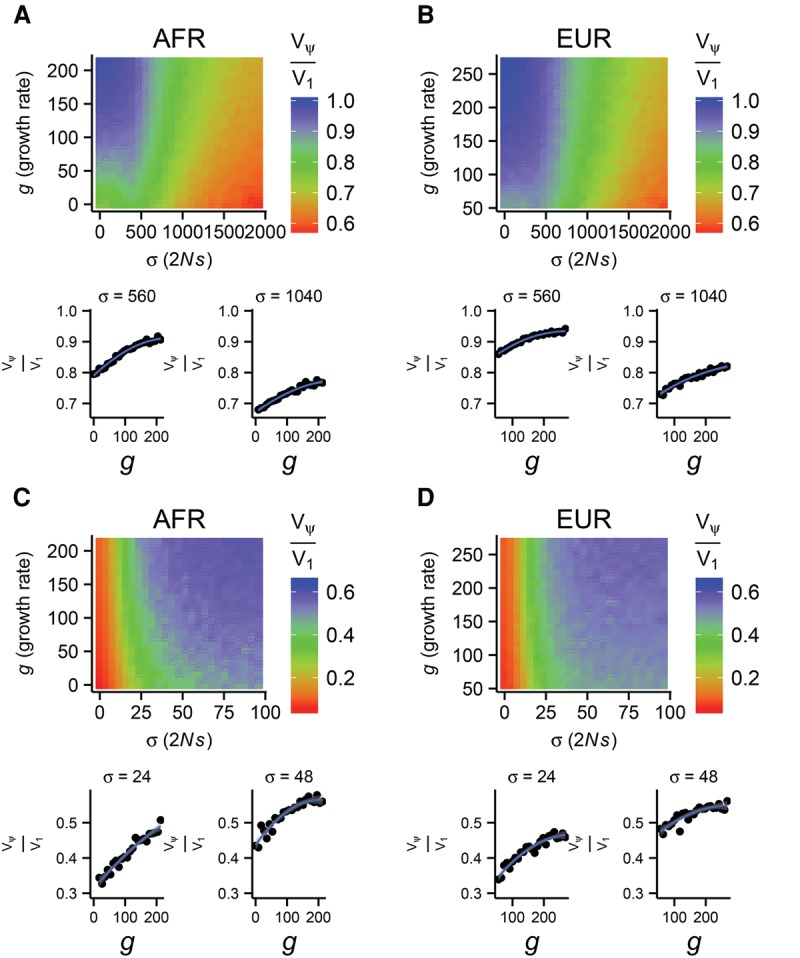
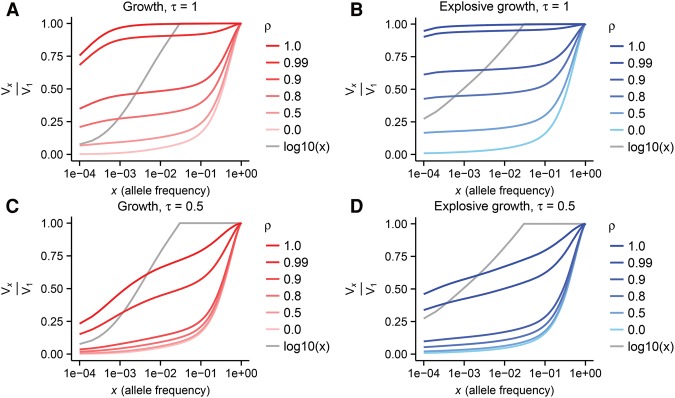
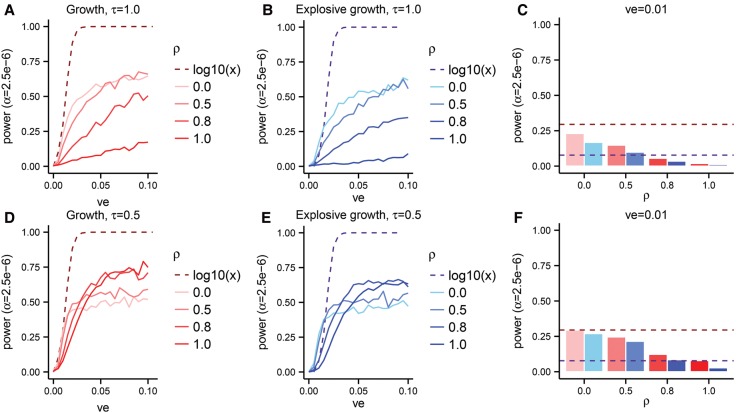
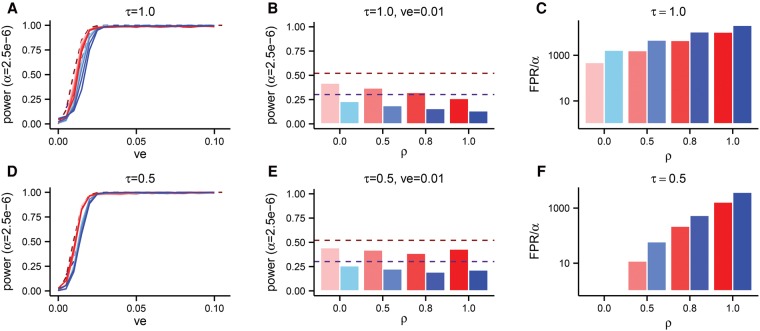
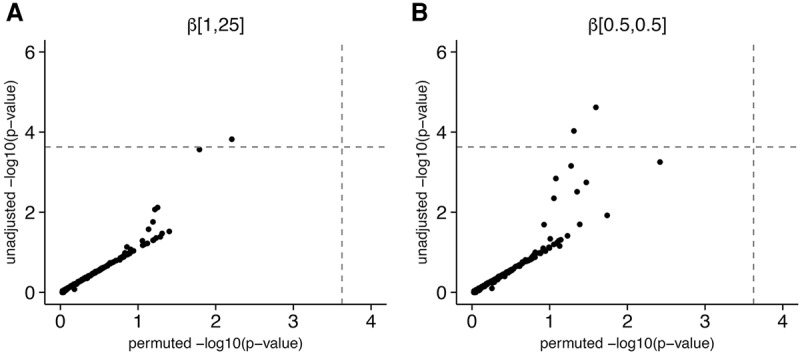
The role of rare alleles in complex phenotypes has been hotly debated, but most rare variant association tests (RVATs) do not account for the evolutionary forces that affect genetic architecture. Here, we use simulation and numerical algorithms to show that explosive population growth, as experienced by human populations, can dramatically increase the impact of very rare alleles on trait variance. We then assess the ability of RVATs to detect causal loci using simulations and human RNA-seq data. Surprisingly, we find that statistical performance is worst for phenotypes in which genetic variance is due mainly to rare alleles, and explosive population growth decreases power. Although many studies have attempted to identify causal rare variants, few have reported novel associations. This has sometimes been interpreted to mean that rare variants make negligible contributions to complex trait heritability. Our work shows that RVATs are not robust to realistic human evolutionary forces, so general conclusions about the impact of rare variants on complex traits may be premature.


Figures

Figure 1.
Figure 1.
Time-dependence of singleton variants under a European growth model (Gravel et al. 2011). (A) The proportion of variable sites that are singletons (ψ). (B) The proportion of the genetic variance in a complex trait that is due to singletons. A sample of n = 500 chromosomes was used for each panel. The solid, dashed, and dotted lines show the results of our numerical algorithm, whereas the points are the results of stochastic forward simulations. Each point represents the mean across 100 simulations. The demographic model consists of an expansion event at time 0, successive bottlenecks at times 0.27 and 0.34, and sustained exponential growth after the last bottleneck (see Methods, “Calculating the impact of demographic events on genetic architecture” for complete model details).
Figure 2.
Figure 2.
The fraction of the genetic variance that is contributed by singletons, Vψ/V1, in a sample of n = 103 chromosomes as a function of growth rate (g) and standard deviation in selection strength (σ) in models of both African (A,C) and European (B,D) demographic history. The mean selection strength was fixed at 2Ns = −450 (A,B) and 2Ns = −8 (C,D), with ρ = 0.99 and τ = 1.0. The smaller panels plot two cross sections of each heat map to show changes in Vψ/V1.
Figure 3.
Figure 3.
The cumulative proportion of the genetic variance, Vx/V1, explained by variants under allele frequency x for the European “growth” (A,C) and “explosive growth” (B,D) models of human history under two different values of τ for a sample of n = 104 chromosomes.
Figure 4.
Figure 4.
The power of SKAT-O in Europeans as a function of the variance explained (ve) by a gene on a phenotype in a sample of size n = 104 chromosomes under various effect size models. The explosive growth model (B,E) of Tennessen et al. (2012) is shown in shades of blue, and the growth model (A,D) of Gravel et al. (2011) is shown in shades of red. The dashed lines show the power when the effect sizes are taken to be proportional to log10(x) for alleles at frequency x, whereas the solid lines (A,B,D,E) and bars (C,F) show results from our phenotype model. Panel C aggregates data from A and B for ve = 0.01, while panel F aggregates data from D and E for ve = 0.01.
Figure 5.
Figure 5.
The power and false positive rate (FPR) of SKAT-O in Europeans with the weights of SKAT-O adjusted to β[0.5, 0.5], in a sample size of n = 104 chromosomes. The explosive growth model of Tennessen et al. (2012) is shown in shades of blue, and the growth model of Gravel et al. (2011) is shown in shades of red. The dashed lines show the power when the effect sizes are taken to be proportional to log10(x) for alleles at frequency x, whereas the solid lines (A,D) and bars (B,E) show results from our phenotype model. Each solid line in A and D corresponds to a different value of ρ, using the same color scheme as in the other panels. (B,E) Aggregate data from A and D, but specifically for variance explained (ve) equal to 0.01. In C and F, we plot the FPR divided by 2.5 × 10⁻⁶ (α), which represents the fold increase in FPR.
Figure 6.
Figure 6.
Scatter plots of unadjusted SKAT-O P-values against permutation-based P-values for tests of association between coding variation in STAT1 and RNA expression levels of STAT1 target genes. Each point represents a single target gene. (A) P-values for the default parameterization of SKAT-O. (B) P-values for the test with more weight shifted onto rare variants.

References

    1. The 1000 Genomes Project Consortium. 2015. A global reference for human genetic variation. Nature 526: 68–74. - PMC - PubMed
    1. Arbiza L, Gronau I, Aksoy BA, Hubisz MJ, Gulko B, Keinan A, Siepel A. 2013. Genome-wide inference of natural selection on human transcription factor binding sites. Nat Genet 45: 723–729. - PMC - PubMed
    1. Auton A, Bryc K, Boyko AR, Lohmueller KE, Novembre J, Reynolds A, Indap A, Wright MH, Degenhardt JD, Gutenkunst RN, et al. 2009. Global distribution of genomic diversity underscores rich complex history of continental human populations. Genome Res 19: 795–803. - PMC - PubMed
    1. Balick DJ, Do R, Cassa CA, Reich D, Sunyaev SR. 2015. Dominance of deleterious alleles controls the response to a population bottleneck. PLoS Genet 11: e1005436. - PMC - PubMed
    1. Bhaskar A, Wang YR, Song YS. 2015. Efficient inference of population size histories and locus-specific mutation rates from large-sample genomic variation data. Genome Res 25: 268–279. - PMC - PubMed

Publication types