. 2016 Jul;26(7):1000-9.
doi: 10.1101/gr.200386.115. Epub 2016 Apr 28.

The mRNA-bound proteome of the early fly embryo

Affiliations

The mRNA-bound proteome of the early fly embryo

Hans-Hermann Wessels et al. Genome Res. 2016 Jul.

Abstract

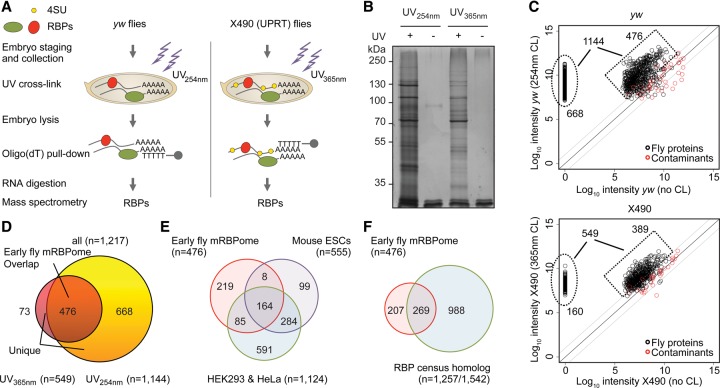
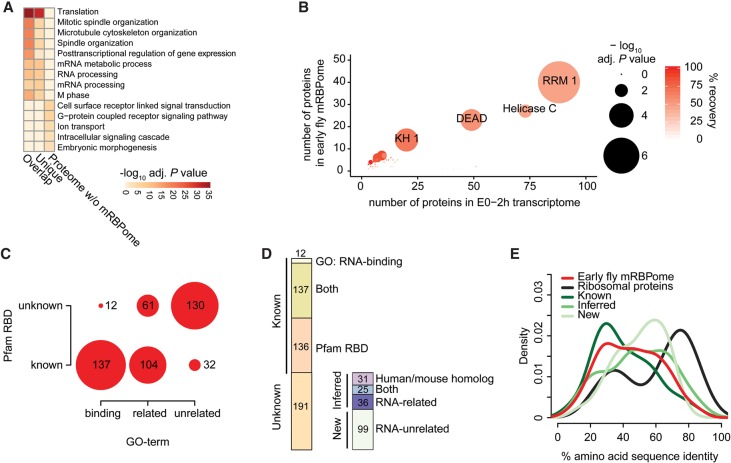
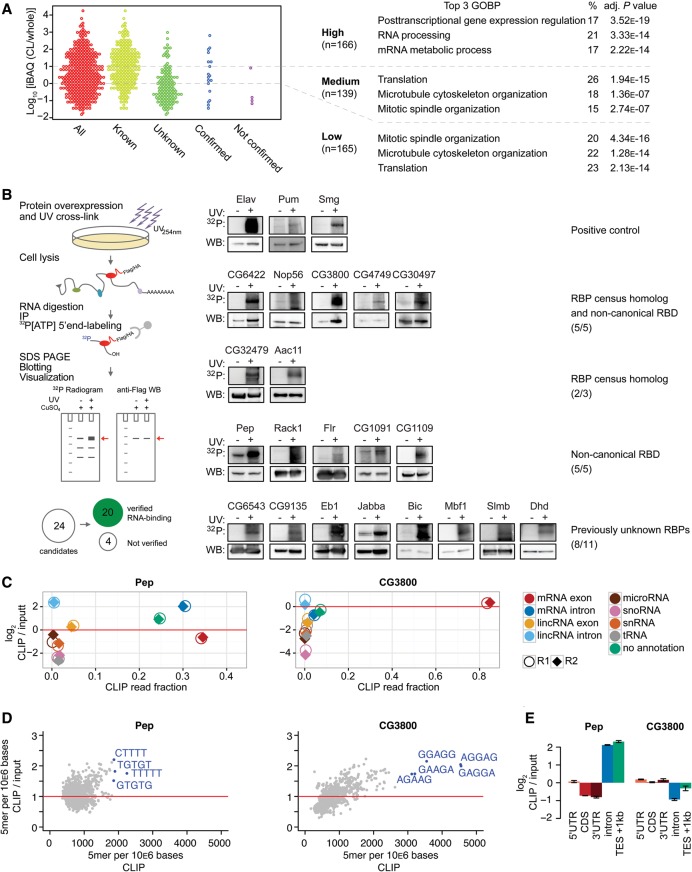
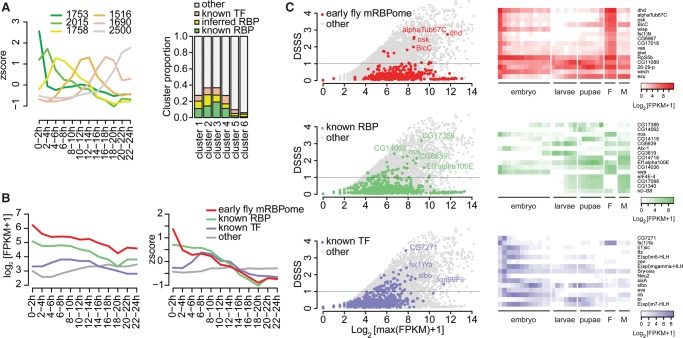
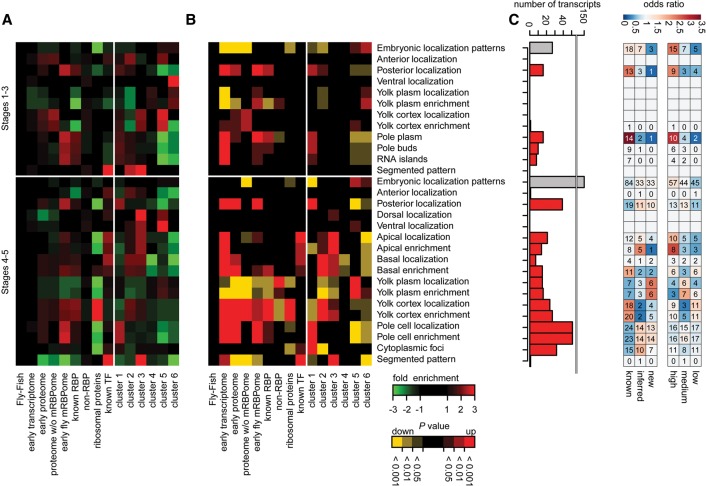
Early embryogenesis is characterized by the maternal to zygotic transition (MZT), in which maternally deposited messenger RNAs are degraded while zygotic transcription begins. Before the MZT, post-transcriptional gene regulation by RNA-binding proteins (RBPs) is the dominant force in embryo patterning. We used two mRNA interactome capture methods to identify RBPs bound to polyadenylated transcripts within the first 2 h of Drosophila melanogaster embryogenesis. We identified a high-confidence set of 476 putative RBPs and confirmed RNA-binding activities for most of 24 tested candidates. Most proteins in the interactome are known RBPs or harbor canonical RBP features, but 99 exhibited previously uncharacterized RNA-binding activity. mRNA-bound RBPs and TFs exhibit distinct expression dynamics, in which the newly identified RBPs dominate the first 2 h of embryonic development. Integrating our resource with in situ hybridization data from existing databases showed that mRNAs encoding RBPs are enriched in posterior regions of the early embryo, suggesting their general importance in posterior patterning and germ cell maturation.


Figures

Figure 1.
Figure 1.
Identification of poly(A)+ RNA-bound proteins in fly embryos. (A) Schematic overview of mRNA interactome capture in early yw and X490 Drosophila melanogaster embryos. (B) Oligo(dT) precipitates of UV-crosslinked (+) and noncrosslinked (−) lysed yw and X490 embryos were separated by SDS-PAGE and silver-stained. (C) Scatterplot showing log10-transformed intensities of proteins in oligo(dT) pull-downs from crosslinked embryos versus log10-transformed intensities of proteins in oligo(dT) precipitates from noncrosslinked yw (top) and X490 (bottom) embryos. Proteins with at least two unique peptides and greater than 10-fold intensity in oligo(dT) pull-downs from crosslinked embryos compared to oligo(dT) precipitates from noncrosslinked embryos are considered as enriched and part of the early fly RNA-bound proteome (black). Common contaminant proteins (e.g., trypsin and keratin) are marked in red. (D) Venn diagram depicting the overlap of RNA-bound proteins (n = 1217) identified in yw (n = 1144) and/or X490 (n = 549) embryos. Four hundred seventy-six proteins overlap in both approaches and are referred to as the early fly mRBPome. Seven hundred forty-one proteins were uniquely identified. (E) Overlap of the early fly mRBPome (n = 476) to mRNA interactome studies in mouse mESCs (Kwon et al. 2013) and human HEK 293 and HeLa cells (Baltz et al. 2012; Castello et al. 2012) and (F) to the human RBP census (Gerstberger et al. 2014).
Figure 2.
Figure 2.
Characterization of the early fly mRBPome. (A) GO analysis showing the five most enriched gene ontology terms for molecular functions (GOMF) of the mRNA-bound proteins (overlap and unique) and the remaining proteins identified from whole embryos. P values were calculated by comparing against the early embryo transcriptome (0–2-h old embryos, all genes with FPKM > 0), adjusted for multiple testing with Benjamini-Hochberg and −log10-transformed. (B) Pfam protein domain enrichment of the early embryo mRBPome (n = 476) (y-axis) compared to the early embryo transcriptome (n = 7298) (x-axis). P values were calculated with Fisher's exact test and Bonferroni-corrected for multiple testing, indicated by circle size. Red shading indicates recovery percentages of expressed genes. (C) The intersection of proteins with known RNA-binding GO-term and Pfam RNA-binding domain (RBD) (list of RBDs and RNA-binding GO-terms described by Gerstberger et al. [2014]). (D) Proportions of proteins previously annotated as known RBPs by either GO-term or RBD (Known) and proteins not previously found to directly interact with RNA (Unknown). Unknown proteins contain homologs identified in mouse and human mRNA interactome studies and/or are part of the human RBP census, and proteins with RNA-related GO-terms (together referred to as ‘inferred RBPs’). ‘New’ refers to the 99 proteins undescribed in terms of RNA-binding. (E) Protein amino acid sequence identity to human homologous proteins using Ensembl Compara (Vilella et al. 2009). The early fly mRBPome without ribosomal proteins (n = 371) is depicted in subgroups containing: ribosomal proteins (n = 56), all known RBPs (n = 206), inferred RBPs (n = 80), and new RBPs (n = 85).
Figure 3.
Figure 3.
Validation of direct RNA interaction of candidate RBPs. (A) Protein enrichment (log10 iBAQ ratios of proteins in oligo[dT] precipitate versus whole-embryo proteins). Proteins are divided by enrichment score (high = >10-fold enrichment, middle = 1–10-fold enrichment, low = <1-fold enrichment) (six proteins [two validation candidates] missed whole embryo detection and could not be added here). The three most enriched GO-terms for biological processes (GOBP) for each category are shown on the right. Validation candidates were chosen throughout the enrichment ratio range, and were not annotated as RNA-binding in GOMF or having classical RBDs (except Pep). (B) Scheme describing the experimental approach. Epitope-tagged candidate RBPs were expressed in transiently or stably transfected Drosophila S2 cells. After 254-nm UV-crosslinking, cell lysis, and RNase digestion, the immunoprecipitated crosslinked protein-RNA complexes were radiolabeled by T4 PNK phosphorylation and separated by SDS-PAGE. 32P-autoradiogram and Western blot analysis of 254-nm UV-crosslinked (+) and noncrosslinked (−) complexes for each indicated RBP candidate are shown. Known RBPs (Elav, Pum, Smg), served as positive controls. RNA-signals were compared against FLAG-IP of crosslinked parental S2 cells to estimate nonspecific signal. RBP candidates Wech, GlyP, Hsc70Cb, and CG6287 could not be verified. (C) Enrichment of uniquely aligned CLIP sequencing reads relative to matched total RNA input for Pep and CG3800. X-axis: fraction of reads per million (RPM). Y-axis: log2-transformed RPM ratio of CLIP vs input samples. (Circles, replicate 1; diamonds, replicate 2.) (D) 5-mer enrichment of randomly sampled aligned RBP CLIP reads relative to matched inputs. X-axis: frequency of 5-mer in 106 bases. Y-axis: 5-mer frequency ratio CLIP vs. input. (E) Enrichment analysis of aligned sequencing reads to mRNA subannotation categories. Sequencing reads were normalized to reads per kilo base per million (RPKM). Y-axis: log2-transformed ratio of annotation categories RPKMs in CLIP vs. input. (TES) transcription end site.
Figure 4.
Figure 4.
RBP expression in Drosophila development. (A) Clustering of z-score-transformed gene expression levels of protein-coding genes expressed during embryogenesis (0–24-h post egg laying) (n = 11,232) (Graveley et al. 2011) into six condensed, timely resolved clusters. (Left) Cluster median z-score-transformed expression values over time. Clusters sizes are indicated in order 1 through 6. (Right) Cluster proportions of all known RBP (harboring RBDs or RNA-binding GO annotation), inferred RBPs (as described in Fig. 2D), and known TFs (FlyTF.org). (B) Median of absolute expression values (log2[FPKM + 1]) and relative expression values (z-score) of the early embryo mRBPome without ribosomal proteins, known RBPs without ribosomal proteins, and known TFs over time during embryogenesis. (C) Developmental Stage Specificity Score (DSSS) for genes expressed during 30 developmental stages (Graveley et al. 2011) for all protein-coding genes (n=13,452). Scatterplot of DSSS relative to log2-transformed maximal expression levels for the indicated subsets (left) and heat map of log2-transformed FPKM + 1 expression values of the 15 most specific members of each subset.
Figure 5.
Figure 5.
Localization of RBP-enocding mRNAs in early Drosophila embryos. RNA fluorescent in situ hybridization information from the Fly-FISH database (Lécuyer et al. 2007) was used to empirically calculate overrepresented transcript localization annotation terms by random sampling relative to the Fly-FISH database. Heat map indicating fold changes (A) and P values (B) for each subset for embryonic localization terms in embryonic developmental stages 1–3 and 4–5. Early transcriptome: protein coding genes expressed (FPKM > 0) in 0–2-h embryos; early proteome: proteins identified by whole 0–2-h embryo mass spectrometry; proteome without mRBPome: does not contain genes identified by mRBPome capture; known RBPs: RBPs selected by GO-term and RBD within the transcriptome excluding ribosomal proteins; non-RBP: transcriptome without known RBPs; ribosomal proteins: all ribosomal proteins; known TF: transcription factors from FlyTF.org database. Clusters as in Fig. 4A. Relative subset representation can be assessed in Supplemental Figure S5A. (C) The number of transcripts of the early fly mRBPome for each localization category. Gray bars = number for all transcripts with spatially restricted (≠ ubiquitous) embryonic localization terms within stages 1–3 and 4–5, respectively; red bars = number of transcripts in individual localization categories. Odds ratio of subcategories relative to the early fly mRBPome. Subcategories represent classification from Figures 2D and 3A.

Similar articles

Cited by

References

    1. Anantharaman V, Koonin EV, Aravind L. 2002. Comparative genomics and evolution of proteins involved in RNA metabolism. Nucleic Acids Res 30: 1427–1464. - PMC - PubMed
    1. Baltz AG, Munschauer M, Schwanhäusser B, Vasile A, Murakawa Y, Schueler M, Youngs N, Penfold-Brown D, Drew K, Milek M, et al. 2012. The mRNA-bound proteome and its global occupancy profile on protein-coding transcripts. Mol Cell 46: 674–690. - PubMed
    1. Bardsley A, McDonald K, Boswell RE. 1993. Distribution of tudor protein in the Drosophila embryo suggests separation of functions based on site of localization. Development 119: 207–219. - PubMed
    1. Bartel DP. 2009. MicroRNAs: target recognition and regulatory functions. Cell 136: 215–233. - PMC - PubMed
    1. Bazzini AA, Miller LT, Giraldez AJ. 2012. Ribosome profiling shows that miR-430 reduces translation before causing mRNA decay in zebrafish. Science 336: 233–237. - PMC - PubMed

Publication types