. 2016 Jun;26(6):799-811.
doi: 10.1101/gr.204578.116. Epub 2016 May 12.

Divergence of a conserved elongation factor and transcription regulation in budding and fission yeast

Affiliations

Divergence of a conserved elongation factor and transcription regulation in budding and fission yeast

Gregory T Booth et al. Genome Res. 2016 Jun.

Erratum in

Abstract

Complex regulation of gene expression in mammals has evolved from simpler eukaryotic systems, yet the mechanistic features of this evolution remain elusive. Here, we compared the transcriptional landscapes of the distantly related budding and fission yeast. We adapted the Precision Run-On sequencing (PRO-seq) approach to map the positions of RNA polymerase active sites genome-wide in Schizosaccharomyces pombe and Saccharomyces cerevisiae. Additionally, we mapped preferred sites of transcription initiation in each organism using PRO-cap. Unexpectedly, we identify a pause in early elongation, specific to S. pombe, that requires the conserved elongation factor subunit Spt4 and resembles promoter-proximal pausing in metazoans. PRO-seq profiles in strains lacking Spt4 reveal globally elevated levels of transcribing RNA Polymerase II (Pol II) within genes in both species. Messenger RNA abundance, however, does not reflect the increases in Pol II density, indicating a global reduction in elongation rate. Together, our results provide the first base-pair resolution map of transcription elongation in S. pombe and identify divergent roles for Spt4 in controlling elongation in budding and fission yeast.


Figures

Figure 1.
Figure 1.
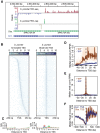
PRO-seq and PRO-cap capture transcription elongation and initiation genome-wide in S. pombe. (A) Browser tracks of PRO-seq (plus strand: red; minus strand: blue) and PRO-cap data (plus strand: green; minus strand: olive) derived from S. pombe. Green gene models below the data tracks show the reannotated, “observed” transcription start-sites based on PRO-cap data. Blue gene models correspond to the available annotations of genes. (B) Heatmaps of S. pombe PRO-cap signal for each base within ±250 bp around the annotated TSS (left) and PRO-cap observed TSS (right) for all active and filtered genes (n = 3214). Genes within heatmaps are sorted by increasing downstream distance of observed TSS relative to annotated TSS. (C) Sequence logos of 10-bp sequence centered on either annotated TSS (left) or observed TSS (right) generated using WebLogo (Crooks et al. 2004). (D) PRO-cap signal from samples prepared either with or without Tobacco Acid Pyrophosphatase (TAP) treatment centered on annotated TSS. The TAP-minus samples represent empirical levels of background for each genomic position. (E) Median PRO-cap signal from samples prepared either with or without TAP treatment centered on observed TSS. (F) Median MNase-seq coverage centered on annotated TSSs (blue) or observed TSSs (brown). For the metagene plots, the y-axis shows the median read counts for each base-pair (D,E), or median read coverage within 10-bp bins (F). In D, E, and F, the 12.5% and 87.5% quantiles are shown in lightly shaded regions.
Figure 2.
Figure 2.
PRO-seq reveals distinct transcription elongation profiles in S. cerevisiae and S. pombe. (A,B) Median PRO-seq read count across all active and filtered genes in S. cerevisiae (A) or S. pombe (B) that are separated from neighboring genes on the strand by at least 1 kb (S. cerevisiae: n = 1101; S. pombe: n = 874). Bins between the +300 and −300 bp marks are scaled based on gene length, whereas upstream of and downstream from this center region, 10-bp bins were used. The shaded regions around the curves represent the 12.5% and 87.5% quantiles. (C,D) Representative genes from S. cerevisiae (C) and S. pombe (D) with PRO-seq read counts plotted above. (E,F) Box plots of pausing index (E) or termination index (F) values calculated for all genes that were included in A and B. P-values represent results of Student's t-test. (G) A test for enrichment of pausing near the promoter versus other gene regions. Reads were counted within a sliding 100-bp window from 0 to 1000 bp from the TSS of all filtered, active genes and divided by the counts within the remaining mappable gene length. Fisher's exact test was used to determine the number of significantly paused genes (adjusted P < 0.01).
Figure 3.
Figure 3.
Pol II distributions at paused genes in S. pombe are coupled with increased nucleosome occupancy or positioning. (A,B) Browser images of PRO-seq read counts across S. pombe genes classified as either high-confidence paused (A) or not paused (B). (C) Median PRO-seq read counts within 1 kb upstream of and downstream from the observed TSS of paused and not paused genes. (D) Median MNase-seq read coverage within 1 kb upstream of and downstream from the observed TSS of paused and not paused genes. (E,F) PRO-seq signal around gene-body nucleosome centers for paused (E) and not paused genes (F). (G,H) PRO-seq signal around +1 nucleosome centers for paused (G) and not paused genes (H). For metagene plots in CH, medians reflect 5-bp bins, and the 12.5% and 87.5% quantiles are shown as shaded regions. All panels represent profiles of combined wild-type biological replicates.
Figure 4.
Figure 4.
Deletion of Spt4 results in genome-wide increase in Pol II density within gene bodies of S. cerevisiae and S. pombe. (A,B) MA plots showing the DESeq2-based differential expression analysis of spike-in normalized PRO-seq read-counts within the gene bodies of S. cerevisiae (A) and S. pombe genes (B). (C,D) Example of spt4Δ affected gene in S. cerevisiae (C) and S. pombe (D). Browser tracks correspond to PRO-seq data derived separately from two biological replicates of WT (green) and spt4Δ (red) in budding and fission yeast.
Figure 5.
Figure 5.
Global increase in Pol II density in spt4Δ does not result in increased transcript abundance in S. cerevisiae or S. pombe. (A,B) Box plots comparing the fold change in gene-body PRO-seq density resulting from the deletion of Spt4 with the corresponding change in poly-A selected RNA-seq in S. cerevisiae (A) and S. pombe (B). P-values represent the results of Student's t-test.
Figure 6.
Figure 6.
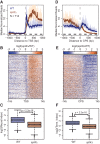
5′ and 3′ ends of genes exhibit a loss of Pol II density as a result of Spt4 deletion in S. pombe. (A,D) Median PRO-seq signal around the observed TSS (A) or CPS (D) of active, filtered genes longer than 1 kb and separated from the boundaries of neighboring genes on the same strand by at least 1 kb. Medians reflect 10-bp bins, and the 12.5% and 87.5% quantiles are shown in light shaded regions. (B,E) Heatmaps of log2 fold change of mutant versus wild type per 10-bp bin around the TSS (B) or CPS (E) for all genes used in A and D. Genes within heatmaps are sorted by decreasing amount of wild-type PRO-seq reads within the first 500 bp downstream from the TSS. (C) Box plots showing the distribution of pausing index values for WT and spt4Δ in S. pombe. (F) Box plots showing the distribution of termination index values for WT and spt4Δ in S. pombe. P-values represent the results of Student's t-test.

Similar articles

Cited by

References

    1. Adelman K, Lis JT. 2012. Promoter-proximal pausing of RNA polymerase II: emerging roles in metazoans. Nat Rev Genet 13: 720–731. - PMC - PubMed
    1. Brannan K, Kim H, Erickson B, Glover-Cutter K, Kim S, Fong N, Kiemele L, Hansen K, Davis R, Lykke-Andersen J, et al. 2012. mRNA decapping factors and the exonuclease Xrn2 function in widespread premature termination of RNA polymerase II transcription. Mol Cell 46: 311–324. - PMC - PubMed
    1. Castel SE, Ren J, Bhattacharjee S, Chang AY, Sánchez M, Valbuena A, Antequera F, Martienssen RA. 2014. Dicer promotes transcription termination at sites of replication stress to maintain genome stability. Cell 159: 572–583. - PMC - PubMed
    1. Churchman LS, Weissman JS. 2011. Nascent transcript sequencing visualizes transcription at nucleotide resolution. Nature 469: 368–373. - PMC - PubMed
    1. Collart MA, Oliviero S. 2001. Preparation of yeast RNA. Curr Protoc Mol Biol. 10.1002/0471142727.mb1312s23. - DOI - PubMed

Publication types

MeSH terms