. 2016 Jun;26(6):844-51.
doi: 10.1101/gr.201491.115. Epub 2016 Apr 14.

SMASH, a fragmentation and sequencing method for genomic copy number analysis

Affiliations

SMASH, a fragmentation and sequencing method for genomic copy number analysis

Zihua Wang et al. Genome Res. 2016 Jun.

Abstract

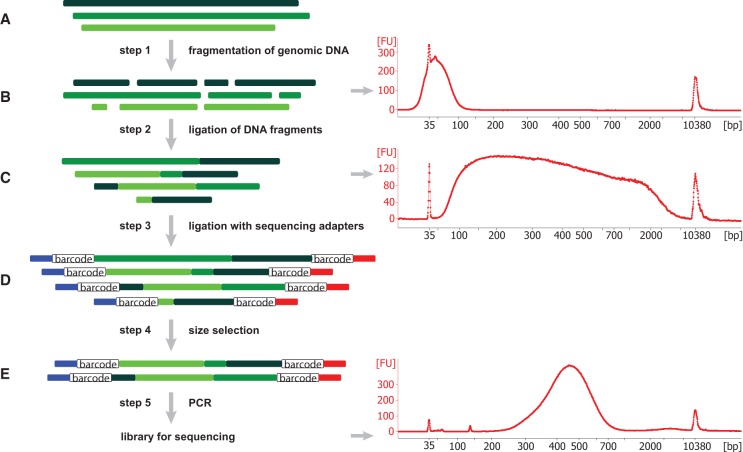
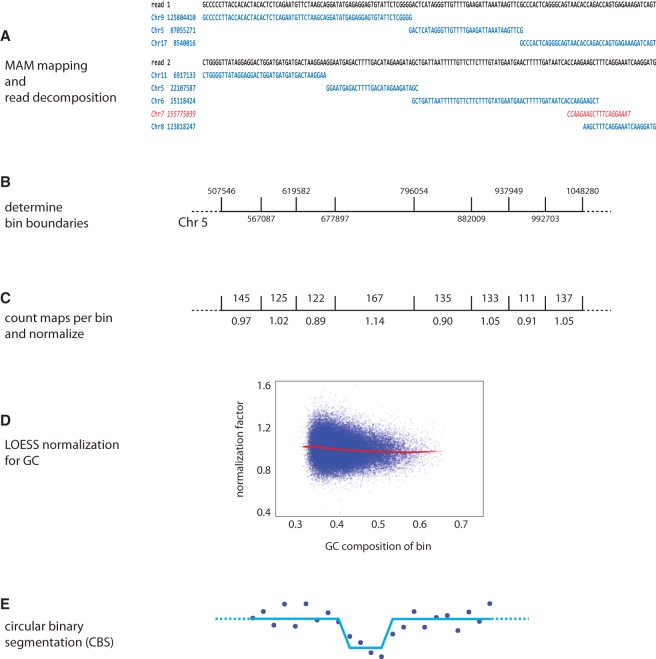
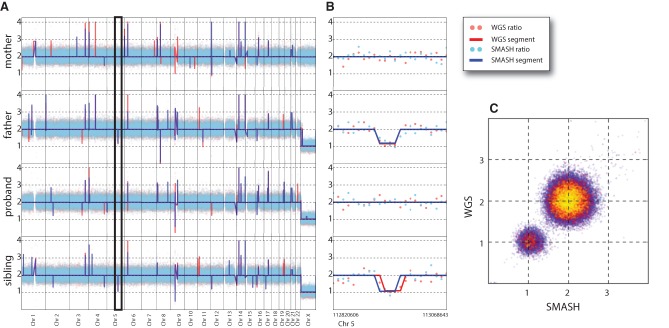
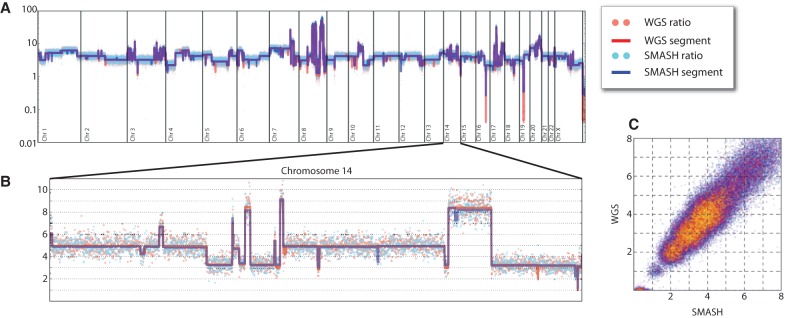
Copy number variants (CNVs) underlie a significant amount of genetic diversity and disease. CNVs can be detected by a number of means, including chromosomal microarray analysis (CMA) and whole-genome sequencing (WGS), but these approaches suffer from either limited resolution (CMA) or are highly expensive for routine screening (both CMA and WGS). As an alternative, we have developed a next-generation sequencing-based method for CNV analysis termed SMASH, for short multiply aggregated sequence homologies. SMASH utilizes random fragmentation of input genomic DNA to create chimeric sequence reads, from which multiple mappable tags can be parsed using maximal almost-unique matches (MAMs). The SMASH tags are then binned and segmented, generating a profile of genomic copy number at the desired resolution. Because fewer reads are necessary relative to WGS to give accurate CNV data, SMASH libraries can be highly multiplexed, allowing large numbers of individuals to be analyzed at low cost. Increased genomic resolution can be achieved by sequencing to higher depth.


Figures

Figure 1.
Figure 1.
Schematic of the SMASH method and size analysis. (A) Three representative genomic DNA molecules, shown in different shades of green, originate from different chromosomes or distant regions of the same chromosome. (B) By sonication and restriction enzyme cleavage, these molecules are fragmented into short double-stranded DNA fragments with average length of 40–50 bp, as shown in the Bioanalyzer result at right. (C) These short DNA pieces are then partially end-repaired and combined into longer stretches of DNA with lengths ranging from 50 bp to 7 kb. Consequently, each resulting chimeric DNA molecule contains short DNA fragments from different locations (shown by varying colors). (D) These DNA stretches are ligated to sequencing adaptors containing sample barcodes, shown in blue and red lines, with the open box designating the sample barcodes. (E) Size selection is carried out to enrich for DNA fragments in the size range of 250–700 bp, which is confirmed via Bioanalyzer. After final PCR, libraries are ready for sequencing. “FU” in the Bioanalyzer plots refers to relative fluorescence units.
Figure 2.
Figure 2.
SMASH informatics pipeline. (A) The decomposition of a read pair into a set of maximal uniquely mappable fragments is shown. In contrast to the red maps, the blue maps satisfy the 20:4 rule and are considered countable maps. (B) Bin boundaries are selected such that each bin has the same number of exact matches from all 50-mers from the reference genome. A representative stretch of Chromosome 5 is displayed. (C) The numbers of 20:4 mappable fragments present in each bin are counted, with duplicate reads excluded. The number above the bin shows the count of maps, and the number below shows the normalized value. (D) LOESS normalization is used to adjust bin counts for sample-specific GC bias. (E) The data are segmented using circular binary segmentation (CBS) of the GC-normalized data.
Figure 3.
Figure 3.
SMASH and WGS copy number profiles for an SSC quad. (A) The whole-genome view (autosomes and X Chromosomes) for the four members of a family is shown. Red and blue dots indicate the reference and GC normalized ratio values for WGS and SMASH, respectively. Similarly, red and blue lines represent the copy number segmentation by CBS (circular binary segmentation) for WGS and SMASH. (B) A deletion on Chromosome 5 is highlighted (expanded section demarcated in A). The deletion, identified by both methods, occurs in the father and is transmitted to the unaffected sibling. (C) The bin-for-bin comparison of the normalized ratio values of the father from WGS and SMASH is illustrated. Red and yellow points show increasingly sparse subsamples of the data points.
Figure 4.
Figure 4.
SMASH and WGS copy number profiles for SKBR3. (A) The complex copy number pattern within the SKBR3 cell line is shown in whole-genome view. Copy number is indicated on a log scale. The red and blue dots show the GC-normalized ratio values for WGS and SMASH, respectively, while the red and blue lines show the copy number segmentation. (B) Chromosome 14 is shown in an expanded view with a linear scale. There is strong agreement between WGS and SMASH in the integer copy number state segmentations and dispersion about the segment mean. (C) A bin-for-bin comparison of the normalized ratio values from WGS (y-axis) and SMASH (x-axis) is displayed as a scatter plot. The red and yellow points show increasingly sparse subsamples of the data points to illustrate density.

References

    1. Alkan C, Kidd JM, Marques-Bonet T, Aksay G, Antonacci F, Hormozdiari F, Kitzman JO, Baker C, Malig M, Mutlu O, et al. 2009. Personalized copy number and segmental duplication maps using next-generation sequencing. Nat Genet 41: 1061–1067. - PMC - PubMed
    1. Fischbach GD, Lord C. 2010. The Simons Simplex Collection: a resource for identification of autism genetic risk factors. Neuron 68: 192–195. - PubMed
    1. Hicks J, Krasnitz A, Lakshmi B, Navin NE, Riggs M, Leibu E, Esposito D, Alexander J, Troge J, Grubor V, et al. 2006. Novel patterns of genome rearrangement and their association with survival in breast cancer. Genome Res 16: 1465–1479. - PMC - PubMed
    1. Iafrate AJ, Feuk L, Rivera MN, Listewnik ML, Donahoe PK, Qi Y, Scherer SW, Lee C. 2004. Detection of large-scale variation in the human genome. Nat Genet 36: 949–951. - PubMed
    1. Iossifov I, Ronemus M, Levy D, Wang Z, Hakker I, Rosenbaum J, Yamrom B, Lee YH, Narzisi G, Leotta A, et al. 2012. De novo gene disruptions in children on the autistic spectrum. Neuron 74: 285–299. - PMC - PubMed