. 2016 Jun;26(6):812-25.
doi: 10.1101/gr.202200.115. Epub 2016 May 4.

Venus flytrap carnivorous lifestyle builds on herbivore defense strategies

Affiliations

Venus flytrap carnivorous lifestyle builds on herbivore defense strategies

Felix Bemm et al. Genome Res. 2016 Jun.

Abstract

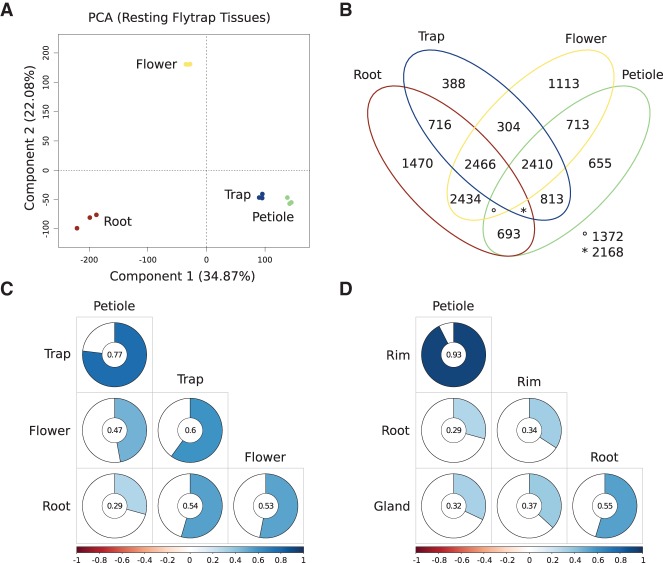
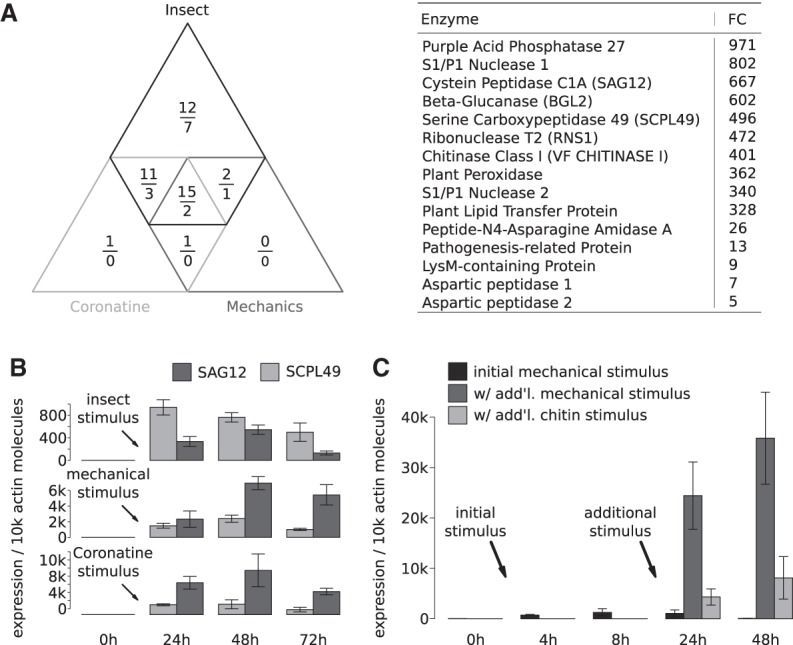
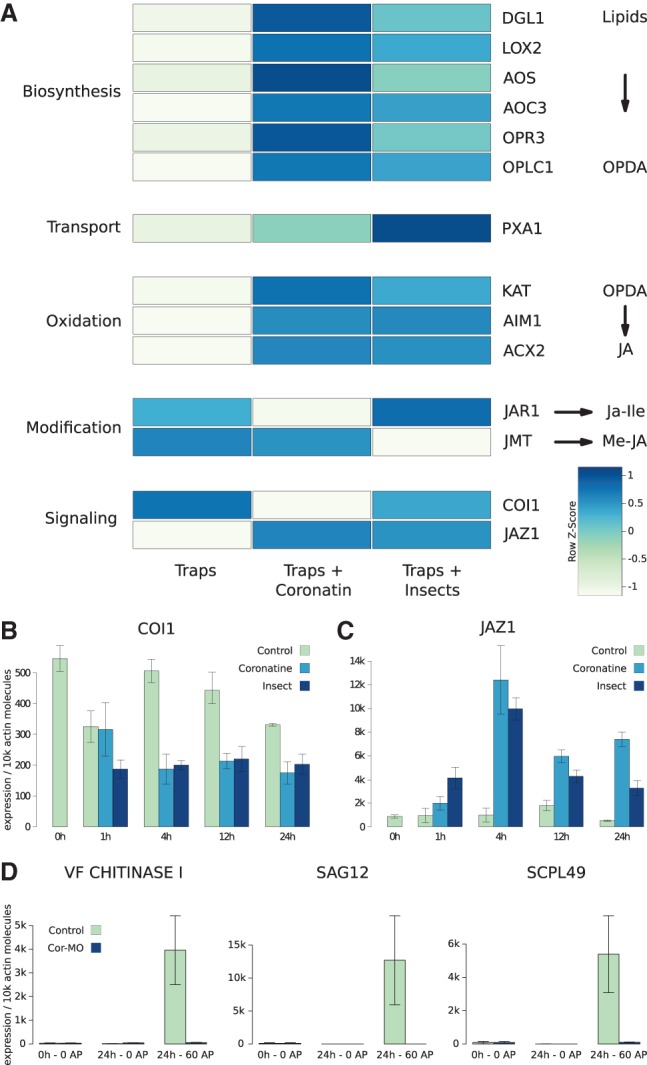
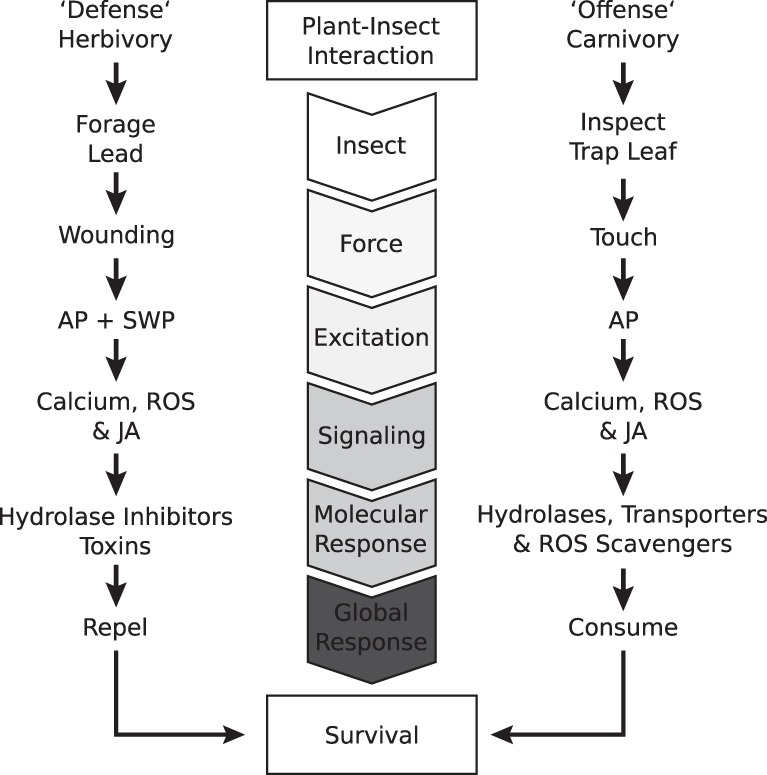
Although the concept of botanical carnivory has been known since Darwin's time, the molecular mechanisms that allow animal feeding remain unknown, primarily due to a complete lack of genomic information. Here, we show that the transcriptomic landscape of the Dionaea trap is dramatically shifted toward signal transduction and nutrient transport upon insect feeding, with touch hormone signaling and protein secretion prevailing. At the same time, a massive induction of general defense responses is accompanied by the repression of cell death-related genes/processes. We hypothesize that the carnivory syndrome of Dionaea evolved by exaptation of ancient defense pathways, replacing cell death with nutrient acquisition.


Figures

Figure 1.
Figure 1.
The transcriptomic landscape of the nonstimulated Venus flytrap (Dionaea muscipula). (A) Principal component analysis of all biological replicates (n = 3) from petiole, trap, root, and flower. The first two dimensions account for 57% of all the variance in the nonstimulated Venus flytrap data (for additional dimensions, see Supplemental Fig. S1). (B) Venn diagram from an all-versus-all differential expression analysis. Overall, 14,744 DEGs were shared by at least two tissues, while 3626 DEGs are most likely expressed in a tissue-specific manner. (C) Hierarchically clustered visualization of the global Pearson correlation between all major organs. All individual pairwise correlations are significant according to multiple testing adjusted probabilities (P ≤ 0.01). (D) Visualization of the global Pearson correlation between all major organs with traps being represented by rim and gland. Again all correlations tested are significant (P ≤ 0.01).
Figure 2.
Figure 2.
Gland functional morphology. (A) REM false-colored micrograph showing a trigger hair (yellow) surrounded by multiple glands (red) on the inner surface of a Dionaea trap. (B) Close-up of glands (from A). (CF) TEM micrographs of gland sections. Structural organization of a gland (C) consisting of three functional layers (L1–L3): outer layer L1 (green), inner layer L2 (brown), and endodermoid layer L3 (blue). Secretory cell of the L1 outer layer (D) characterized by large vacuoles and the presence of rough endoplasmic reticulum. Cell of the inner L2 layer (E) exhibiting numerous plasma membrane invaginations. Beta-oxidation probably occurs in L2 cells, which contain big central vacuoles, numerous peroxisomes, and a remarkable number of mitochondria (see also Supplemental Fig. S2). This implies the existence of energy demanding, metabolically active, processes in L2 cells. Endodermoid (stalk) cell (F) comprising layer L3 harboring plenty of oleosomes.
Figure 3.
Figure 3.
The Dionaea hydrolase cocktail is activated synergistically by touch and taste. (A, left) Venn diagram of potential secretome members from an overlay of RNA-seq data (nonstimulated and insect-stimulated glands) and HTS proteomic measurements of secreted fluid from chemically (COR), mechanically, and insect-stimulated traps. Numbers indicate up-regulated (top) and down-regulated (bottom) transcripts. Potential candidates are limited to transcripts that are differentially regulated, contain a proper signal peptide, and are detected at least once using HTS proteomics. (A, right) List of potential secretome members differentially up-regulated after insect stimulation and detected in all three HTS proteomic measurements. (B) qPCR time course of Dionaea marker hydrolases SCPL49 and SAG12 in response to insect, mechanical, and COR stimulation. Both enzymes are up-regulated several thousand-fold after stimulation. Expression at time point 0 h is within statistical noise. (C) Synergistic stimulation of VF CHITINASE I expression in response to an initial mechanical stimulation followed by a chemical stimulus (chitin).
Figure 4.
Figure 4.
Activated Venus flytraps show signs of elevated jasmonate signaling. (A) Heat map depicting the expression of key genes mediating jasmonate biosynthesis, transport, and signaling in activated (COR/insect) versus nonstimulated traps. Expression values are scaled by rows (Z-scoring). The majority of the components are transcriptionally activated by insect or COR stimulation in traps and glandular tissue. Genes encoding the key enzymes of jasmonic acid (JA) biosynthesis such as LOX2 (LIPOXYGENASE 2), AOS (ALLENEOXIDE SYNTHASE), and OPR3 (OXOPHYTODIENOATE-REDUCTASE 3) were highly induced in insect- and COR-stimulated traps and glands. Likewise, the ABC-transporter PXA1 (PEROXISOMAL ABC-TRANSPORTER 1) mediating the import of the JA precursor OPDA (12-oxo-phytodioneic acid) into peroxisomes, and peroxisomal enzymes of the beta-oxidation chain generating JA from OPDA were stimulus induced. JAR1 (JASMONIC ACID RESISTANT 1), which finally converts JA into its physiologically active form JA-Ile, appears specifically induced by insects. (B,C) Quantitative PCR (qPCR) of the Dionaea JA receptor COI1 (CORONATINE INSENSITIVE 1) and its coreceptor/repressor JAZ1 (JASMONATE-ZIM-DOMAIN 1). (D) Effect of the JA-antagonist coronatine-O-methyloxime (COR-MO) on electro-mechanical induction of hydrolase expression. Traps were pretreated 4 h before application of zero or 60 APs with H2O (green) or 100 μM COR-MO (blue). Transcript numbers are given relative to 10,000 molecules of DmACT1 ± SE, n = 6. RNA was sampled after 24 h in response to zero or 60 recorded action potentials (APs). qPCR Abbreviations are as follows: (DGL) DONGLE, PLA1-type phospholipase; (LOX2) LIPOXYGENASE 2; (AOS) ALLENE OXIDE SYNTHASE; (AOC3) ALLENE OXIDE CYCLASE 3; (OPR3) 12-OXOPHYTODIENOATE REDUCTASE 3; (OPCL1) OPC-8:0 COA LIGASE1; (PXA1) PEROXISOMAL ABC TRANSPORTER 1; (KAT) PEROXISOMAL 3-KETOACYL-COA THIOLASE 3; (AIM1) ABNORMAL INFLORESCENCE MERISTEM; (ACX2) ACYL-COA OXIDASE 2; (JAR1) JASMONATE RESISTANT 1; and (JMT) JASMONIC ACID CARBOXYL METHYLTRANSFERASE (Dave and Graham 2012).
Figure 5.
Figure 5.
Cation transporters are highly up-regulated in active traps. (A) Coronatine-induced expression kinetics based on qPCR data of ammonium (DmAMT1; left), potassium (DmHAK5; middle), and sodium (DmHKT1; right) transporters and time course of membrane potential depolarizations in gland cells in response to either 6 mM NH4+, 3 mM K+, or 12 mM Na+. (B) Effect of the JA-antagonist COR-MO on transcript levels of ammonium (DmAMT1; left), potassium (DmHAK5; middle), and sodium (DmHKT1; right) transporters in response to 60 elicited APs. Traps were pretreated with H2O (light gray) or 100 μM COR-MO (dark gray) for 4 h before imposition of APs. Transcript numbers are given relative to 10,000 molecules of DmACT1 ± SE, n = 6. Experimental conditions were as described for Figure 4D.
Figure 6.
Figure 6.
Prevailing signs of defense responses in active Dionaea traps. Semantic similarity between different Arabidopsis thaliana microarray experiments (GSE48676, GSE49981, GSE5520, and GSE50526) and active (insect-activated) traps. The semantic similarity is calculated by a quantitative comparison of all sets of significantly enriched gene ontology terms for each individual experiment. The lower triangle shows individual gene ontology similarities while the upper triangle visualizes the similarity as a relative pie chart. Black frames indicate results of the hierarchical clustering procedure using “complete” as agglomeration method.
Figure 7.
Figure 7.
Turning defense into offense. Flow chart comparing the main events occurring at individual levels during the interaction of insects/herbivores with Dionaea or noncarnivorous plants. Similar to noncarnivorous plants, Dionaea attracts insects by means of volatile and nectar production (Kreuzwieser et al. 2014). Herbivores use plant leaves as a food source and by chewing, for example, caterpillars, impose a wounding event on the plant. In Dionaea, visiting insects generate touch events sensed by the trigger hairs of the trap leaf, triggering APs, while in noncarnivorous plants, slow-wave potentials (SWPs) or APs can be generated. APs represent traveling electrical waves that are capable of generating systemic responses in noncarnivores. In Dionaea, however, AP spreading is confined to the stimulated trap; it is not able to cross the trap–petiole anatomical barrier. Both wounding and touch-evoked electrical signaling trigger similar secondary signaling events: changes in cytosolic calcium concentration, production of reactive oxygen species (ROS), and synthesis of the touch hormone JA. Activation of JA signaling in noncarnivorous plants results in the production of a large number of specialized compounds with established roles in defense. This includes alkaloids, terpenoids, phenylpropanoids, phenolamides, amino acid derivatives, anti-nutritional proteins, and some pathogenesis-related (PR) proteins (Mithöfer and Boland 2012). Conversely, activation of the JA signaling pathway in Dionaea further leads to the expression of a broad spectrum of hydrolases (cf. Fig. 3), ROS scavengers, and finally nutrient uptake transporters. Thus, while in noncarnivorous plants the global objective is to repel a herbivore, Dionaea’s only purpose is to consume it. Both strategies are costly, requiring the investment of a substantial amount of metabolic energy; if successful though, they significantly increase the chance of plant survival.

References

    1. Adamec L. 1997. Mineral nutrition of carnivorous plants: a review. Bot Rev 63: 273–299.
    1. Adams WW III, Cohu CM, Amiard V, Demmig-Adams B. 2014. Associations between the acclimation of phloem-cell wall ingrowths in minor veins and maximal photosynthesis rate. Front Plant Sci 5: 24. - PMC - PubMed
    1. Adlassnig W, Koller-Peroutka M, Bauer S, Koshkin E, Lendl T, Lichtscheidl IK. 2012. Endocytotic uptake of nutrients in carnivorous plants. Plant J 71: 303–313. - PubMed
    1. Albert V, Williams S, Chase M. 1992. Carnivorous plants: phylogeny and structural evolution. Science 257: 1491–1495. - PubMed
    1. Alexa A, Rahnenfuhrer J, Lengauer T. 2006. Improved scoring of functional groups from gene expression data by decorrelating GO graph structure. Bioinformatics 22: 1600–1607. - PubMed

LinkOut - more resources