. 2016 Jun;26(6):745-55.
doi: 10.1101/gr.201814.115. Epub 2016 May 10.

A hot L1 retrotransposon evades somatic repression and initiates human colorectal cancer

Affiliations

A hot L1 retrotransposon evades somatic repression and initiates human colorectal cancer

Emma C Scott et al. Genome Res. 2016 Jun.

Abstract

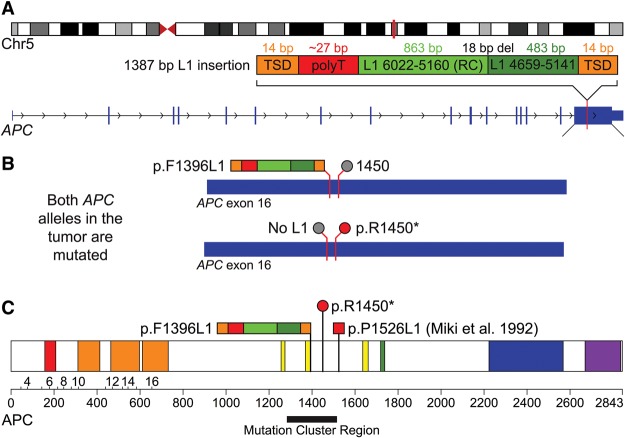
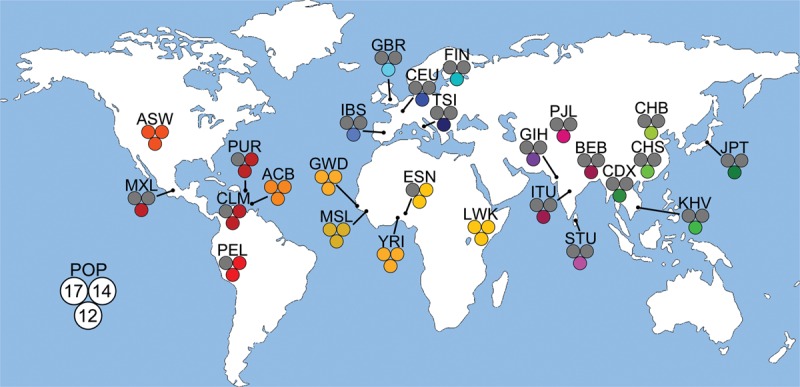
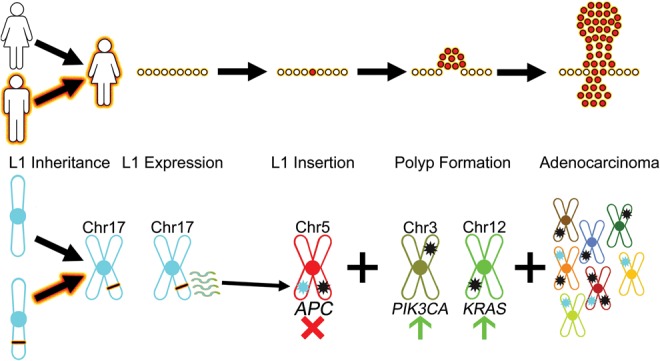
Although human LINE-1 (L1) elements are actively mobilized in many cancers, a role for somatic L1 retrotransposition in tumor initiation has not been conclusively demonstrated. Here, we identify a novel somatic L1 insertion in the APC tumor suppressor gene that provided us with a unique opportunity to determine whether such insertions can actually initiate colorectal cancer (CRC), and if so, how this might occur. Our data support a model whereby a hot L1 source element on Chromosome 17 of the patient's genome evaded somatic repression in normal colon tissues and thereby initiated CRC by mutating the APC gene. This insertion worked together with a point mutation in the second APC allele to initiate tumorigenesis through the classic two-hit CRC pathway. We also show that L1 source profiles vary considerably depending on the ancestry of an individual, and that population-specific hot L1 elements represent a novel form of cancer risk.


Figures

Figure 1.
Figure 1.
Mutagenesis of APC by a somatic L1 insertion. (A) A schematic of the L1 insertion in APC. The top diagram shows the location of the APC gene (vertical red bar) in band q22.2 of Chromosome 5. The diagram below depicts the 1387-bp somatic L1 insertion (dark and light green) in exon 16 of APC with the associated hallmarks of retrotransposition, including a flanking 14-bp TSD (orange), poly(A) tail (T in reverse order; red) and evidence for twin priming (two green boxes separated by an 18-bp deletion at the inversion point). (B) The two diagrams show the inactivating mutations that were discovered in both alleles of APC in the tumor. The top allele is inactivated by the L1 insertion at codon 1396 (multicolored bar; p.F1396L1) and has the reference codon at position 1450 (gray circle). The bottom allele is inactivated by the p.R1450* stop codon (red circle) and does not have an L1 insertion (gray circle). (C) The diagram shows the sites that are affected by these mutations within the APC protein. Also depicted is the L1 insertion identified by Miki et al. (1992) (red square; p.P1526L1). All three of these mutations occur within or near the somatic mutation cluster region (black bar) (Miyoshi et al. 1992) and are similar to other inactivating APC mutations in CRC (see Discussion). This image is adapted from the output of the Protein Painter tool (http://explore.pediatriccancergenomeproject.org/proteinPainter). The APC protein is 2843 amino acids long and consists of the following domains: Suppressor APC (red; involved in nuclear export and other functions); Armadillo/beta-catenin-like repeats (orange; mediate protein–protein interactions); APC cysteine-rich regions (yellow; bind beta-catenin); SAMP (green; binds axin); APC basic (blue; interacts with microtubules); and MAPRE1-binding (aka EB1-binding; purple; binds the microtubule-associating protein MAPRE1).
Figure 2.
Figure 2.
Interior mutations in 295 FL-L1Hs source elements in the patient's genome. (A) The total number of mutations in each FL-L1Hs source element is depicted, grouped by pre-Ta and Ta subfamilies (Boissinot et al. 2000). (B) The Chr 17 FL-L1Hs source element profile is compared to the three closest FL-L1Hs elements in the patient's genome. Although the three most similar elements have 15, 14, and 14 mutations in common with the Chr 17 source element, respectively (middle of Venn diagram), they have 18 total differences (Δ) in all three examples. Similar results were obtained with the remaining elements in the patient's genome (Supplemental Table S2). (C) Mutation frequencies in FL-L1Hs source elements. Individual mutations are plotted by the total number of FL-L1Hs elements in which they are found. A total of 2788 mutations are confined to a single source element (leftmost bar), whereas only a few mutations are shared by the majority of the 295 FL-L1Hs elements in the patient's genome (right bars). This large collection of singleton mutations, and the profiles that are generated by combining these mutations, has allowed us to identify source elements that generated specific somatic offspring insertions in the tumor (Fig. 3) and also allowed us to evaluate the expression of these elements (Fig. 4). (DF) Mutation profiles for the Chr 17 (D), Chr 14 (E), and Chr 12 (F) source elements. All three of these source elements are heterozygous in our patient's genome. Differences from the reference L1.3 element (GenBank ID L19088) (Dombroski et al. 1993) are marked in green, red, blue, and yellow and represent mutations to A, T, C, or G, respectively. We also determined the “allele frequencies” at which mutations appear in the FL-L1Hs source elements from the patient's genome and have depicted these in pie charts above each mutation. Mutations that uniquely tag a single element are marked with a star (*). Black bars above the 3′ ends depict the signatures of mutations that were used to identify somatic offspring insertions in the tumor.
Figure 3.
Figure 3.
Source elements that gave rise to somatic L1 insertions in the tumor. As in Figure 2, the bar diagrams in AC depict mutations in the L1 sequences of source elements and somatic offspring relative to the reference element L1.3. Colored vertical lines represent single nucleotide mutations as outlined in Figure 2. The Circos plots show the somatic offspring L1 insertions that were generated by each FL-L1Hs source element. (A) The Chr 17 source element gave rise to five somatic insertions, including the insertion in APC. The mutation profile of the APC insertion uniquely and perfectly matches that of the Chr 17 FL-L1Hs source element to the extent that the APC insertion spans the 3′ region of the Chr 17 source element. Two of the Chr 17 somatic offspring (denoted by *) had extreme 5′ truncations and thus only had one mutation (C5788T) compared to L1.3. Although the mutation profiles of these offspring do not exclusively match that of the Chr 17 source element, the one remaining possible source element for these somatic offspring (ID 1:86392759) was ruled out due to lack of intact ORFs. (B) The Chr 14 source element gave rise to 12 somatic insertions. The mutation profiles for 11 of 12 (91.7%) of these offspring uniquely and perfectly match the mutation profile of the Chr 14 source element. The remaining somatic offspring (denoted by #) had one additional mutation (T4250G) that was not present in the Chr 14 source element. This mutation does not match any other source element and most likely was introduced during retrotransposition (which is error prone) (Gilbert et al. 2005). The blurry end of somatic offspring 16:56298643 represents ambiguity of the 5′ end because we did not sequence that end. (C) The Chr 12 source element gave rise to two somatic insertions. One was assigned to the Chr 12 source element using mutation profiles as outlined for the Chr 17 and Chr 14 source elements above, whereas the other was assigned using a 3′ transduction (purple box flanked by poly(A) tails in green) (Moran et al. 1999). (D) Circos plot depicting all 27 somatic insertions discovered in this tumor, including the somatic offspring with known source elements depicted above (AC) and eight additional somatic offspring from an unknown source element: (green) unknown chromosome (Un).
Figure 4.
Figure 4.
FL-L1Hs source element expression in normal and tumor tissues. The unique interior mutation profiles of FL-L1Hs elements in the patient's genome (Fig. 2) were used to quantify expression of the 31 nonreference FL-L1Hs source elements including the Chr 17, Chr 14, and Chr 12 source elements (A) and the remaining 264 reference FL-L1Hs source elements in the patient's genome, using strand-specific RNA-seq (B) (Supplemental Table S3; Methods). Expression for each element is depicted in the normal and tumor tissues as the mean number of independent reads covering all mutations unique to a FL-L1Hs source element. Expression of FL-L1Hs source elements that could not be differentiated from the expression of the surrounding gene in the same orientation were excluded from this analysis (A, n = 4; B, n = 37) (Supplemental Table S3). The horizontal dotted lines represent a cutoff where the mean = two traces per unique site, and a total of 10 elements were expressed above this level. (C) DNA methylation analysis of the Chr 17 source element promoter. The top panel displays bisulfite sequencing results for the control 1000 Genomes Project (1KGP) sample (GWD sample HG02583, which is heterozygous for the Chr 17 element; Coriell). The two panels below show the results of bisulfite sequencing in the normal and tumor tissues of the CRC patient. Each circle represents a CpG site in the promoter (for a total of 29 CpGs at positions: 21, 37, 54, 60, 63, 72, 102, 137, 155, 160, 164, 166, 171, 181, 205, 231, 251, 255, 269, 284, 293, 305, 317, 320, 327, 351, 363, 369, 377 relative to the reference L1.3 sequence; GenBank ID L19088). White circles indicate no DNA methylation; black circles indicate DNA methylation. The red highlighting indicates the CpG at position 60 that previously was shown to be critical for repression of the L1 promoter by DNA methylation (Hata and Sakaki 1997). This CpG is mutated in the Chr 17 element (G61A). The three remaining CpG sites that are critical for repression of the L1 promoter by DNA methylation also are indicated (positions 54, 63, 72) (Hata and Sakaki 1997). The blue highlighting indicates a CpG to TpG mutation at position 37 that destroys an additional CpG in the promoter region.
Figure 5.
Figure 5.
Population genetics of source elements in 26 diverse human populations. The 26 diverse human populations that were studied by the 1000 Genomes Project were examined to determine the frequencies of the Chr 17, Chr 14, and Chr 12 elements in global populations. The measurements are depicted by population on the world map as a set of three circles corresponding to the three FL-L1Hs source elements that gave rise to somatic offspring in this study with an accompanying population abbreviation (Supplemental Table S4): (Chr 17) upper left circle; (Chr 14) upper right circle; (Chr 12) bottom circle. Colored circles represent an allele frequency greater than 0 for that respective population, whereas gray circles represent an allele frequency of 0 (Supplemental Table S4). The Chr 17 and Chr 14 source elements are restricted to populations from Africa or African ancestry, whereas the Chr 12 element is found in all 26 of the diverse populations. World map provided by Vector Open Stock (www.vectoropenstock.com), under the Attribution Creative Commons 3.0 license.
Figure 6.
Figure 6.
An oncogenic hot L1 evades somatic repression and initiates CRC. L1 Inheritance: Inheritance of a hot FL-L1Hs source element begins the process of L1-mediated cancer (this study). In this case, the patient inherited an African-specific hot FL-L1Hs source element on Chromosome 17 (black bar with fire outline, bottom) from one of her parents. L1 Expression: The inherited FL-L1Hs source element evades somatic repression and generates transcripts (squiggle lines, bottom) in normal colon tissues (this study). L1 Insertion: A somatic L1 offspring element is integrated into the sixteenth exon of the APC gene, thereby disrupting one APC allele (light blue star on Chr 5, bottom; this study) (Miki et al. 1992). The second APC allele is disrupted by the somatic mutation p.R1450* (black star on Chr 5, bottom; this study). Thus, both gatekeeper APC alleles are disrupted and the adenoma phase is initiated. Polyp Formation: Following loss of APC function, additional important driver mutations in the PIK3CA and KRAS genes (black stars on Chr 3 and Chr 12, respectively, bottom) result in progression to adenocarcinoma (cluster of red cells, top). Adenocarcinoma: Additional driver and passenger mutations occur to further drive progression of adenocarcinoma. These changes include new somatic L1 insertions (light blue stars, bottom), SNVs and indels (black stars, bottom), and perhaps other structural variants.

References

    1. The 1000 Genomes Project Consortium. 2015. A global reference for human genetic variation. Nature 526: 68–74. - PMC - PubMed
    1. Baillie JK, Barnett MW, Upton KR, Gerhardt DJ, Richmond TA, De Sapio F, Brennan PM, Rizzu P, Smith S, Fell M, et al. 2011. Somatic retrotransposition alters the genetic landscape of the human brain. Nature 479: 534–537. - PMC - PubMed
    1. Beck CR, Collier P, Macfarlane C, Malig M, Kidd JM, Eichler EE, Badge RM, Moran JV. 2010. LINE-1 retrotransposition activity in human genomes. Cell 141: 1159–1170. - PMC - PubMed
    1. Beck CR, Garcia-Perez JL, Badge RM, Moran JV. 2011. LINE-1 elements in structural variation and disease. Annu Rev Genomics Hum Genet 12: 187–215. - PMC - PubMed
    1. Boissinot S, Chevret P, Furano AV. 2000. L1 (LINE-1) retrotransposon evolution and amplification in recent human history. Mol Biol Evol 17: 915–928. - PubMed

Publication types