. 2016 Jul;26(7):896-907.
doi: 10.1101/gr.197632.115. Epub 2016 May 9.

The interaction of PRC2 with RNA or chromatin is mutually antagonistic

Affiliations

The interaction of PRC2 with RNA or chromatin is mutually antagonistic

Manuel Beltran et al. Genome Res. 2016 Jul.

Abstract

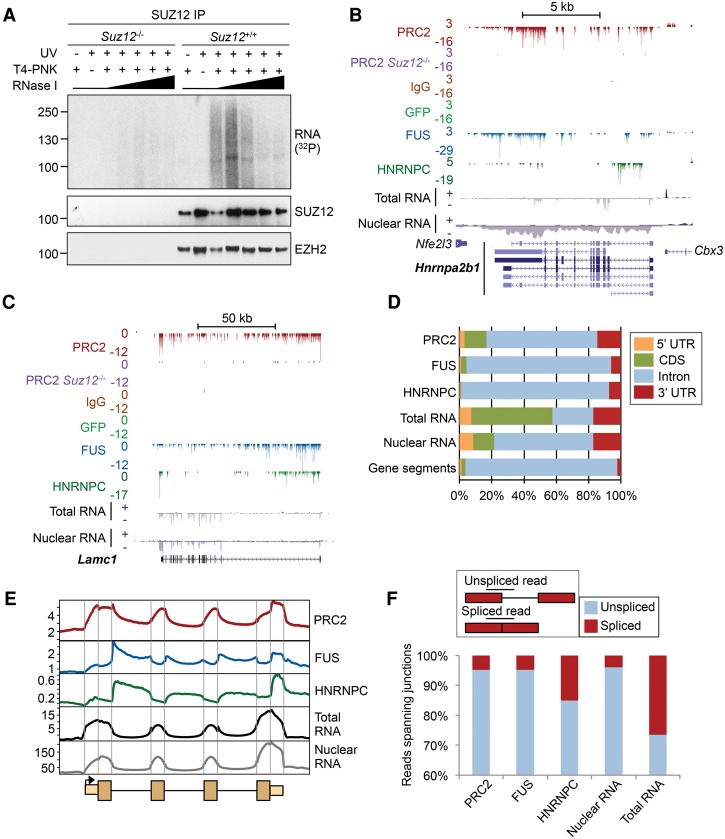
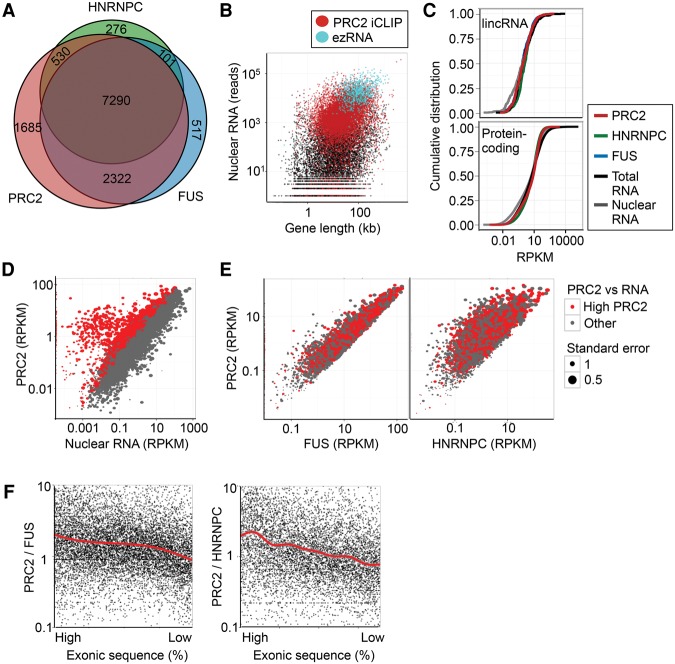
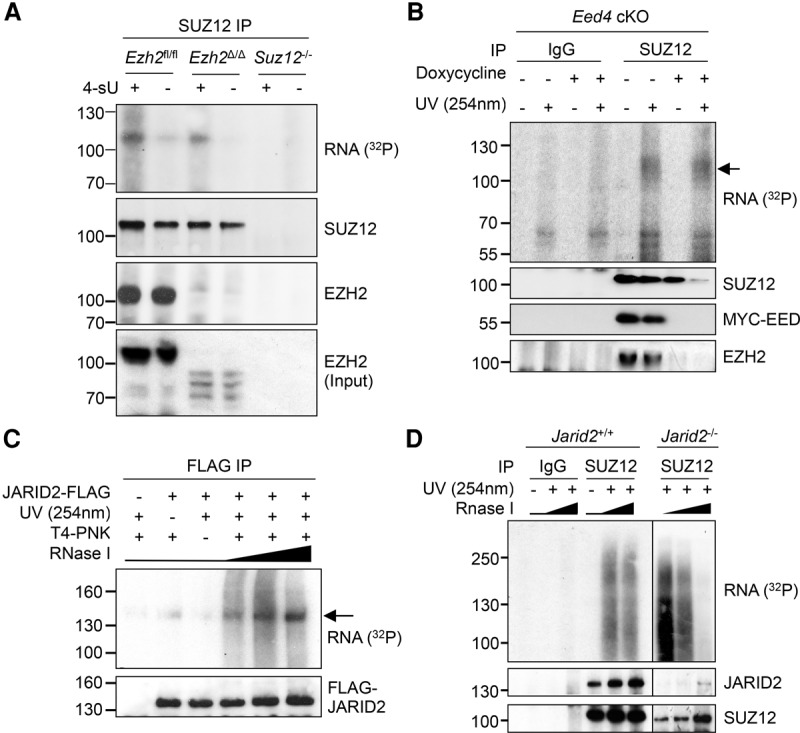
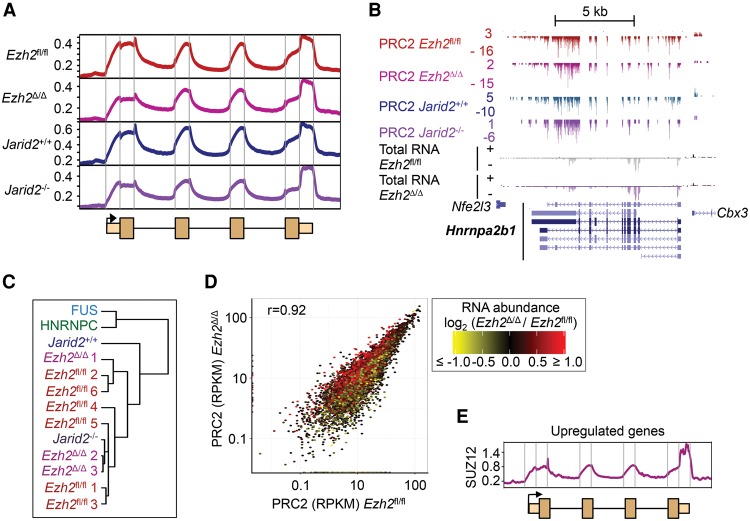
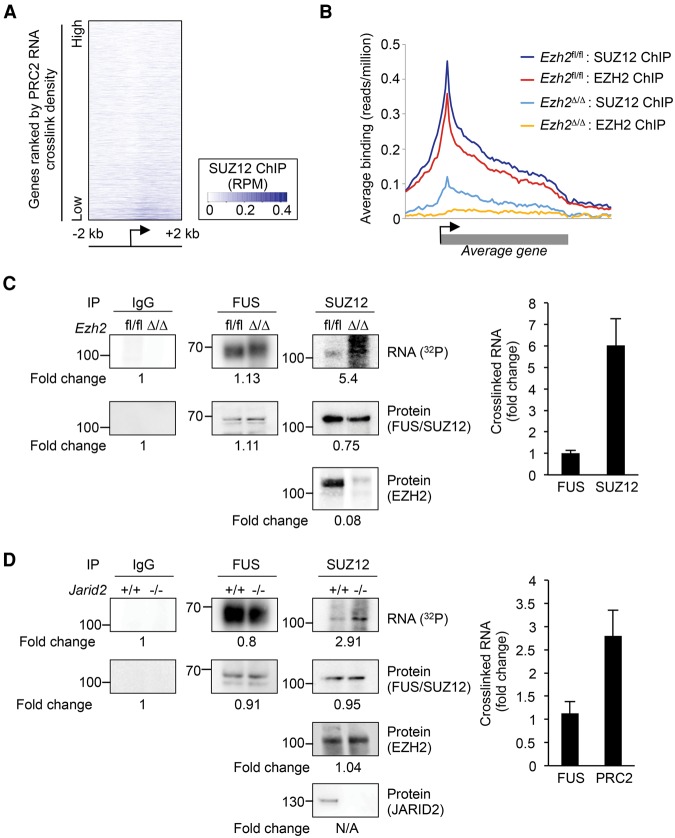
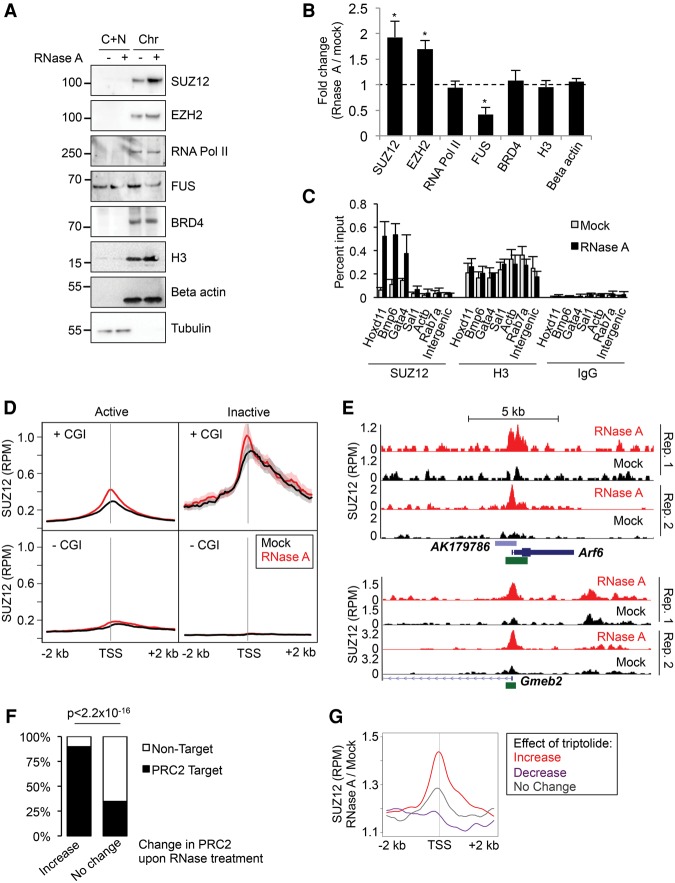
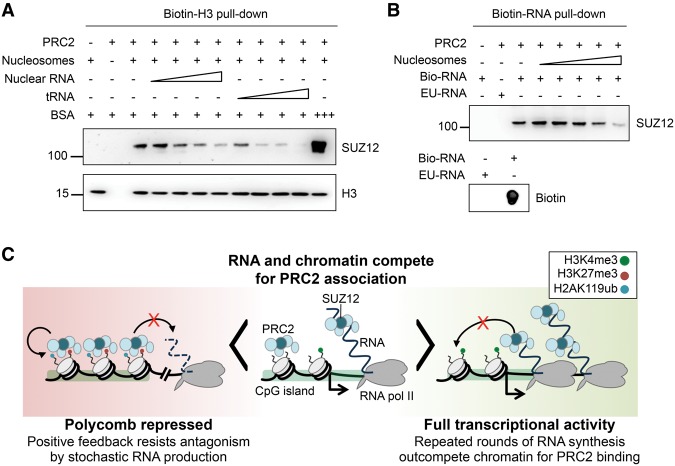
Polycomb repressive complex 2 (PRC2) modifies chromatin to maintain genes in a repressed state during development. PRC2 is primarily associated with CpG islands at repressed genes and also possesses RNA binding activity. However, the RNAs that bind PRC2 in cells, the subunits that mediate these interactions, and the role of RNA in PRC2 recruitment to chromatin all remain unclear. By performing iCLIP for PRC2 in comparison with other RNA binding proteins, we show here that PRC2 binds nascent RNA at essentially all active genes. Although interacting with RNA promiscuously, PRC2 binding is enriched at specific locations within RNAs, primarily exon-intron boundaries and the 3' UTR. Deletion of other PRC2 subunits reveals that SUZ12 is sufficient to establish this RNA binding profile. Contrary to prevailing models, we also demonstrate that the interaction of PRC2 with RNA or chromatin is mutually antagonistic in cells and in vitro. RNA degradation in cells triggers PRC2 recruitment to CpG islands at active genes. Correspondingly, the release of PRC2 from chromatin in cells increases RNA binding. Consistent with this, RNA and nucleosomes compete for PRC2 binding in vitro. We propose that RNA prevents PRC2 recruitment to chromatin at active genes and that mutual antagonism between RNA and chromatin underlies the pattern of PRC2 chromatin association across the genome.


Figures

Figure 1.
Figure 1.
PRC2 has a characteristic RNA binding profile with enrichment at exon–intron boundaries and the 3′ UTR. (A) SDS-PAGE for RNPs enriched by CLIP for endogenous SUZ12 in the wild type (WT) and Suz12−/− ESCs. The autoradiogram is shown at the top; the corresponding SUZ12 and EZH2 immunoblots, below. CLIP was performed with and without UV crosslinking and T4-polynucleotide kinase (T4-PNK) and with increasing concentrations of RNase I (1, 2, 4, 10, and 20 U/mL). (B) Significant PRC2 RNA crosslink sites (FDR < 0.05) at Hnrnpa2b1. Significant crosslinks are also marked for FUS, HNRNPC, GFP, and IgG controls and for PRC2 in Suz12−/− cells. Counts of Watson and Crick strand crosslinks per base are shown by positive and negative integers, respectively. Nuclear and total RNA-seq read densities (reads per million [RPM]) are shown below. Scale is denoted by the bar above. (C) As B, except for Lamc1. (D) Percentage of significant crosslink sites or RNA-seq reads in different gene segments. The percentage of bases within each segment is shown for comparison. (E) Composite crosslink density profiles (crosslinks per million) across an average gene, divided into exons and introns and 1 kb of flanking sequence, with the first and last exons additionally divided into UTR and CDS. Total and nuclear RNA-seq read densities are shown for comparison. Segment length is arbitrary. (F, top) Cartoon showing the identification of reads which span exon–intron boundaries or exon–exon boundaries. (Bottom) Relative proportions of iCLIP or RNA-seq reads that span exon–intron (unspliced; blue) or exon–exon boundaries (spliced; red), as a percentage of all reads spanning a junction.
Figure 2.
Figure 2.
PRC2 interacts with nascent RNA at essentially all active genes. (A) The overlap between genes with significant PRC2, FUS, and HNRNPC RNA crosslinks. (B) Scatter plot showing gene length (kb) and nuclear RNA abundance (reads) for all genes (black), genes with significant PRC2 crosslinks identified by iCLIP (red), and genes previously reported to produce PRC2 binding ezRNAs (blue) (Kaneko et al. 2013). (C) Cumulative frequency distribution of PRC2 (red), FUS (blue), and HNRNPC (green) crosslinks (RPKM) and total and nuclear RNA-seq RPKM for lincRNA genes (top) and protein-coding genes (bottom). (D) Scatter plot of nuclear RNA abundance (RPKM) against PRC2 crosslink density (RPKM). Genes marked in red are significantly enriched for PRC2 crosslinks compared with nuclear RNA abundance (FDR < 0.05). (E) Scatter plots showing frequency of significant crosslinks (RPKM) for FUS (left) and HNRNPC (right) versus PRC2. Genes significantly enriched for PRC2 crosslinks compared with RNA (from D) are marked in red and are not enriched compared with FUS and HNRNPC. (F) Ratio of PRC2 significant crosslink density to FUS (left) or HNRNPC significant crosslink density (right) at genes ranked by their relative proportion of exonic sequence (percentage). The trends (Loess) are marked by red lines.
Figure 3.
Figure 3.
SUZ12 directly binds RNA independently of other PRC2 subunits. (A) PAR-CLIP for SUZ12 in Ezh2fl/fl (WT), Ezh2Δ/Δ, and Suz12−/− cells, with and without 4-sU. (B) CLIP for SUZ12 in Eed4 cKO cells before or after the addition of doxycycline to repress expression of MYC-EED4. An arrow marks the SUZ12 RNP. Immunoblots for SUZ12, EZH2, and MYC-EED are shown below. (C) CLIP for JARID2 with anti-Flag antibody in WT (JM8) and JARID2-Flag ESCs. RNase I was titrated at 1, 4, and 20 U/mL. An arrow marks an RNP of the expected molecular weight. (D) CLIP for SUZ12 and IgG in WT (JM8) or Jarid2−/− ESCs. JARID2 and SUZ12 immunoblots are shown below.
Figure 4.
Figure 4.
PRC2 RNA binding specificity is unchanged in the absence of EZH2 or JARID2. (A) Composite crosslink density profiles for PRC2 in Ezh2fl/fl, Ezh2Δ/Δ, Jarid2+/+, and Jarid2−/− cells. Details as for Figure 1E. (B) Significant PRC2 crosslinks at the gene Hnrnpa2b1 in Ezh2fl/fl, Ezh2Δ/Δ, Jarid2+/+, and Jarid2−/− cells. Total RNA reads in Ezh2fl/fl and Ezh2Δ/Δ cells are shown below. (C) Dendrogram showing the correlation between composite crosslink density profiles between different iCLIP experiments. (D) Scatter plot comparing the number of significant PRC2 crosslinks per gene between Ezh2fl/fl and Ezh2Δ/Δ cells. Overlaid is log2 fold-change in RNA abundance in Ezh2Δ/Δ cells compared with Ezh2fl/fl cells, with shades of red indicating an increase and yellow a decrease, as shown by the scale on the right. (E) Composite crosslink site density profile for SUZ12 in Ezh2Δ/Δ cells at the set of genes up-regulated in Ezh2Δ/Δ cells compared with Ezh2fl/fl cells (Supplemental Fig. S6D, red).
Figure 5.
Figure 5.
Release of PRC2 from chromatin increases binding to RNA. (A) Heat map showing SUZ12 chromatin binding (input subtracted reads/million, according to the scale on the right) 2 kb to either side of the TSS of CpG island–associated genes with significant PRC2 RNA crosslinks. Genes are ordered by PRC2 RNA crosslink density. (B) Average chromatin binding profiles (reads/million) of EZH2 and SUZ12 across gene bodies in Ezh2fl/fl and Ezh2Δ/Δ cells. (C, left) CLIP for IgG, FUS, and SUZ12 in Ezh2fl/fl and Ezh2Δ/Δ cells. The fold-change in the levels of each protein and crosslinked RNA are indicated below. (Right) Fold-change in RNA crosslinked to FUS and SUZ12 in biological replicate experiments (normalized to protein; mean and SD, n = 3). (D) CLIP for IgG, FUS, and SUZ12/EZH2 in Jarid2+/+ and Jarid2−/− cells. Details as for C.
Figure 6.
Figure 6.
Interaction of PRC2 with chromatin is increased upon RNA degradation. (A) Immunoblots of SUZ12, EZH2, RNA Pol II (POLR2A), FUS, BRD4, histone H3, beta-actin, and alpha-tubulin in cytoplasmic plus nucleoplasmic (C + N) and chromatin (Chr) fractions from mock- or RNase A–treated cells. (B) Ratio of the amount of protein present in the chromatin fraction between RNase A–treated and mock-treated cells (mean and SD, n = 3). (*) P < 0.05 (paired Student's t-test). (C) ChIP-qPCR for SUZ12, EZH2, and histone H3 in mock-treated and RNase A–treated cells (mean and SD, n = 3). (D) Average SUZ12 chromatin binding profiles around gene TSS in mock- (black) and RNase A–treated (red) ESCs (mean and SE). Genes are separated into active (nuclear and total RNA RPKM > 1) and inactive (RPKM = 0) and further divided by the presence or absence of a CpG island (CGI) at their TSS. Data are the average of duplicate experiments. (E) SUZ12 ChIP-seq read density (reads per million) at Arf6 (top) and Gmeb2 (bottom) following mock (black) or RNase A treatment (red) (two replicates). CpG islands are marked in green. (F) Percentage of genes that are occupied by PRC2 in differentiated cells (Yue et al. 2014). Genes are divided into those that gain PRC2 upon RNase A treatment and those that exhibit no change. (G) Average change in PRC2 binding upon RNase A treatment at genes at which PRC2 is gained (red), lost (purple), or unchanged (gray) upon inhibition of RNA Pol II with triptolide.
Figure 7.
Figure 7.
RNA and chromatin compete for PRC2 binding in vitro. (A) Pull-down of PRC2 (13 ng/µL, 49 nM) by biotinylated nucleosomes (21 ng/µL, 100 nM) in the absence and presence of purified nuclear RNA or tRNA (both titrated from 0.5–65 ng/µL). BSA at 330 ng/µL (5 µM) was used to control for nonspecific occlusion effects. (B, top) Pull-down of PRC2 (13 ng/µL, 49 nM) by 2.5 µg of biotinylated nascent RNA (bio-RNA) in the absence and presence of reconstituted nucleosomes (titrated from 0.024–2.4 µM). 5-Ethynyl uridinylated RNA (EU-RNA), the precursor in the biotinylation reaction, was used as control. (Bottom) Dot blot of input bio- and EU-RNA with streptavidin-HRP. (C) Our data support a model in which PRC2 can bind either to chromatin or to RNA in a mutually antagonistic fashion. At lowly expressed genes, there is active competition between chromatin and RNA for PRC2 binding (center). At highly active genes (right), repeated rounds of nascent RNA synthesis outcompete chromatin for PRC2 binding, protecting genes from inappropriate silencing. The loss of RNA upon gene repression allows PRC2 recruitment to chromatin (left). Positive feedback mediated by EED binding to H3K27me3, and between PRC1 and PRC2, allows for stable chromatin association that resists the loss of PRC2 to RNA caused by low level or stochastic transcriptional activation. This bistable state therefore buffers changes due to transcription noise and may ensure that only robust changes in transcriptional activity are propagated as changes in epigenetic state.

References

    1. Angel A, Song J, Dean C, Howard M. 2011. A Polycomb-based switch underlying quantitative epigenetic memory. Nature 476: 105–108. - PubMed
    1. Bartke T, Vermeulen M, Xhemalce B, Robson SC, Mann M, Kouzarides T. 2010. Nucleosome-interacting proteins regulated by DNA and histone methylation. Cell 143: 470–484. - PMC - PubMed
    1. Blackledge NP, Farcas AM, Kondo T, King HW, McGouran JF, Hanssen LL, Ito S, Cooper S, Kondo K, Koseki Y, et al. 2014. Variant PRC1 complex-dependent H2A ubiquitylation drives PRC2 recruitment and Polycomb domain formation. Cell 157: 1445–1459. - PMC - PubMed
    1. Brockdorff N. 2013. Noncoding RNA and Polycomb recruitment. RNA 19: 429–442. - PMC - PubMed
    1. Bulut-Karslioglu A, De La Rosa-Velazquez IA, Ramirez F, Barenboim M, Onishi-Seebacher M, Arand J, Galan C, Winter GE, Engist B, Gerle B, et al. 2014. Suv39h-dependent H3K9me3 marks intact retrotransposons and silences LINE elements in mouse embryonic stem cells. Mol Cell 55: 277–290. - PubMed

Publication types