. 2016 Jul;26(7):990-9.
doi: 10.1101/gr.200535.115. Epub 2016 May 3.

Basset: learning the regulatory code of the accessible genome with deep convolutional neural networks

Affiliations

Basset: learning the regulatory code of the accessible genome with deep convolutional neural networks

David R Kelley et al. Genome Res. 2016 Jul.

Abstract

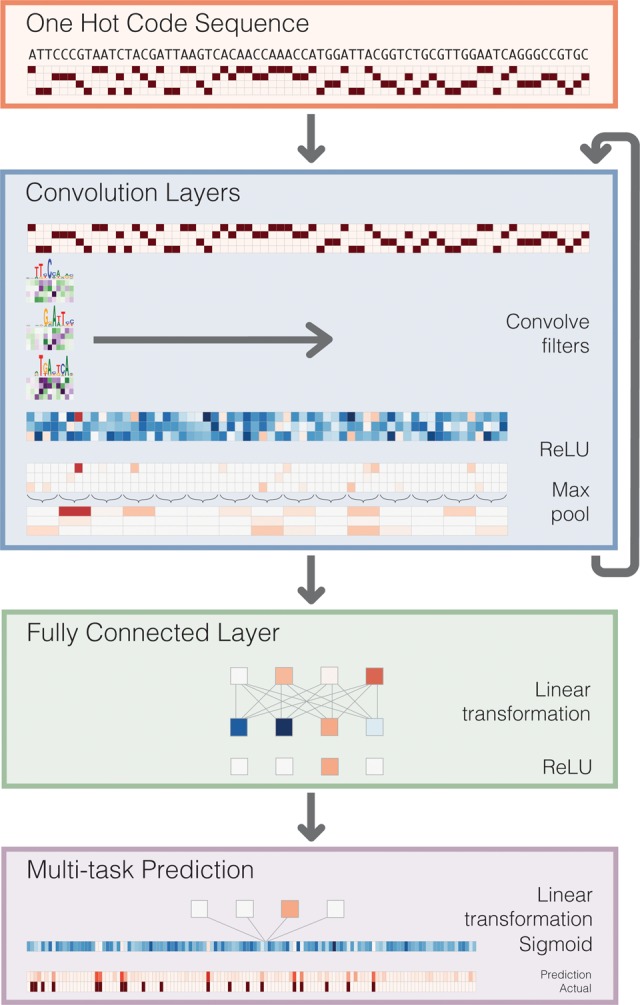
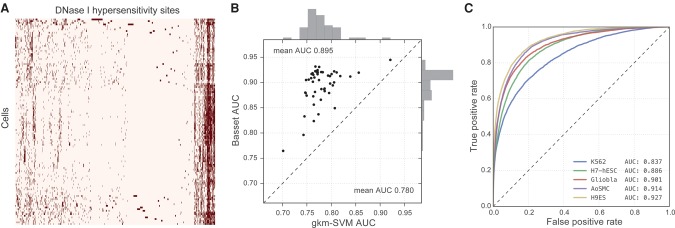
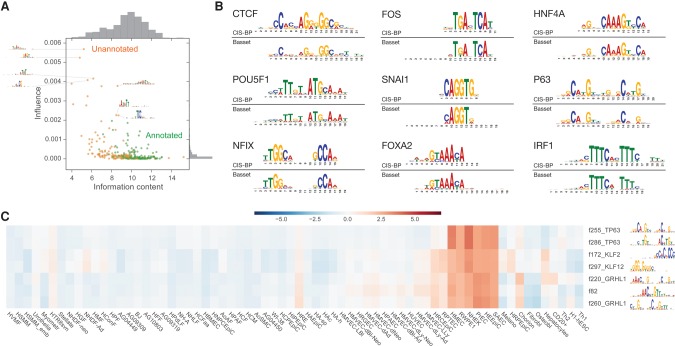
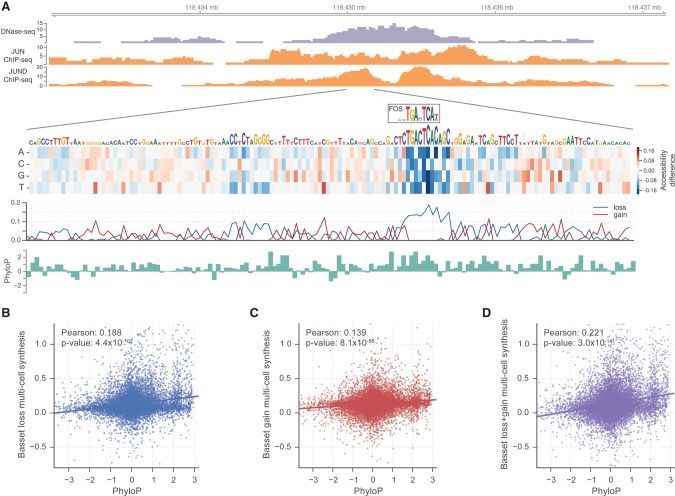
The complex language of eukaryotic gene expression remains incompletely understood. Despite the importance suggested by many noncoding variants statistically associated with human disease, nearly all such variants have unknown mechanisms. Here, we address this challenge using an approach based on a recent machine learning advance-deep convolutional neural networks (CNNs). We introduce the open source package Basset to apply CNNs to learn the functional activity of DNA sequences from genomics data. We trained Basset on a compendium of accessible genomic sites mapped in 164 cell types by DNase-seq, and demonstrate greater predictive accuracy than previous methods. Basset predictions for the change in accessibility between variant alleles were far greater for Genome-wide association study (GWAS) SNPs that are likely to be causal relative to nearby SNPs in linkage disequilibrium with them. With Basset, a researcher can perform a single sequencing assay in their cell type of interest and simultaneously learn that cell's chromatin accessibility code and annotate every mutation in the genome with its influence on present accessibility and latent potential for accessibility. Thus, Basset offers a powerful computational approach to annotate and interpret the noncoding genome.


Figures

Figure 1.
Figure 1.
Deep convolutional neural network (CNN) for DNA sequence analysis. Basset predicts the cell-specific functional activity (here DNase I hypersensitivity) of sequences. First, we convert the sequence to a “one hot code” representation, where each position has a four-element vector with one nucleotide's bit set to one. Convolution layers proceed by scanning weight matrices across the input matrix to produce an output matrix with a row for every convolution filter and a column for every position in the input (minus the width of the filter). We apply a rectified linear unit (ReLU) nonlinear transformation to the convolution output and pool by taking the maximum across a window of adjacent positions. The first convolution layer operates directly on the one hot coding of the input sequence, making the convolution filters akin to the common bioinformatics tool position weight matrices. Subsequent convolution layers consider the orientations and spatial distances between patterns recognized in the previous layer. Fully connected layers perform a linear transformation of the input vector and apply a ReLU. The final layer performs a linear transformation to a vector of 164 elements that represents the target cells. A sigmoid nonlinearity maps this vector to the range zero to one, where the elements serve as probability predictions of DNase I hypersensitivity, to be compared via a loss function to the true hypersensitivity vector.
Figure 2.
Figure 2.
Basset accurately predicts cell-specific DNA accessibility. (A) The heat map displays hypersensitivity of 2 million DNase I hypersensitive sites (DHSs) mapped across 164 cell types. We performed average linkage hierarchical clustering using Euclidean distance to both cells and sites. (B) The scatter plot displays AUC for 50 randomly selected cell types achieved by Basset and the state-of-the-art approach gkm-SVM, which uses support vector machines. (C) The ROC curves display the Basset false-positive rate versus true-positive rate for five cells, selected to represent the 0.05, 0.33, 0.50, 0.67, and 0.95 quantiles of the AUC distribution.
Figure 3.
Figure 3.
Basset initial convolutional layer discovers known and novel sequence motifs. (A) In the scatter plot, the x-axis describes the information content for the PWMs represented by the 300 first layer convolution filters (Methods). The y-axis describes an influence score, which we compute by setting all output from the filter to its mean (thus nullifying the filter) and taking the sum of squares of the vector of accessibility prediction changes over all cells. We colored filters by whether or not they could be annotated at a q-value threshold of 0.1 by the TomTom motif comparison tool to known TF motifs in the human CIS-BP database. (B) Overall, 45% of filters could be annotated, including the alignments shown here. (C) Clustering the filters by their influence on accessibility predictions in each cell type revealed this set matching TP63, GRHL1, and KLF factors, which are known to be involved in epithelial development.
Figure 4.
Figure 4.
In silico saturated mutagenesis for DNase I hypersensitivity. (A) We used Basset to predict the effect of every mutation on the accessibility of the region Chr 9: 118,434,976–118,435,175 in H1-hESCs. The heat map displays the change in predicted accessibility for mutated sequences. Each column corresponds to a position in the sequence. Each row represents mutation to the corresponding nucleotide. In the line plot below, loss scores measure the maximum decrease among all mutations from the true nucleotide. Gain scores measure the maximum increase. We drew nucleotides to be proportional to the loss score, beyond a minimum height. At this locus, the model highlights the TGASTCA motif of the AP-1 complex (shown as the CIS-BP database motif for FOS). ChIP-seq of JUN and JUND in H1-hESCs confirm binding of the complex. The bound motif displays high conservation according to PhyloP. (B) Genome-wide, loss scores had a strong relationship with PhyloP (see Methods). (C,D) Gain scores alone had a weaker relationship (C), but the combination of gain and loss scores achieved the strongest relationship (D).
Figure 5.
Figure 5.
SNP accessibility difference (SAD) scores enable genomic variant interpretation. (A) Basset assigned greater scores to likely causal GWAS SNPs (PICS probability >0.5) versus unlikely nearby SNPs (PICS probability <0.05) as determined by population fine mapping data. The bars measure the proportion of SNPs assigned a SAD profile mean across all cell types of more than 0.1. (B) We annotated rs4409785 among the highest SAD scores, in agreement with the PICS view of this haplotype block. Basset predicts the more common T allele to be completely dormant, but the region transforms with the C allele into a site deemed by Basset to have very high accessibility due to a CTCF binding site. (C) CTCF ChIP-seq in 88 unique cell types strongly supports the allele specificity of CTCF at this site. We plotted cells with more than three reads (summed across replicates) aligned to the site, and marked significant peak calls with asterisks. The 11 cells with significant peak calls all sequenced the C allele.
Figure 6.
Figure 6.
Basset leverages large-scale public data to inform additional data set learning. (A) The scatter plot shows AUC for 15 data sets achieved by the full model trained on all 164 cell types on the x-axis and AUC achieved by a procedure to simulate studying that data set alone on the y-axis. To study the data set alone, we pretrain a model on 149 cells (after removing these 15), seed training of the additional cell with that model's parameters, and perform a single training pass through the new data. This rapid procedure was effective for all but one data set (HRCEpiC, renal cortical epithelial cells), for which multitask training with the many other similar epithelial cells was beneficial. The AUC improvement for many cells suggests that our full model may benefit from increased capacity or decreased regularization. (B) The seeded training procedure is far faster on the GPU and allows for feasible CPU training.

References

    1. Alipanahi B, Delong A, Weirauch MT, Frey BJ. 2015. Predicting the sequence specificities of DNA- and RNA-binding proteins by deep learning. Nat Biotechnol 33: 831–838. - PubMed
    1. Arnold P, Schöler A, Pachkov M, Balwierz PJ, Jørgensen H, Stadler MB, van Nimwegen E, Schübeler D. 2013. Modeling of epigenome dynamics identifies transcription factors that mediate Polycomb targeting. Genome Res 23: 60–73. - PMC - PubMed
    1. Beer MA, Tavazoie S. 2004. Predicting gene expression from sequence. Cell 117: 185–198. - PubMed
    1. Bengio Y, Courville A, Vincent P. 2013. Representation learning: a review and new perspectives. IEEE Trans Pattern Anal Mach Intell 35: 1798–1828. - PubMed
    1. Benveniste D, Sonntag H-J, Sanguinetti G, Sproul D. 2014. Transcription factor binding predicts histone modifications in human cell lines. Proc Natl Acad Sci 111: 13367–13372. - PMC - PubMed

Publication types