. 2016 May 1;76(9):2778-90.
doi: 10.1158/0008-5472.CAN-16-0186.

The BRCA1-Δ11q Alternative Splice Isoform Bypasses Germline Mutations and Promotes Therapeutic Resistance to PARP Inhibition and Cisplatin

Affiliations

The BRCA1-Δ11q Alternative Splice Isoform Bypasses Germline Mutations and Promotes Therapeutic Resistance to PARP Inhibition and Cisplatin

Yifan Wang et al. Cancer Res. .

Abstract

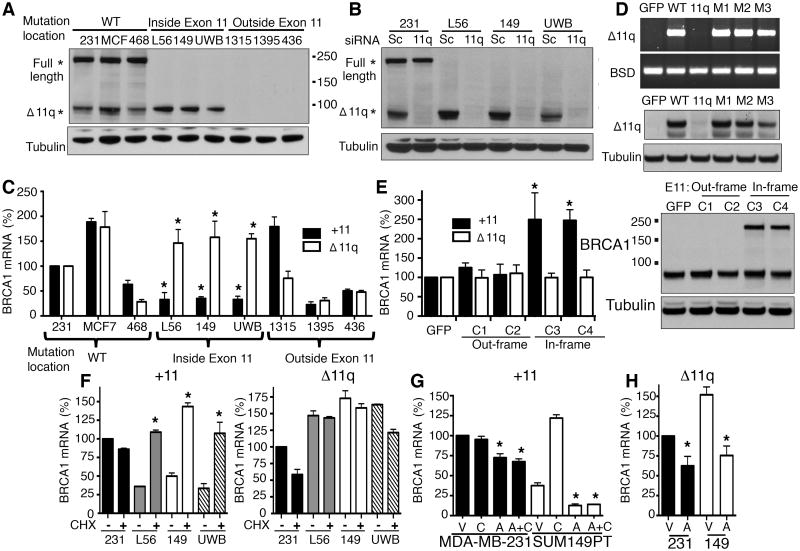
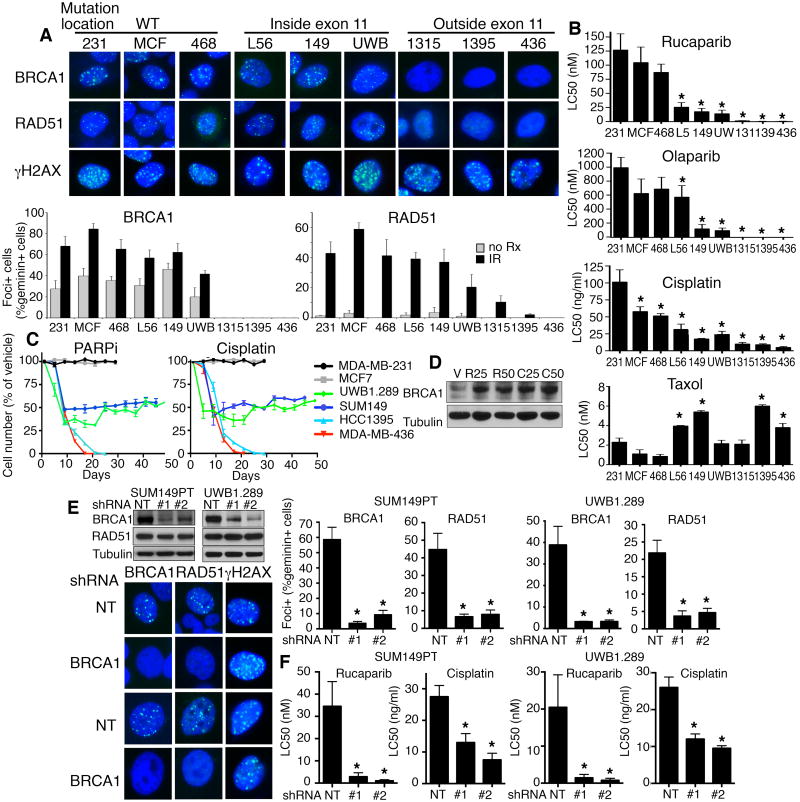
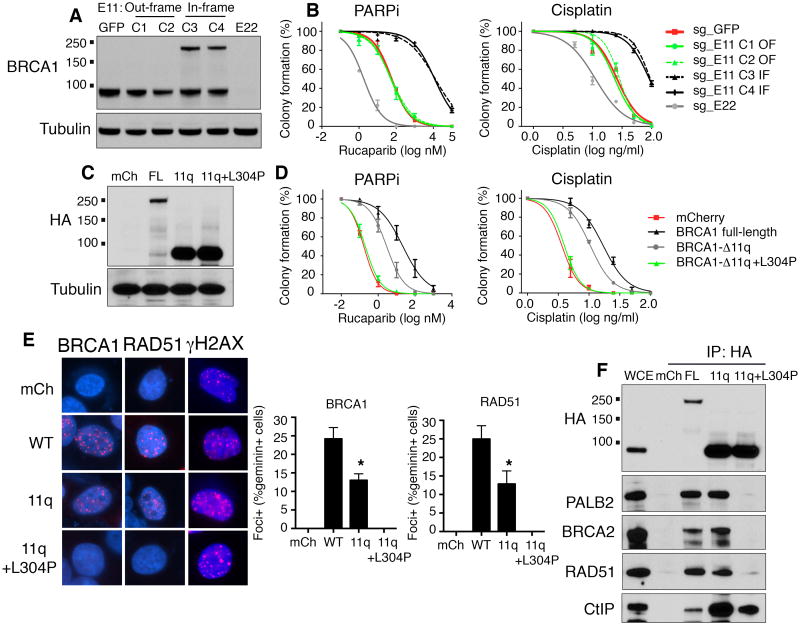
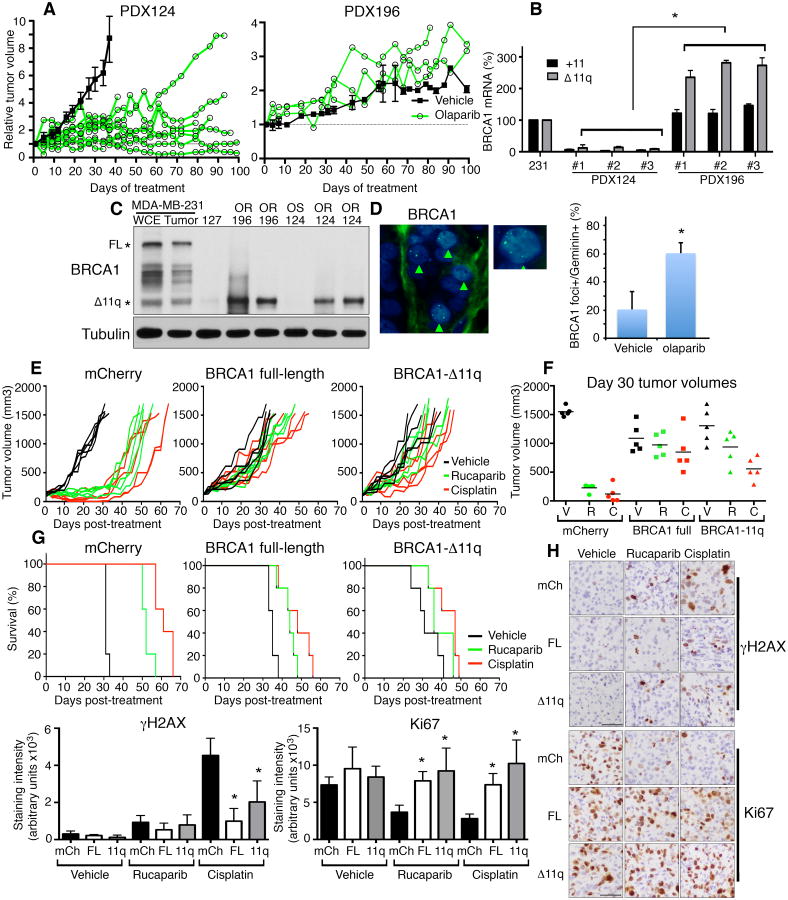
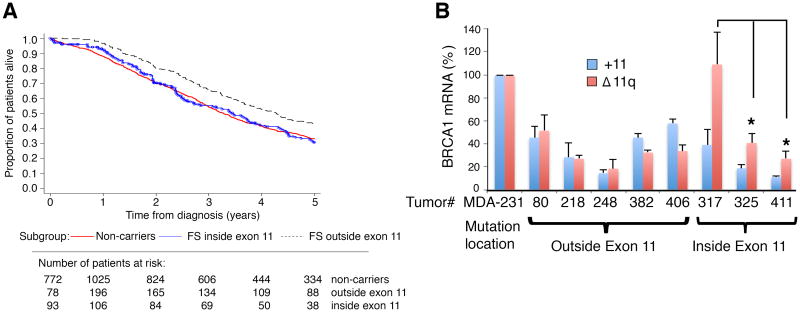
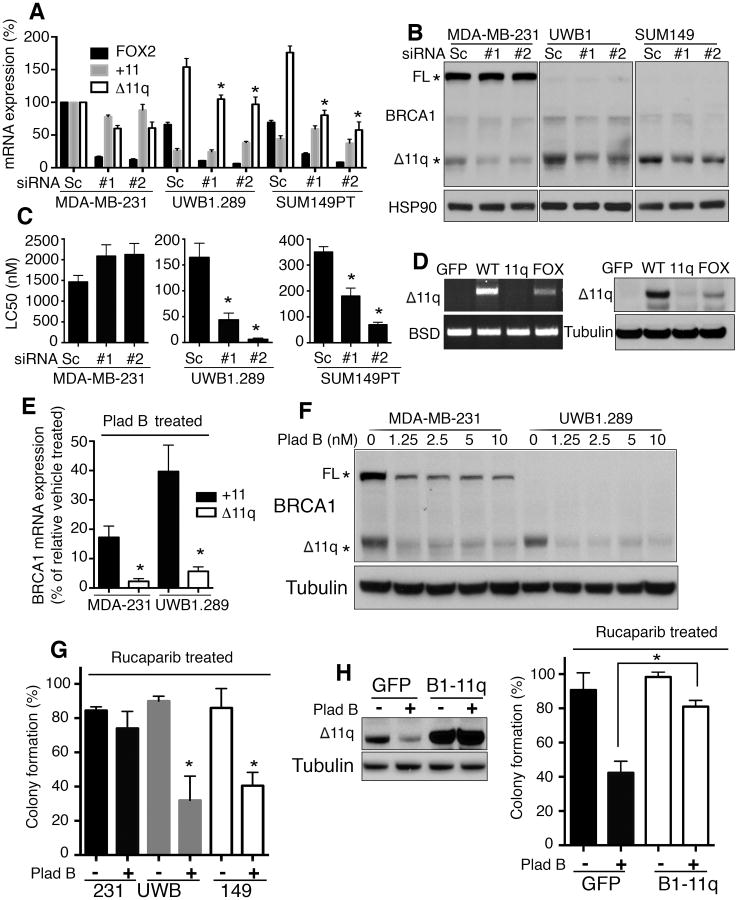
Breast and ovarian cancer patients harboring BRCA1/2 germline mutations have clinically benefitted from therapy with PARP inhibitor (PARPi) or platinum compounds, but acquired resistance limits clinical impact. In this study, we investigated the impact of mutations on BRCA1 isoform expression and therapeutic response. Cancer cell lines and tumors harboring mutations in exon 11 of BRCA1 express a BRCA1-Δ11q splice variant lacking the majority of exon 11. The introduction of frameshift mutations to exon 11 resulted in nonsense-mediated mRNA decay of full-length, but not the BRCA1-Δ11q isoform. CRISPR/Cas9 gene editing as well as overexpression experiments revealed that the BRCA1-Δ11q protein was capable of promoting partial PARPi and cisplatin resistance relative to full-length BRCA1, both in vitro and in vivo Furthermore, spliceosome inhibitors reduced BRCA1-Δ11q levels and sensitized cells carrying exon 11 mutations to PARPi treatment. Taken together, our results provided evidence that cancer cells employ a strategy to remove deleterious germline BRCA1 mutations through alternative mRNA splicing, giving rise to isoforms that retain residual activity and contribute to therapeutic resistance. Cancer Res; 76(9); 2778-90. ©2016 AACR.


Conflict of interest statement

Conflicts of interest: G.I.S. has served as an investigator in trials of rucaparib and Dana-Farber Cancer Institute has received funding from Clovis Oncology for the conduct of these trials. G.I.S. has also participated in advisory boards for Clovis. The remaining authors declare no conflicts of interest.

Figures

Figure 1
Figure 1. BRCA1 exon 11 mutant cell lines express BRCA1-Δ11q
(A) Cell lines were analyzed for BRCA1 and tubulin levels by Western blot. *Predicted BRCA1 locations, molecular weights are indicated. (B) Cells were treated with scrambled (Sc) or BRCA1-Δ11q (11q) siRNA and analyzed by Western blot. (C) Exon 11 containing (+11) BRCA1 transcripts and the BRCA1-Δ11q (Δ11q) isoform were detected using qRT-PCR. Values were normalized to a HKG, expressed as a percentage of MDA-MB-231 cells. (D) 293T cells were transfected with either GFP-control or BRCA1-minigene reporter constructs that were WT or carrying mutations that disrupted the cryptic 11q splice site (11q), or with frameshift mutations (M1:2288delT; M2:2529C>T; M3:3960C>T). BRCA1-Δ11q-reporter mRNA and protein expression was measured by RT-PCR (above) and Western blot (below), see Supplementary Fig. S3. (E) CRISPR/Cas9 targeting the mutation-containing region of exon 11 (sg_exon11) generated SUM149PT clones (C) 1-4, see Supplementary Fig. S4. +11 and Δ11q mRNA was measured using qRT-PCR (left), values were normalized to a HKG and expressed as a percentage of sg_GFP control cells. BRCA1 protein was detected by Western blot (right). (F) The indicated cell lines were treated with vehicle or 10 μg/ml CHX for 5 hours followed by assessment of +11 (left) and Δ11q (right) levels by qRT-PCR. (G) Cells were treated with either vehicle (V), 10 μg/ml CHX (C), 5 μg/ml ACT (A) or A and C simultaneously for 5 hours and assessed for +11 expression by qRT-PCR. (H) Cells were treated with either vehicle (V), or 5 μg/ml ACT (A) for 5-hours and assessed for Δ11q expression by qRT-PCR. *P < 0.05.
Figure 2
Figure 2. Exon 11 mutant cells are less sensitive to PARPi and cisplatin treatment
(A) Cells were untreated (no Rx) or treated with IR (10 Gy) and subject to immunofluorescence to detect BRCA1, RAD51 and γ-H2AX foci, representative images of IR treated cells. Mean ± S.E.M foci-positive cells are expressed as a percentage of total geminin positive cells. (B) Cell lines were treated with rucaparib, olaparib, cisplatin or taxol and colony formation assessed; graphs represent three independent experiments, mean ± S.E.M LC50 values; see Supplementary Table S2 for fold changes and P values. (C) Cells were maintained in the presence of vehicle, 100 nM rucaparib (left) or 20 ng/ml cisplatin (right) and counted every 4 days. Cell line growth was expressed as a percentage of vehicle treated cell numbers counted on the same day. Mean ± S.E.M from three technical replicates. (D) UWB1.289 vehicle, rucaparib (R) and cisplatin (C) treated cell lysates were collected at days 25 and 50 for Western blot analysis. (E) Assessment of BRCA1, RAD51 and γ-H2AX foci by immunofluorescence as for (A). Western blot (above) shows BRCA1-Δ11q was depleted using 2 individual BRCA1 targeting shRNAs. Representative images (below) of IR treated cells and Mean ± S.E.M foci-positive cells are expressed as a percentage of total geminin positive cells (right). (F) Cells described in (E) were treated with rucaparib or cisplatin and colony formation assessed; three independent experiments, mean ± S.E.M LC50 concentrations are shown, see Supplementary Table S2. *P < 0.05.
Figure 3
Figure 3. BRCA1-Δ11q provides partial resistance to therapy in vitro
(A) CRISPR/Cas9 gene targeting the SUM149PT BRCA1 mutation-containing region of exon 11 (sg_exon11) did not affect the reading frame (OF) in clones 1, 2, or restored the reading frame (IF) in clones 3, 4. Targeting of exon 22 (sg_exon22) resulted in frameshift mutations and loss of BRCA1 expression. Cells treated with sg_GFP were used as a control. BRCA1 protein was detected by Western blot. See Supplementary Fig. S4 for more details. (B) Cells described in (A) were treated with rucaparib or cisplatin and colony formation assessed. (C) MDA-MB-436 cells expressing mCherry, BRCA1-full-length, BRCA1-Δ11q or BRCA1-Δ11q+L304P were assessed for BRCA1 protein expression by Western blot. (D) Cells described in (C) were treated with rucaparib or cisplatin and colony formation assessed. (E) Cells described in (C) were treated with IR (10 Gy) and subject to immunofluorescence to detect BRCA1, RAD51 and γ-H2AX foci, as well as geminin and DAPI staining, representative images of IR treated cells. Double geminin and BRCA1 or RAD51 positive cells were counted and expressed as a percentage of total geminin positive cells, bars show mean ± S.E.M. geminin+BRCA1 or RAD51 foci-positive cells from three independent experiments. (F) Cells described in (C) were subject to immunoprecipitation using an anti-HA antibody and Western blotting with the indicated antibodies. *P < 0.05.
Figure 4
Figure 4. BRCA1-Δ11q promotes resistance in vivo
(A) PDX124 (n ≥ 8 mice) (left) and PDX196 (n ≥ 3 mice) (right) tumors were treated with vehicle (black lines) or olaparib (green lines) and tumor volume measured. (B) PDX tumors were harvested from three individual untreated mice and assessed for +11 and Δ11q expression by qRT-PCR. Values were normalized to the POL2RF HKG control and expressed as a percentage of the values calculated for MDA-MB-231 cells. (C) MDA-MB-231 cells were prepared for whole cell extract (WCE) as well as tumor xenografts and used as positive controls, and compared to PDX127 (BRCA1185delAG mutant control, n = 1), PDX196 (n = 2), PDX124 OS (growth inhibition with olaparib, n = 1) and OR (growth slowed with olaparib, n = 2) tumors for Western blotting. (D) Mice harboring PDX196 tumors were treated with vehicle or olaparib and tumors assessed for BRCA1 foci formation as well as geminin staining, representative images (left) and quantification of BRCA1 mean ± S.E.M. foci geminin-positive cells. (E) MDA-MB-436 tumor xenografts expressing mCherry, BRCA1 wild-type and BRCA1-Δ11q were treated with vehicle (black lines), rucaparib (green lines) or cisplatin (red lines) and tumor growth measured, lines represent individual tumors and mice (n = 5). (F) Individual tumor volumes at day 30 are shown. (G) Kaplan-Meier survival analyses for mice described in (E). (H) Mice were treated as in (E) for 4 days, tumors were assessed for γ-H2AX and Ki67 staining by IHC. Representative images, scale bars show 50 μM. Mean ± S.E.M quantification of staining intensities. *P < 0.05.
Figure 5
Figure 5. BRCA1 exon 11 mutations and patient survival
(A) Kaplan-Meier estimates of cumulative survival according to BRCA1 mutation group of serous ovarian cancer patients (see Supplementary Tables S3 and S4). (B) Primary breast and ovarian cancer patient tumors (unrelated to studies described in (A) were subject to qRT-PCR analysis for +11 and Δ11q expression. Values were normalized to a HKG control and expressed as a percentage of the values calculated for MDA-MB-231 cells. *P < 0.05.
Figure 6
Figure 6. Splicing inhibition sensitizes exon 11 mutant cells to PARPi
(A) MDA-MB-231, UWB1.289 and SUM149PT cells were transfected with scrambled (Sc) or FOX2#1 and FOX2#2 siRNA and FOX2, POLR2F, +11 and Δ11q BRCA1 isoform mRNA levels measured by qRT-PCR. Values were normalized to POLR2F HKG expression and expressed as a percentage of MDA-MB-231 cells. (B) Cells treated as in (A) were subject to Western blotting. (C) Cells treated as in (A) were subject to 3 day rucaparib and cisplatin exposure and reseeded for colony formation. Mean±S.E.M. LC50 values are shown. (D) 293T cells were transfected with BRCA1 minigene reporter constructs as in Fig. 1D and Supplementary Fig. S3, with FOX2 binding sites mutated (FOX). BRCA1-Δ11q-reporter construct mRNA and protein expression was measured by RT-PCR (left) and Western blot (right), respectively. (E) MDA-MB-231 and UWB1.289 cells incubated with Pl-B (10 nM) and mRNA levels measured by qRT-PCR. Values were expressed as a percentage of vehicle treated MDA-MB-231 cells or UWB1.289 cells. (F) Cells were treated with increasing concentrations of Pl-B and subject to Western blotting. (G) Cells were treated with vehicle (-) or Pl-B (+) (1.25 nM) and either vehicle or rucaparib (100 nM) for 72 hours and reseeded for colony formation assay; mean ± S.E.M. colony formation of rucaparib treated cells calculated as a percentage of vehicle treated cells. (H) SUM149PT cells engineered to ectopically express GFP or BRCA1-Δ11q were treated as in (G) and assessed for colony formation. Western blot (left) and mean±S.E.M. colony formation of rucaparib treated cells, calculated as a percentage of vehicle treated cells (right). *P < 0.05.

References

    1. Szabo CI, King MC. Inherited breast and ovarian cancer. Hum Mol Genet. 1995;4 Spec No:1811–1817. - PubMed
    1. Friedman LS, Ostermeyer EA, Szabo CI, Dowd P, Lynch ED, Rowell SE, King MC. Confirmation of BRCA1 by analysis of germline mutations linked to breast and ovarian cancer in ten families. Nat Genet. 1994;8:399–404. - PubMed
    1. Perrin-Vidoz L, Sinilnikova OM, Stoppa-Lyonnet D, Lenoir GM, Mazoyer S. The nonsense-mediated mRNA decay pathway triggers degradation of most BRCA1 mRNAs bearing premature termination codons. Hum Mol Genet. 2002;11:2805–2814. - PubMed
    1. Moynahan ME, Cui TY, Jasin M. Homology-directed dna repair, mitomycin-c resistance, and chromosome stability is restored with correction of a Brca1 mutation. Cancer Res. 2001;61:4842–4850. - PubMed
    1. Scully R, Chen J, Ochs RL, Keegan K, Hoekstra M, Feunteun J, Livingston DM. Dynamic changes of BRCA1 subnuclear location and phosphorylation state are initiated by DNA damage. Cell. 1997;90:425–435. - PubMed

Publication types