. 2016 May 20:7:11636.
doi: 10.1038/ncomms11636.

Live single-cell laser tag

Affiliations

Live single-cell laser tag

Loïc Binan et al. Nat Commun. .

Abstract

The ability to conduct image-based, non-invasive cell tagging, independent of genetic engineering, is key to cell biology applications. Here we introduce cell labelling via photobleaching (CLaP), a method that enables instant, specific tagging of individual cells based on a wide array of criteria such as shape, behaviour or positional information. CLaP uses laser illumination to crosslink biotin onto the plasma membrane, coupled with streptavidin conjugates to label individual cells for genomic, cell-tracking, flow cytometry or ultra-microscopy applications. We show that the incorporated mark is stable, non-toxic, retained for several days, and transferred by cell division but not to adjacent cells in culture. To demonstrate the potential of CLaP for genomic applications, we combine CLaP with microfluidics-based single-cell capture followed by transcriptome-wide next-generation sequencing. Finally, we show that CLaP can also be exploited for inducing transient cell adhesion to substrates for microengineering cultures with spatially patterned cell types.


Figures

Figure 1
Figure 1. Cell labelling.
(a) Outline of the method. Cells are incubated with B4F, a small molecule that can easily reach the cell membrane, including the space between the glass surface and the cell. A laser beam photobleaches and crosslinks fluorescein-conjugated biotin. After rinsing, only illuminated cells retain biotin molecules on their plasma membrane and are revealed with fluorescent streptavidin. Biotin molecules attached to the plasma membrane freely diffuse along the lipid bilayer to yield a rather uniform distribution of fluorophores throughout the cell. (b) Examples of labelled cells. Low-magnification image of confluent MDCK cells labelled with Alexa-647-Streptavidin (magenta) overlaid on the bright-field image. Scale bar, 200 μm. (c) Average confocal projection of a tagged single MDCK cell. The bright circle observed inside the cell boundaries corresponds to streptavidin bound to the glass, marking the region scanned by the laser. Scale bar, 20 μm. Green corresponds to Wheat Germ Agglutinin-Alexa-488, magenta corresponds to Alexa-647-Streptavidin. (d) Confocal image and X-Z and Y-Z projections at day 0 illustrating membrane fluorescence distribution. Scale bar, 20 μm. (e) Two-colour CLaP obtained by repeating the procedure sequentially and using ARPE-19 cells stained with Alexa647-Streptavidin in magenta, Alexa555-Streptavidin in green and WGA-Alexa350 in grey. Scale bar, 10 μm. (f) Single labelled cell electron microcopy image, where HRP-Streptavidin was revealed with DAB, mostly concentrated in filopodia. Scale bar, 2 μm. Additional images can be found in Supplementary Fig 1. (g) Fluorescent puncta become visible one day after CLaP and proliferating cells can be tracked for up to at least 5 days. Scale bar, 20 μm. Magenta: CLaP-labelled cells, Alexa-647-Streptavidin. Green: non-tagged cells, Wheat Germ Agglutinin-Alexa-488. DAB, 3–3´diaminobenzidine tetrahydrochloride .
Figure 2
Figure 2. CLaP-labelled cell viability and proliferation.
(a) Epifluorescence images of CLaP-labelled cells. (left, magenta) Fluorescent streptavidin channel. (middle, blue) Propidium iodide, indicating dead cells. (right, green) Calcein, indicating viable cells. Scale bar, 300 μm. (b) Images were segmented to assess the fraction of dead cells inside and outside the illuminated region using the PI images. The mean Calcein-AM intensity was computed within tagged and non-tagged cells on the segmented images and the ratio between these values was used for quantification. (c) Cell viability was quantified at four different time points using both stains, inside and outside the illuminated regions. No significant difference was observed within illuminated (inside) and non-illuminated (outside) cells. The complete series of images used for this quantification can be found in Supplementary Fig. 12. (d) Isolated MDCK cells were tagged with CLaP using streptavidin-Alexa Fluor 647, and imaged immediately (top). After 3 days in culture, cells were fixed, stained with DAPI, and imaged (bottom). Single cells proliferated to 28 cells in average with s.d.=5.3. Scale bar, 50 μm. (e) As a control, non-tagged MDCK cells (top) were kept in culture for 3 days, fixed and stained with DAPI. Cells proliferated to 28.5 cells in average with s.d.=6.2. Scale bar, 50 μm.
Figure 3
Figure 3. Sorting of single CLaP-labelled cells.
(a) FACS identification of CLaP-labelled cells. After gating on live singlet cells to distinguish laser-tagged cells, the scatter plot shows two populations of cells separated in the fluorescent streptavidin channel, with colour automatically assigned using a hierarchical clustering algorithm (code available as Supplementary Software). Autofluorescence was used to spread the cells in the vertical axis in order to visualize individual cells. (b) MDCK (dog) cells were tagged by CLaP in a co-culture experiment, where ∼5% of all cells were targeted. A mix of cells were then individually captured on a Fluidigm C1 chip and visualized. Positive Alexa-647 CLaP tagged cell (magenta) and negative non-tagged cell (green) are shown. (c) PCR amplification confirms species of origin of each tagged cell, isolated with the C1 platform. Non-tagged cells, also isolated with C1, consist, as expected, of a mixture of dog and mouse cells. Rightmost lane corresponds to DNA from a bulk extraction on the rest of the sample. The complete gel and molecular markers are shown in Supplementary Fig. 7.
Figure 4
Figure 4. Single-cell CLaP-labelled RNA transcriptome analysis.
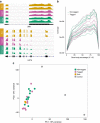
(a) Example of RNA-Seq data obtained for one highly expressed gene (UBB) and one RPE marker (KRT8) from bulk (yellow), tagged single cells (orange) and non-tagged single cells (green). All cells are shown in Supplementary Fig. 8. (b) Coverage uniformity over gene body. Using RSeqC, all transcripts were scaled to 100 nt and the number of reads covering each nucleotide position was computed. The slight 3′ bias, reported for SMARTer Ultra Low RNA kit, is expected. Magenta: CLaP tagged cells. Green: non-tagged cells. (c) Global effects of CLaP on cells were evaluated by unsupervised clustering of samples based on expression profiles, which consistently groups together tagged and untagged cells. Negative controls were derived from empty wells (no cells captured), to account for potential contamination, cell debris and other factors and an empty well containing RNA spike-in mix only. Different conditions for the clustering, including subsampling genes, bootstrapping or excluding control samples were assessed, with consistent results (Supplementary Figs 10 and 11).
Figure 5
Figure 5. Induced transient cell adhesion.
(a) B4F is a small molecule that can easily reach the space between the glass surface and the cell membrane. Reactive species induced by photobleaching B4F create transient adhesions between the cell basal membranes and the substrate. (b) Bright-field, contrast-enhanced image of a miniature world map created using ARPE-19 cells. Scale bar, 400 μm. (c). Spatially segregated U2OS cells expressing GFP (green) and bright-field contrast-enhanced ARPE-19 cells (magenta). Scale bar, 200 μm. (d) Cell proliferation after being transiently adhered to the substrate is demonstrated by daily bright-field illumination images. Image contrast was enhanced using the method described in the methods. Scale bar, 250 μm.

References

    1. Wang M., Orwar O., Olofsson J. & Weber S. G. Single-cell electroporation. Anal. Bioanal. Chem. 397, 3235–3248 (2010). - PubMed
    1. Teissie J., Golzio M. & Rols M. P. Mechanisms of cell membrane electropermeabilization: a minireview of our present (lack of?) knowledge. Biochim. Biophys. Acta 1724, 270–280 (2005). - PubMed
    1. Zhang Y. & Yu L. C. Single-cell microinjection technology in cell biology. Bioessays 30, 606–610 (2008). - PubMed
    1. Tsulaia T. V. et al. Glass needle-mediated microinjection of macromolecules and transgenes into primary human mesenchymal stem cells. J. Biomed. Sci. 10, 328–336 (2003). - PubMed
    1. Espina V. et al. Laser-capture microdissection. Nat. Protoc. 1, 586–603 (2006). - PubMed

Publication types