. 2016 May 20:5:e13065.
doi: 10.7554/eLife.13065.

Spatial organization shapes the turnover of a bacterial transcriptome

Affiliations

Spatial organization shapes the turnover of a bacterial transcriptome

Jeffrey R Moffitt et al. Elife. .

Abstract

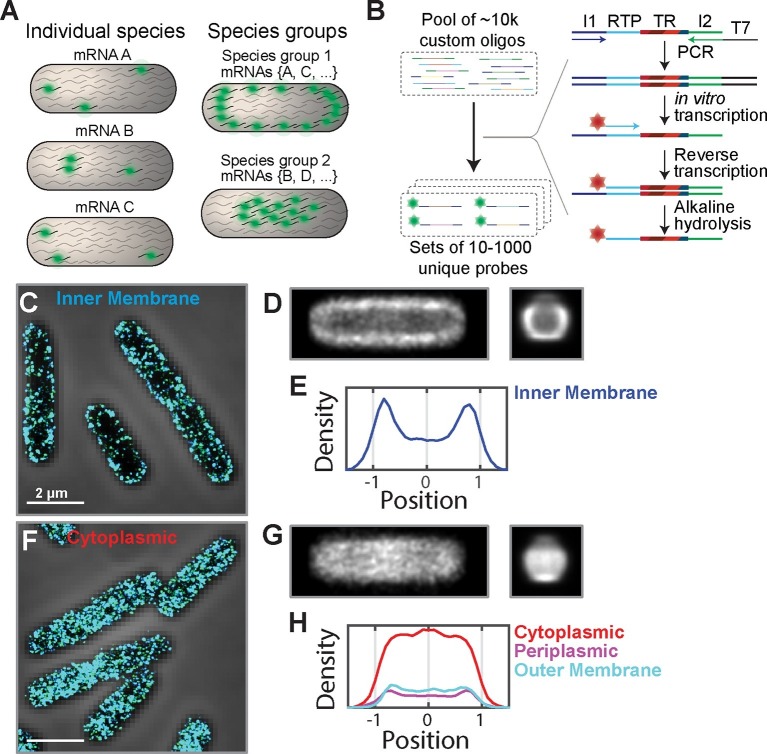
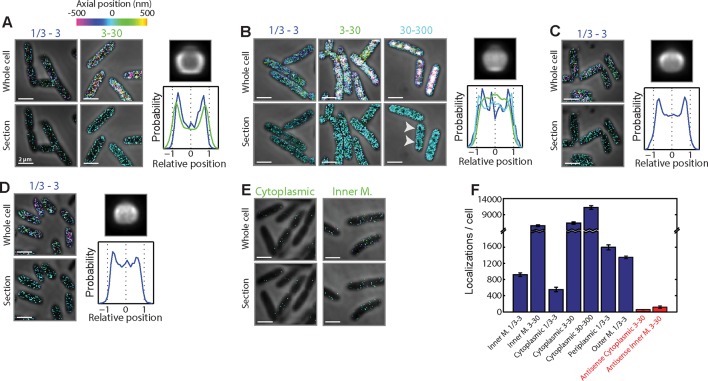
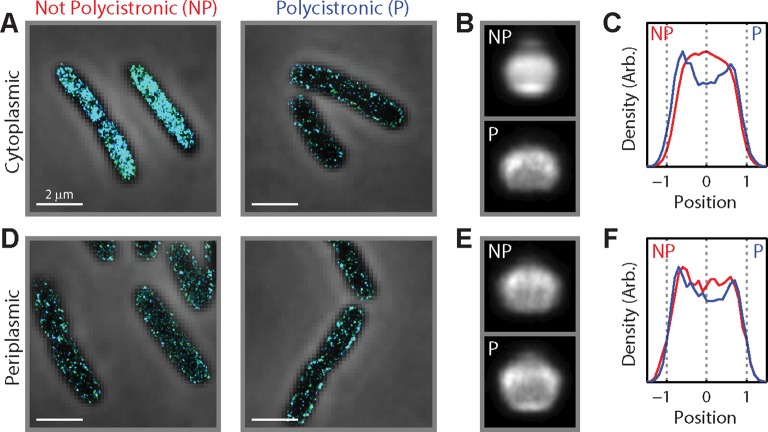
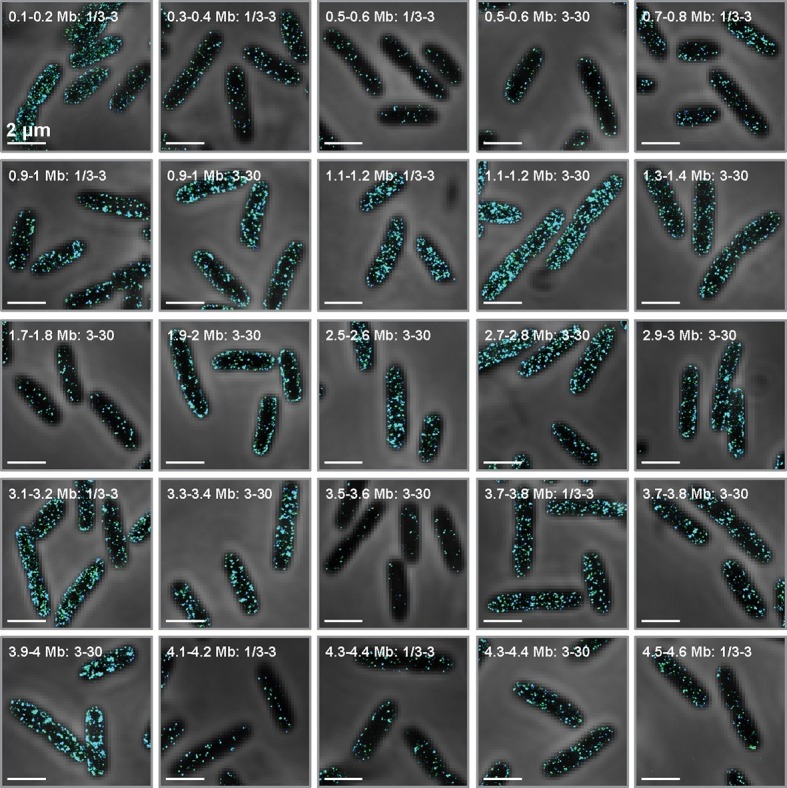
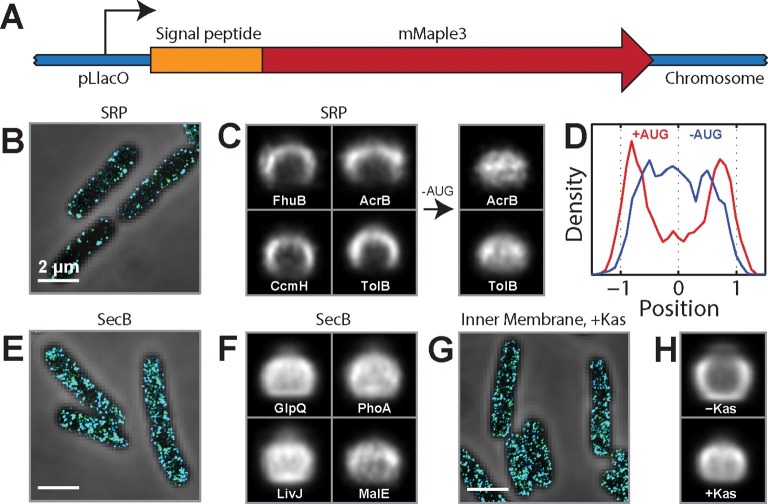
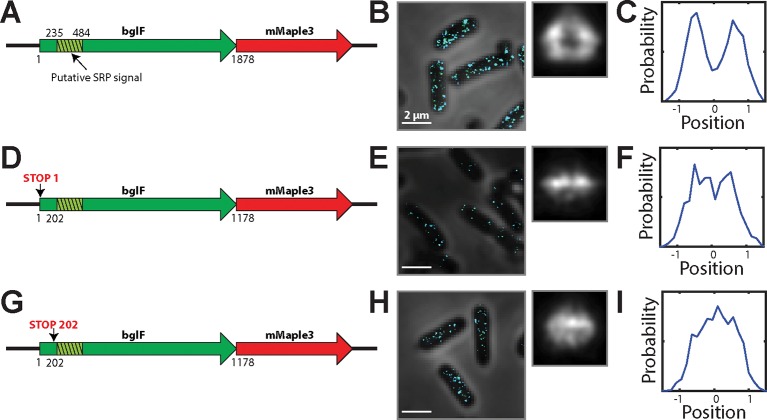
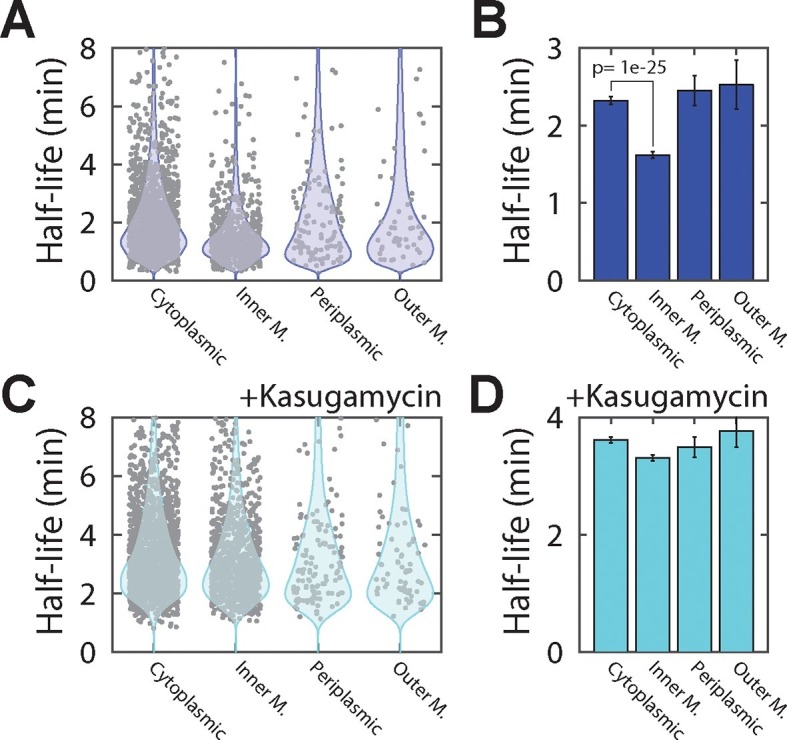
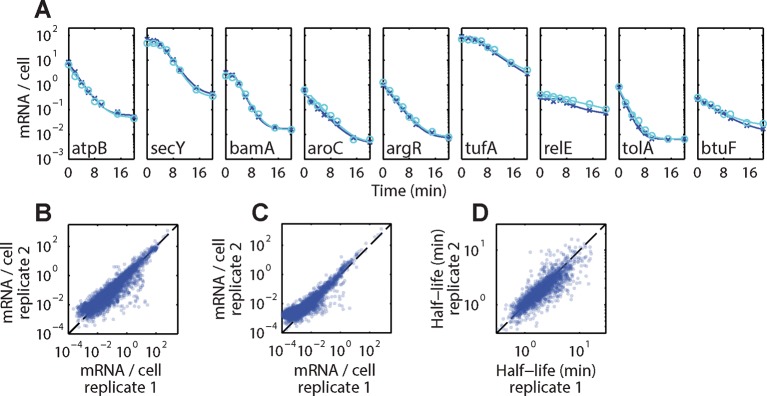
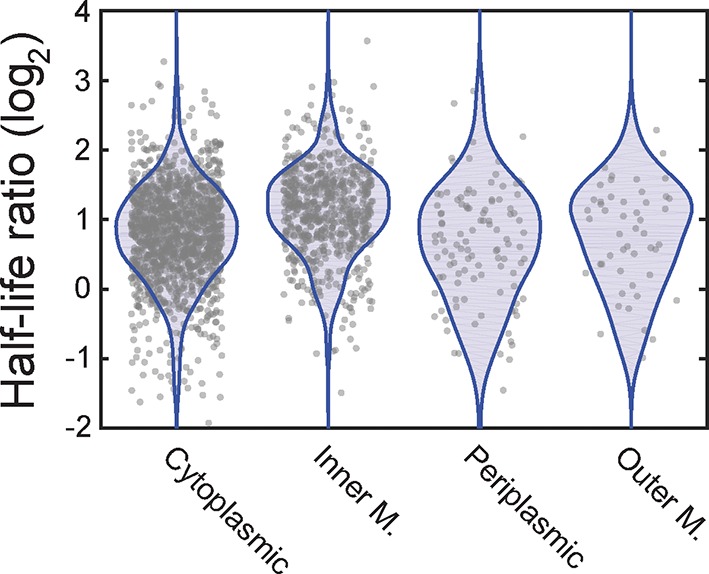
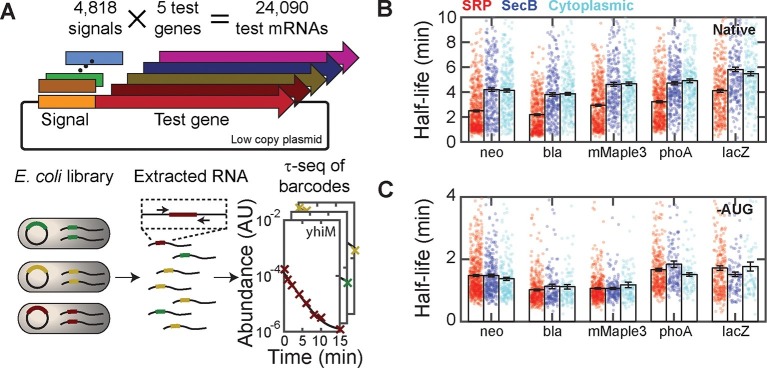
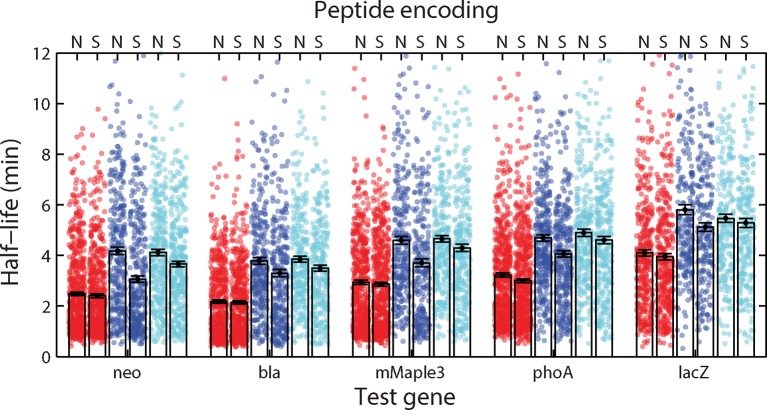
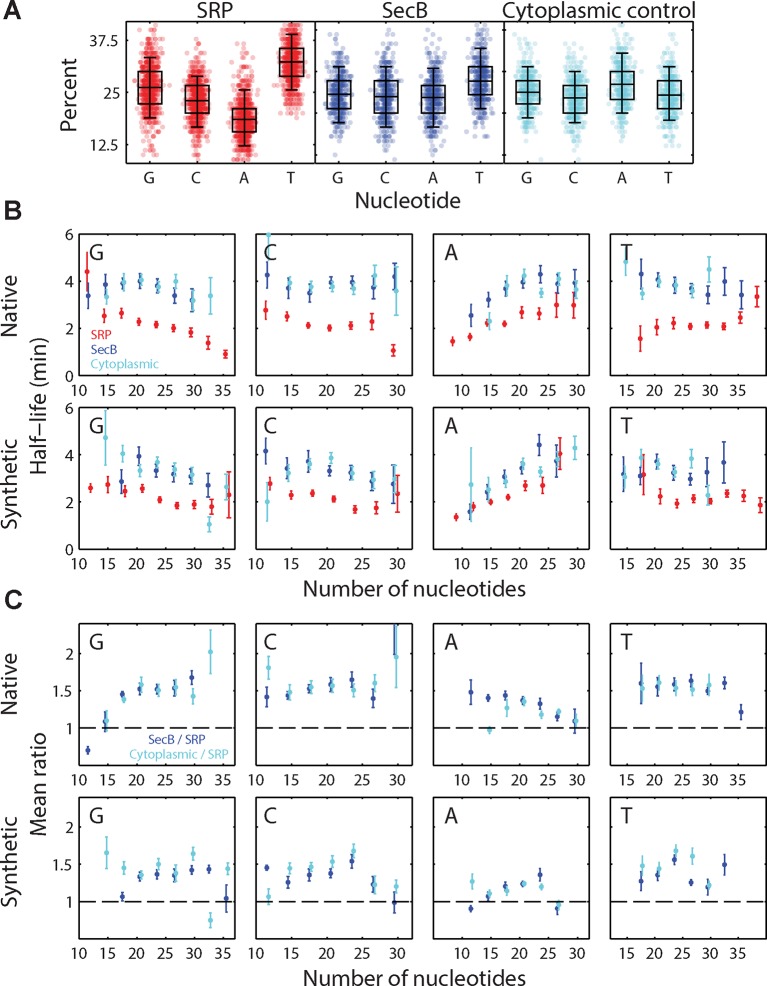
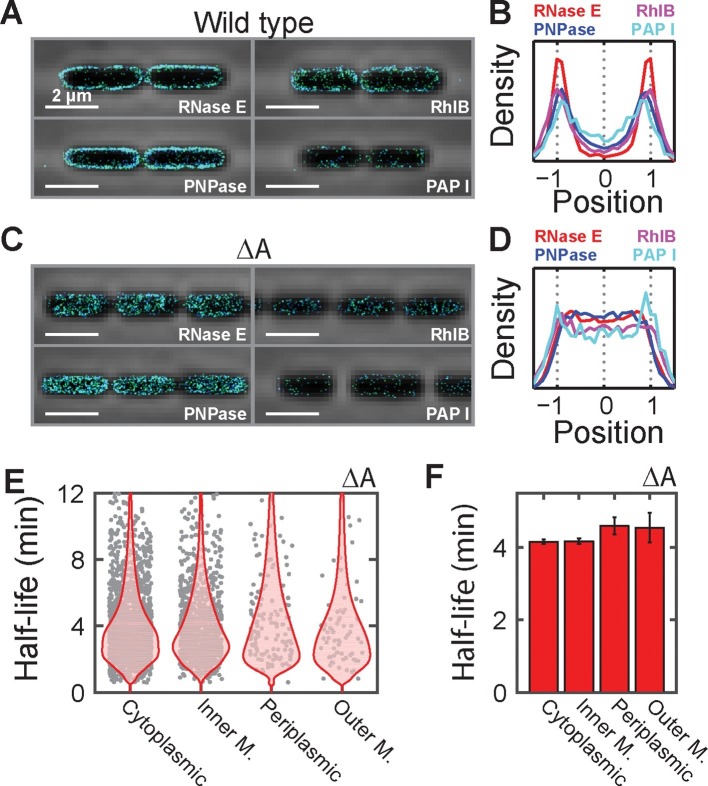
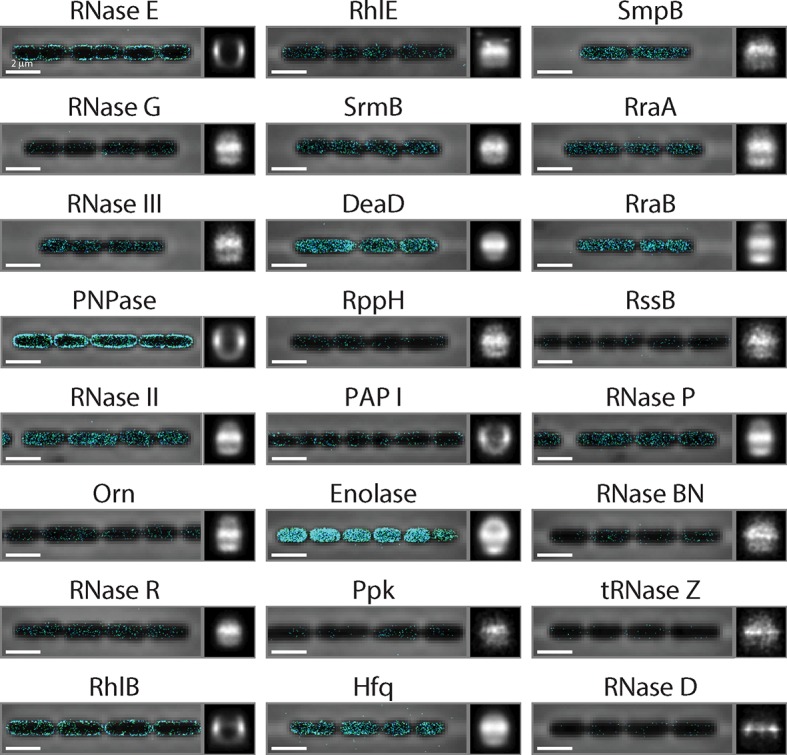
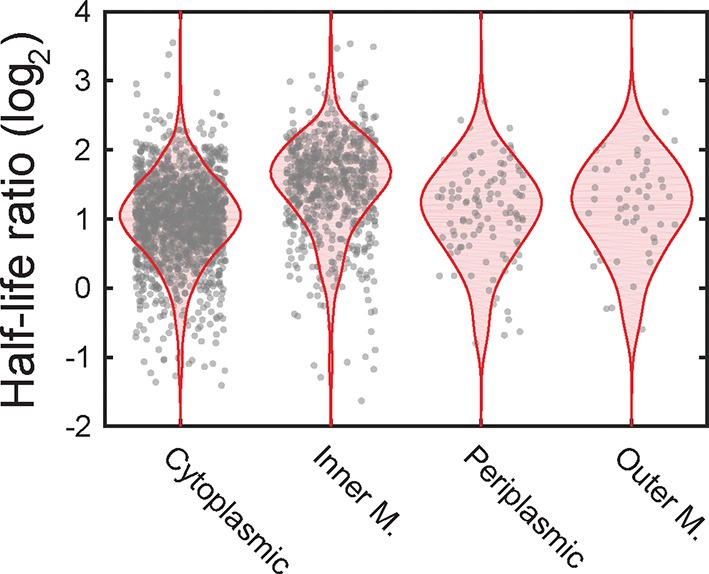
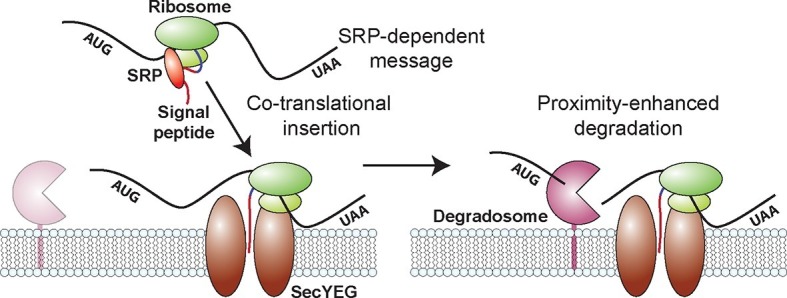
Spatial organization of the transcriptome has emerged as a powerful means for regulating the post-transcriptional fate of RNA in eukaryotes; however, whether prokaryotes use RNA spatial organization as a mechanism for post-transcriptional regulation remains unclear. Here we used super-resolution microscopy to image the E. coli transcriptome and observed a genome-wide spatial organization of RNA: mRNAs encoding inner-membrane proteins are enriched at the membrane, whereas mRNAs encoding outer-membrane, cytoplasmic and periplasmic proteins are distributed throughout the cytoplasm. Membrane enrichment is caused by co-translational insertion of signal peptides recognized by the signal-recognition particle. Time-resolved RNA-sequencing revealed that degradation rates of inner-membrane-protein mRNAs are on average greater that those of the other mRNAs and that this selective destabilization of inner-membrane-protein mRNAs is abolished by dissociating the RNA degradosome from the membrane. Together, these results demonstrate that the bacterial transcriptome is spatially organized and suggest that this organization shapes the post-transcriptional dynamics of mRNAs.

Keywords: E. coli; RNA degradation; biophysics; cell biology; fluorescence in situ hybridization; next-generation sequencing; spatial organization; structural biology; superresolution microscopy; transcriptome.


Conflict of interest statement

XZ: Reviewing editor, eLife.

The other authors declare that no competing interests exist.

Figures

Figure 1.
Figure 1.. The E. coli transcriptome is spatially organized with inner-membrane-protein mRNAs enriched at the membrane.
(A) A scheme illustrating fluorescent labeling and imaging of large but defined populations of mRNAs simultaneously instead of imaging one mRNA species at a time. (B) The required complex FISH probe sets are generated via enzymatic amplification of array-derived custom oligonucleotide pools containing tens of thousands of unique sequences. Subsets of these oligopools are selected via PCR, amplified and converted into RNA via in vitro transcription, converted back into DNA via reverse transcription with a fluorescently labeled primer. The RNA templates are removed by alkaline hydrolysis. I1 and I2 represent PCR primers unique for each probe set. RTP represents a reverse transcription primer common to all probe sets. TR (targeting region) represents the portion of the oligo complementary to one of the RNAs of interest. (C) Stacked phase contrast (gray) and STORM cross-section images (color) of example fixed E. coli cells stained with FISH probes against all mRNAs encoding inner-membrane proteins that are in the abundance range of 3–30 copies per cell. The STORM images of the middle section (300-nm thick) of cells are shown here. 3D-STORM images of the entire cells as well as images of mRNAs in other abundance ranges are shown in Figure 1—figure supplement 1. (D) Average short-axis (left) and long axis (right) cross-section images of inner-membrane-protein mRNAs derived from 611 cells computationally normalized to a common width and a common length and then aligned. (E) Density profile of inner-membrane-protein mRNAs constructed from the middle slice (150 nm) of the average long-axis cross-section image shown in (D, right). The x-axis is normalized to the radius of the cell. (F, G) Same as (C, D) but for mRNAs encoding cytoplasmic proteins in the abundance range of 3–30 per cell and the average cross-section images were derived from 319 individual cells. (H) Same as (E) but for mRNAs encoding cytoplasmic proteins (red), periplasmic proteins (purple), and outer-membrane proteins (cyan). The cytoplasmic, periplasmic and outer-membrane-protein distributions were derived from 319, 338 and 194 cells, respectively. Scale bars: 2 µm. DOI: http://dx.doi.org/10.7554/eLife.13065.003
Figure 1—figure supplement 1.
Figure 1—figure supplement 1.. Spatial organization of mRNAs that encode proteins residing in different cellular locations and are in different RNA abundance ranges.
(A) mRNAs encoding inner membrane proteins. Top left panels: Stacked phase contrast (gray) and 3D-STORM images (color) of example E. coli cells stained with FISH probes against all mRNAs predicted to encode inner membrane proteins, grouped into two expression ranges: 1/3–3 copies per cell and 3–30 copies per cell. The z-positions of the molecules are color-coded according to the colored z scale. Bottom left panels: Stacked phase contrast (gray) and STORM cross-section images (color) of the middle 300-nm section of the cells depicted in the top panels. Less than 10 inner-membrane-protein mRNA species are expressed in the 30–300 copies per cell range, and hence are not shown here. Top right panel: Average long-axis cross-section image of mRNA encoding inner-membrane proteins in the concentration range of 3–30 copies per cell. Bottom right panel: Density profile for all mRNAs that encode cytoplasmic proteins in the 1/3–3 copies per cell (blue) and 3–30 copies per cell (green) abundance ranges. Density profile is as defined in Figure 1E. The average density and axial distributions were derived from measurements of tens to hundreds of cells. 247 and 27 mRNA species were stained as part of the 1/3–3 and 3–30 copies per cell groups, respectively. (B) Same as (A) but for mRNAs encoding cytoplasmic proteins. Here the mRNAs are grouped into three expression ranges: 1/3–3 copies per cell, 3–30 copies per cell, and 30–300 copies per cell. The average long-axis cross-section image of mRNA is for the 30–300 copies per cell group, and the density profiles are for all mRNAs that encode cytoplasmic proteins in the 1/3–3 copies per cell (blue), 3–30 copies per cell (green), and 30–300 copies per cell (cyan) abundance ranges. 620, 105, and 62 mRNA species were stained as part of the 1/3–3, 3–30, and 30–300 copies per cell groups, respectively. (C) Same as (A) and (B) but for mRNAs encoding periplasm proteins. Only mRNAs in the expression range of 1/3–3 copies per cell are shown. Less than 10 periplasmic mRNA species are expressed in either the 3–30 or 30–300 copies per cell range. 44 mRNA species were stained within this group. (D) Same as (C) but for mRNAs encoding outer-membrane proteins. 23 mRNA species were stained within this group. (E) Stacked phase contrast and 3D-STORM images for cells stained with anti-sense control probes derived from cytoplasmic-protein mRNAs (left) or inner-membrane-protein mRNAs (right), both in the 3–30 copies per cell abundance range. These antisense probes have the same number of unique probes as the sense probes used in (A) and (B) but have targeting regions that are the reverse complement of the original targeting regions and, thus, have limited targets within the cell. (F) The average number of single-molecule localizations per cell observed for all depicted groups shown in (A–E). Error bars represent SEM. The numbers in the label depict the copy number range. Scale bars: 2 µm DOI: http://dx.doi.org/10.7554/eLife.13065.004
Figure 1—figure supplement 2.
Figure 1—figure supplement 2.. Being polycistronic with an inner-membrane-protein message can confer partial membrane enrichment to an mRNA.
(A) Stacked phase contrast (gray) and STORM cross-section images (color) of example E. coli cells stained with FISH probes to all mRNAs encoding cytoplasmic proteins in the 3–30 copies per cell abundance range. The mRNAs are subdivided into two groups: those not polycistronic (NP) to mRNAs encoding inner-membrane proteins (left) and those polycistronic (P) to mRNAs encoding inner-membrane proteins (right). (B) Average long-axis cross-section images for the mRNAs. Top panel: for mRNAs not polycistronic to mRNAs encoding inner-membrane proteins. Bottom panel: for mRNAs polycistronic to mRNAs encoding inner-membrane proteins. (C) Density profiles for mRNAs not polycistronic to mRNAs encoding inner-membrane proteins (red) and for mRNAs polycistronic to mRNAs encoding inner-membrane proteins (blue). Density profile is as defined in Figure 1E. (B) and (C) are average cell images and density profiles derived from hundreds of cells in each case. (D–F) same as (A–C) but for mRNAs encoding periplasmic proteins. Scale bars: 2 µm. DOI: http://dx.doi.org/10.7554/eLife.13065.005
Figure 2.
Figure 2.. Genomic organization does not play a major role in the organization of the E. coli transcriptome.
Stacked phase contrast (gray) and STORM cross-section images (color) for example fixed E. coli stained for all mRNAs transcribed from discrete 100-kb genomic loci in the abundance range of 1/3–3 and/or 3–30 copies per cell. The label marks the genomic region and abundance range studied in each case. Several cases show significant membrane enrichment, and these cases correspond to loci enriched in mRNAs that encode inner-membrane proteins. Scale bars: 2 µm. DOI: http://dx.doi.org/10.7554/eLife.13065.006
Figure 3.
Figure 3.. SRP-dependent co-translational insertion of signal peptides plays a major role in the membrane localization of inner-membrane-protein mRNAs.
(A) Fusion constructs between different signal peptides and mMaple3. (B) Stacked phase contrast (gray) and STORM cross-section images (color) of example E. coli cells expressing mMaple3 fused to the signal peptide from an SRP-dependent protein FhuB. The cells were stained with FISH probes against mMaple3. (C) Left: Average long-axis cross-section images of cells expressing mMaple3 fused to SRP-dependent signal peptides derived from FhuB, CcmH, AcrB, and TolB. Right: Average long-axis cross-section images of cells expressing mMaple3 fusions to AcrB and TolB signal peptides without the start codon (-AUG). (D) Density profiles derived from the average long-axis cross-section images of mMaple3 fusions to the AcrB signal peptide with (red) and without (blue) the start codon. Density profile is as defined in Figure 1E. (E) Stacked phase contrast and STORM cross-section images of example E. coli cells expressing mMaple3 fused to a signal peptide derived from a SecB-dependent protein GlpQ. The cells were stained with FISH probes against mMaple3. (F) Average long-axis cross-section images of cells expressing mMaple3 fused to SecB-dependent signal peptides derived from GlpQ, LivJ, PhoA and MalE. (G) Stacked phase contrast and STORM cross-section images for example E. coli cells treated with the translation-initiation-inhibitor kasugamycin. The cells were stained with the FISH probe set against inner-membrane-protein mRNAs in the abundance range of 3–30 copies per cell. (H) Average long-axis cross-section images of cells in the presence (+Kas) and absence (-Kas) of kasugamycin. The cells were stained with the FISH probes against inner-membrane-protein mRNAs in the abundance range of 3–30 copies per cell. Average long-axis cross-section images in C, F and H were derived from all measured cells, tens to hundreds of cells in each case. Scale bars: 2 µm. DOI: http://dx.doi.org/10.7554/eLife.13065.007
Figure 3—figure supplement 1.
Figure 3—figure supplement 1.. mRNA for the inner-membrane protein BglF is enriched at the membrane in a translation-dependent fashion.
(A) Cartoon depiction of an mRNA expressing a fusion between full length, wild-type bglF and mMaple3. The green hashed region represents a putative SRP signal, i.e. the first transmembrane domains in bglF. (B) Left panel: Stacked phase contrast (gray) and STORM cross-section images (color) of example E. coli cells stained with FISH probes to mMaple3. Right panel: Average long-axis cross section images derived from hundreds of cells. (C) Density profile for the cross section in (B). Density profile is as defined in Figure 1E. (D–F) As in (A–C) but for bglF construct in which the start codon has been replaced by a stop codon (TAA). (G–I) As in (A–C) but for a bglF construct in which the codon at position 202 has been replaced with a stop codon (TAA). The resulting construct expresses only the portion of bglF upstream of the putative SRP signal sequence. This blgF derivative is identical to a previously published derivative that was reported to be membrane enriched (Nevo-Dinur et al., 2011). All constructs were expressed from the AttB site on the chromosome. Scale bars: 2 µm. DOI: http://dx.doi.org/10.7554/eLife.13065.008
Figure 4.
Figure 4.. Inner-membrane-protein mRNAs are preferentially destabilized relative to mRNAs encoding cytoplasmic, periplasmic, and outer-membrane proteins.
(A) Scatter plot (grey symbols) of the half-lives of individual E. coli mRNA species grouped based on the predicted locations of the proteins that they encode . Each data point represents one mRNA species. Blue colored shapes represent the probability distributions for these data points. (B) Average half-lives of the mRNA groups depicted in (A). The p-value was determined with a two-sided Kolmogrov-Smirnov test. (C, D) Same as (A, B) but for cells after treatment with kasugamycin. See Figure 4—source data 1 for all abundance data versus time and the fit decay rates used to derive half-lives. DOI: http://dx.doi.org/10.7554/eLife.13065.009
Figure 4—figure supplement 1.
Figure 4—figure supplement 1.. Reproducibility of τ-seq measurements between biological replicates.
(A) Example decay time courses of mRNAs as derived from τ-seq measurements shown together with fits to these decays. Data correspond to the two biological replicates of the measurements of the WT strain mg1655 (replicate 1 and 2 are shown in blue crosses and cyan circles, respectively). Solid lines represent the fits to Equation (1) in the Supplemental Experimental Procedures. (B) Scatter plot of the initial mRNA abundance measurement (0 min time point) between two replicates for all genes. The Pearson correlation coefficients for the log10 abundances is 0.927 derived from 4243 RNAs. (C) Scatter plot of the final mRNA abundance (20 min time point) between two replicates for all genes for the WT strain. The Pearson correlation coefficients for the log10 abundances is 0.913 derived from 3984 RNAs. (D) Scatter plot of half-lives between two replicates for the WT strain. The Pearson correlation coefficients for the log10 values is 0.85 derived from 2181 RNAs. Only half-lives for which the error of the decay rate (determined as 1/4 of the 95% confidence interval returned by the fit) was less than half of the fit value itself are reported. If the half-life for an mRNA passed this criterion in both replicates, the reported value is the average of these two half-lives. 2181 RNAs had half-lives that passed this criterion in both replicates. See Figure 4—source data 1 for all abundance data versus time and the fit decay rates used to derive half-lives. DOI: http://dx.doi.org/10.7554/eLife.13065.011
Figure 4—figure supplement 2.
Figure 4—figure supplement 2.. The ratio of mRNA half-lives in the presence and absence of kasugamycin.
Scatter plot (grey symbols) of the log2 ratios of the half-lives measured for all mRNAs measured in the presence of kasugamycin relative to that measured in its absence. The ratios are grouped based on the predicted locations of the encoded proteins. The associated probability distributions (blue) are also shown. DOI: http://dx.doi.org/10.7554/eLife.13065.012
Figure 5.
Figure 5.. Targeting mRNAs to the membrane reduces their lifetimes.
(A) Schematic diagram describing the construction of ~24,000 unique fusions of signal peptide sequences and test genes, and the measurement of the lifetime of the mRNA for each of these fusion constructs. Only the variable signal peptide region is amplified and sequenced; thus, it also serves as a unique barcode for each construct. (B) The mRNA half-lives of all fusion constructs between various signal peptides (SRP, red; SecB, blue; and cytoplasmic-control, cyan) and different test genes (neo, bla, mMaple3, phoA and lacZ). The mRNA lifetimes of fusion constructs with SRP signal peptides are statistically significantly different from those of the fusion constructs with SecB signal peptides or cytoplasmic controls, as determined by a two-sided Kolmogrov-Smirnov test. These p-values are 4×10–20, 2×10–22, 2×10–15, 1×10–21,, and 3×10⁻¹⁰ for difference between the SRP and SecB fusions for neo, bla, mMaple3, phoA, and lacZ, respectively. (C) As in (B) but for the fusion mRNAs in which the start codon is replaced by a stop codon (-AUG). Colored symbols in (B) and (C) represent lifetimes of individual mRNA species, and black bars represent the mean for each group. All error bars represent standard error of the mean. See Figure 5—source data 1 for all abundance data versus time and the fit decay rates used to derive half-lives. DOI: http://dx.doi.org/10.7554/eLife.13065.013
Figure 5—figure supplement 1.
Figure 5—figure supplement 1.. Half-lives of fusion constructions between five test mRNAs and the native or synthetic encodings of various signal peptides.
The measured half-lives for all fusions to the native (N) and synthetic (S) encodings of SRP (red), SecB (blue), and cytoplasmic control (cyan) signal peptides are shown. Symbols: measured half-lives of individual fusion mRNAs. Bars: mean ± SEM for all mRNAs within the indicated group. The synthetic encodings conserve the amino acid sequence but scramble the nucleic acid sequence by randomly selecting codons from all synonymous codons with a weight set by the frequency with which each codon appears in the E. coli genome. Changing the encoding scheme to synthetic encodings did not produce statistically significant changes in the measured half-lives for any of the SRP fusions, but lowered the average half-lives of the SecB and the cytoplasmic controls in some cases. The average half-lives of the fusions to the synthetic encoding of the SRP signal peptides are still smaller than those of the fusions to the synthetic encoding of either the SecB or control peptides in all cases. See Figure 5—source data 1 for all abundance data versus time and the fit decay rates used to derive half-lives. DOI: http://dx.doi.org/10.7554/eLife.13065.015
Figure 5—figure supplement 2.
Figure 5—figure supplement 2.. Effect of sequence bias on the half-lives of the SRP-fusion mRNAs.
(A) The percent of G, C, A, T nucleotides in each group of signal sequences. Symbols: percentage in individual fusion mRNAs. The box and whiskers represents the 50% and 95% quartiles, respectively. The individual panels correspond to native encodings of the SRP signal peptides (red), the SecB signal peptides (blue), and the cytoplasmic control peptides (cyan). The underrepresentation of nucleotide A in SRP signal peptide sequences is consistent with the previous finding of the underrepresentation of A in sequences encoding hydrophobic residues (Prilusky and Bibi, 2009), which are enriched in transmembrane domains. Identical skews were observed for the synthetic encodings of these signal peptides. (B) Average half-lives for beta lactamase (bla) fusions to all native (top) and synthetic (bottom) encodings of the SRP signal peptides (red), SecB signal peptides (blue), and cytoplasmic controls (cyan), measured as a function of the number of each type of nucleotide in the signal sequences (G, C, A, and T from left to right). Only results for bla fusions are shown but similar behaviors are observed for all five of the test genes (bla, neo, mMaple3, phoA, and lacZ). (C) The average ratio of SecB-fusion half-lives to SRP-fusion half-lives (blue) and the average ratio of the cytoplasmic control fusion half-lives to the SRP fusion half-lives (cyan) as a function of the number of each type of nucleotide in the signal sequences. The dashed lines represent a ratio of 1. The average is performed across all five test genes. Data in (B) and (C) have been binned in 3 nucleotide increments, and error bars represent the standard error of the mean. The mRNA half-life appears to depend on the nucleotide compositions, in particular the A and G content, in the signal sequences. However, for a fixed number of each nucleotide, SRP fusions have smaller average half-lives than the SecB and cytosolic control groups in most cases. Thus, SRP fusions destabilize the mRNAs relative to either the SecB or cytoplasmic control fusions even after controlling for nucleotide usage. See Figure 5—source data 1 for all abundance data versus time and the fit decay rates used to derive half-lives. DOI: http://dx.doi.org/10.7554/eLife.13065.016
Figure 6.
Figure 6.. Membrane localization of RNA degradation enzymes is required for the preferential destabilization of inner-membrane-protein mRNAs.
(A) Stacked phase contrast (gray) and STORM cross-section images (color) of example E. coli cells expressing mMaple3 fused to RNase E, RhlB, PNPase, and PAPI in the wild-type background. (B) Density profiles of RNase E, RhlB, PNPase, and PAPI in the wild-type background. Density profile is as defined in Figure 1E. (C, D) Same as (A, B) but for the ΔA strains where the membrane anchor of RNase E, segment A, is deleted. (E) Scatter plot (grey symbols) of half-lives of E. coli mRNAs in the ΔA strain grouped based on the predicted locations of the encoded proteins, shown together with the associated probability distributions (red). (F) Average half-lives for the mRNA groups depicted in (E). Error bars represent standard error of the mean. Scale bars: 2 µm. Average density profiles in B and D were derived from all measured cells, tens to hundreds of cells for each strain. See Figure 6—source data 1 for all abundance data versus time and the fit decay rates used to derive half-lives. DOI: http://dx.doi.org/10.7554/eLife.13065.017
Figure 6—figure supplement 1.
Figure 6—figure supplement 1.. The spatial distribution of RNA processing enzymes in E. coli.
Stacked phase contrast images of the cells (gray) and STORM cross-section images of the enzymes (color) are plotted with average long-axis cross-section images of the enzymes in all imaged cells on the right. The average long-axis cross-section images are derived from hundreds of imaged cells for each strain. Plotted are the Endonucleases RNase E, RNase G, and RNase III; the exonucleases PNPase, RNase II, oligoribonuclease (Orn), and RNase R; the RNA helicases RhlB, RhlE, SrmB, and DeaD; the decapping enzyme, RppH; the polyadenylation enzyme PAPI; the metabolic enzymes Enolase and polyphosphate kinase (Ppk); the RNA chaperone Hfq; the accessory protein for the tmRNA pathway, SmpB; the RNase regulators RraA, RraB, and RssB; and the stable RNA processing enzymes RNase P, RNase BN, tRNase Z, and RNase D. Scale bars: 2 µm. The only enzymes found enriched on the membrane are RNase E, PNPase, RhlB, and PAPI. Enolase and Hfq have binding sites on the C-terminal domain of RNase E (Mackie, 2012). However, because of the significantly higher expression level of Enolase as compared to RNase E, we would not expect to see a clear membrane enrichment of this enzyme even if it completely saturated the binding site on RNase E. By contrast, the more modest expression levels of Hfq suggest that this enzyme does not bind significantly to RNase E under these growth conditions, consistent with a recent report (Persson et al., 2013). DOI: http://dx.doi.org/10.7554/eLife.13065.019
Figure 6—figure supplement 2.
Figure 6—figure supplement 2.. The ratio of half-lives between a degradosome mutant and the wild-type strain.
Scatter plot (grey symbols) of the log2 ratios of the half-lives measured for all mRNAs in the ΔA strain over the half-lives measured for the WT strain. The ratios are grouped based on the predicted locations of the encoded proteins. The associated probability distributions (red) are also shown. DOI: http://dx.doi.org/10.7554/eLife.13065.020
Figure 7.
Figure 7.. A model for the molecular mechanisms underlying the membrane localization of mRNAs encoding inner-membrane proteins and the role of this membrane localization in mRNA degradation.
Translation of SRP-dependent signal peptides recruits SRP and directs mRNAs to the membrane, where the nascent polypeptide is co-translationally inserted in the membrane pore, SecYEG. Proximity of the membrane-bound RNA degradosome to these membrane-localized mRNAs leads to a preferential destabilization of these mRNAs. DOI: http://dx.doi.org/10.7554/eLife.13065.021

Comment in

References

    1. Babcock H, Sigal YM, Zhuang X. A high-density 3D localization algorithm for stochastic optical reconstruction microscopy. Optical Nanoscopy. 2012;1 doi: 10.1186/2192-2853-1-6. - DOI - PMC - PubMed
    1. Bakshi S, Choi H, Weisshaar JC. The spatial biology of transcription and translation in rapidly growing Escherichia coli. Frontiers in Microbiology. 2015;6:636. doi: 10.3389/fmicb.2015.00636. - DOI - PMC - PubMed
    1. Balagopal V, Parker R. Polysomes, P bodies and stress granules: states and fates of eukaryotic mRNAs. Current Opinion in Cell Biology. 2009;21:403–408. doi: 10.1016/j.ceb.2009.03.005. - DOI - PMC - PubMed
    1. Beliveau BJ, Joyce EF, Apostolopoulos N, Yilmaz F, Fonseka CY, McCole RB, Chang Y, Li JB, Senaratne TN, Williams BR, Rouillard JM, Wu CT. Versatile design and synthesis platform for visualizing genomes with Oligopaint FISH probes. Proceedings of the National Academy of Sciences of the United States of America. 2012;109:21301–21306. doi: 10.1073/pnas.1213818110. - DOI - PMC - PubMed
    1. Bernstein JA, Khodursky AB, Lin PH, Lin-Chao S, Cohen SN. Global analysis of mRNA decay and abundance in Escherichia coli at single-gene resolution using two-color fluorescent DNA microarrays. Proceedings of the National Academy of Sciences of the United States of America. 2002;99:9697–9702. doi: 10.1073/pnas.112318199. - DOI - PMC - PubMed