

Clusterin knockdown sensitizes prostate cancer cells to taxane by modulating mitosis
- PMID: 27198502
- PMCID: PMC4931290
- DOI: 10.15252/emmm.201506059
Clusterin knockdown sensitizes prostate cancer cells to taxane by modulating mitosis
Abstract
Clusterin (CLU) is a stress-activated molecular chaperone that confers treatment resistance to taxanes when highly expressed. While CLU inhibition potentiates activity of taxanes and other anti-cancer therapies in preclinical models, progression to treatment-resistant disease still occurs implicating additional compensatory survival mechanisms. Taxanes are believed to selectively target cells in mitosis, a complex mechanism controlled in part by balancing antagonistic roles of Cdc25C and Wee1 in mitosis progression. Our data indicate that CLU silencing induces a constitutive activation of Cdc25C, which delays mitotic exit and hence sensitizes cancer cells to mitotic-targeting agents such as taxanes. Unchecked Cdc25C activation leads to mitotic catastrophe and cell death unless cells up-regulate protective mechanisms mediated through the cell cycle regulators Wee1 and Cdk1. In this study, we show that CLU silencing induces a constitutive activation of Cdc25C via the phosphatase PP2A leading to relief of negative feedback inhibition and activation of Wee1-Cdk1 to promote survival and limit therapeutic efficacy. Simultaneous inhibition of CLU-regulated cell cycle effector Wee1 may improve synergistic responses of biologically rational combinatorial regimens using taxanes and CLU inhibitors.
Keywords: Cdc25C; Wee1; cabazitaxel; clusterin; mitotic exit.
© 2016 The Authors. Published under the terms of the CC BY 4.0 license.
Figures

Cell proliferation for PC3 cells transfected with siSCR or siCLU monitored in real time for 60 h with SP Dynamic xCELLigence system (Voltage 2.5 K). Error bars represent mean ± SEM, n = 4. Slopes compared by ANCOVA test, P < 0.0001.
Left panel: Cell cycle profile of PC3 cells transfected with siSCR or siCLU. Right panel: Percentage quantification of variation in G1, S, and G2/M phases. Error bars represent mean ± SEM, n = 3, **P < 0.01 by paired Student's t‐test (G2/M population P = 0.0058; G1 P = 0.008). Inset: Western blot with CLU antibody in PC3 cells after CLU silencing. Vinculin was used as loading control.
Left panel: RNA microarray analysis comparing PC3 cells transfected with siCLU versus siSCR, and Kinexus phosphokinome microarray analysis comparing LNCaP cells transfected with siCLU versus siSCR. Target genes expression is shown as fold change relative to siSCR, P ≤ 0.05 by an unpaired t‐test for all the genes listed. Central panel: Venn diagram to graphically illustrate the overlap of mRNA and proteins involved in the regulation of mitosis in both transcriptome and phosphokinome analysis. The comparison of these two experiments shows modification of 4 mitosis regulators. Right panel: Western blot validating the expression levels of target proteins.
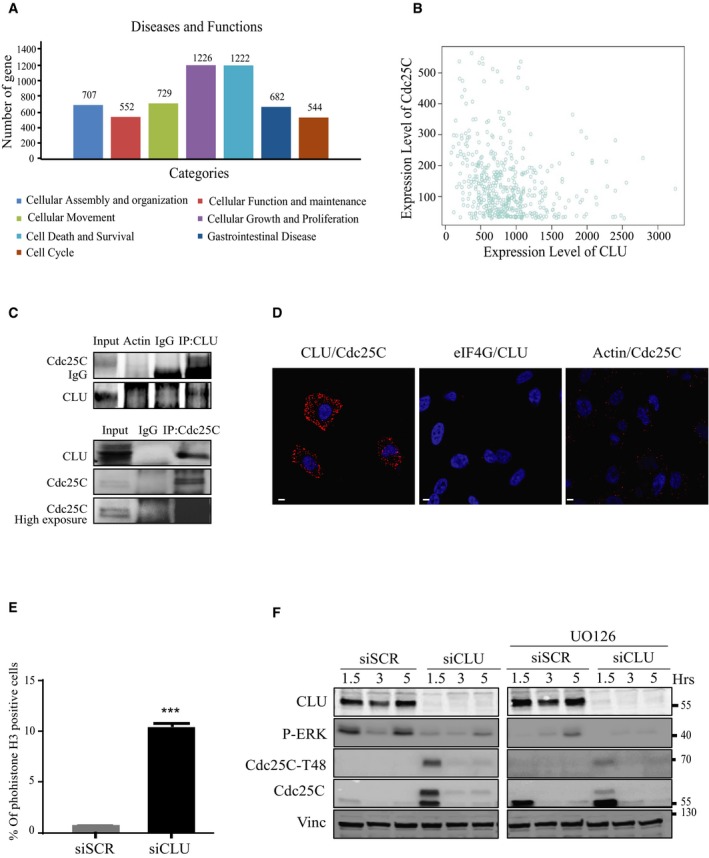
Gene clusters identified by differential expression profiling of RNA microarray analysis comparing PC3 cells transfected with siSCR versus siCLU. Data were analyzed through the use of QIAGEN's Ingenuity Pathway Analysis (IPA; QIAGEN, Redwood City) (
www.quiagen.com/ingenuity ). (P < 0.05; right‐tailed Fisher's exact test).In silico correlation analysis of Cdc25C and CLU mRNA levels in 460 prostate cancer patients using GeneSapiens data set
http://ist.medisapiens.com/ (Spearman correlation: r = −0.23; P < 0.001).Co‐immunoprecipitation from parental PC3 cells. Proteins were immunoprecipitated with specific anti‐Cdc25C and CLU antibodies and analyzed by immunoblotting. Actin and IgG were used as negative controls.
Duolink proximity ligation assay between Cdc25C and CLU in PC3 cells. Confocal microscopy was used to detect the interaction (red dots). DNA was counterstained with DAPI (blue). Actin and eIF4G were used as a negative control. Scale bar represents 10 μm.
FACS analysis showing percentage of the PC3 cells positive for phosphohistone H3 after treatment with siCLU compared to siSCR. Error bar represents mean ± SEM, n = 3, ***P < 0.0001 by the Mann–Whitney test.
Western blot analysis for CLU, Cdc25C, Cdc25C‐T48, and pERK antibodies in PC3 cells after transfection with siSCR or siCLU, followed by treatment with or without MAPK inhibitor UO126, synchronization and nocodazole release at the indicated time. Vinculin was used as loading control.
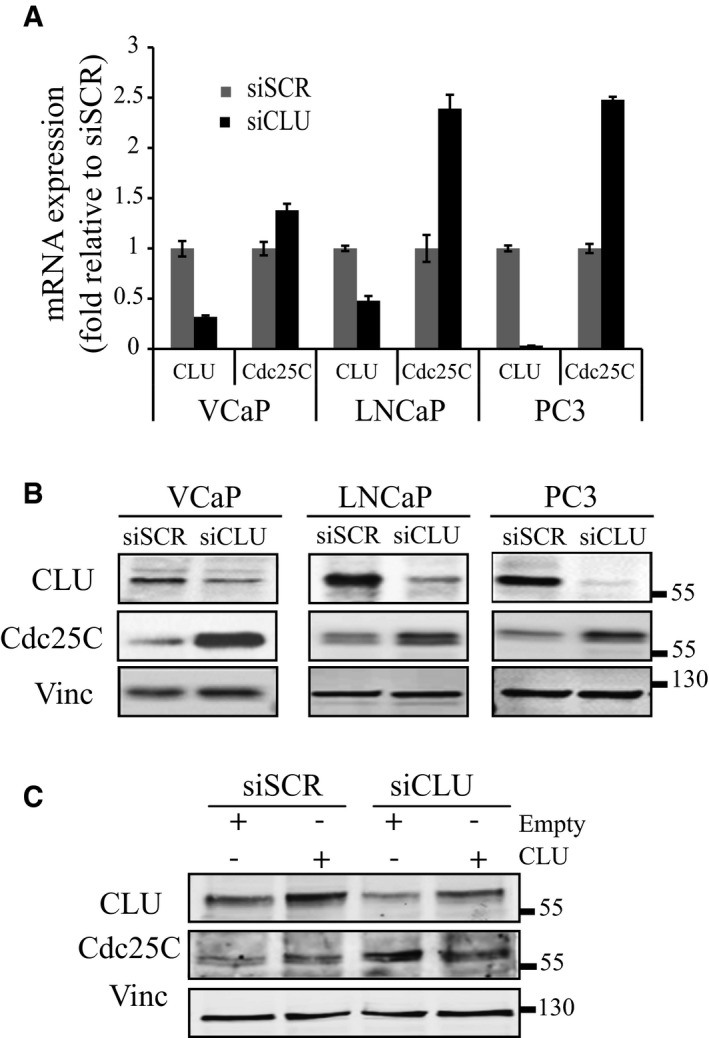
Real‐time PCR for CLU and Cdc25C in three different prostate cancer cell lines. Target genes expression was calculated relative to GAPDH and normalized to siSCR. Error bars represent mean ± SD, n = 3.
Western blot for CLU and Cdc25C after siSCR or siCLU transfection in the same prostate cancer cell lines as in A. Vinculin was used as loading control.
Western blot for CLU and Cdc25C in PC3 cells after transfection with siSCR or siCLU followed by transfection with CLU or empty expression plasmid for an additional 48 h. Vinculin was used as loading control.
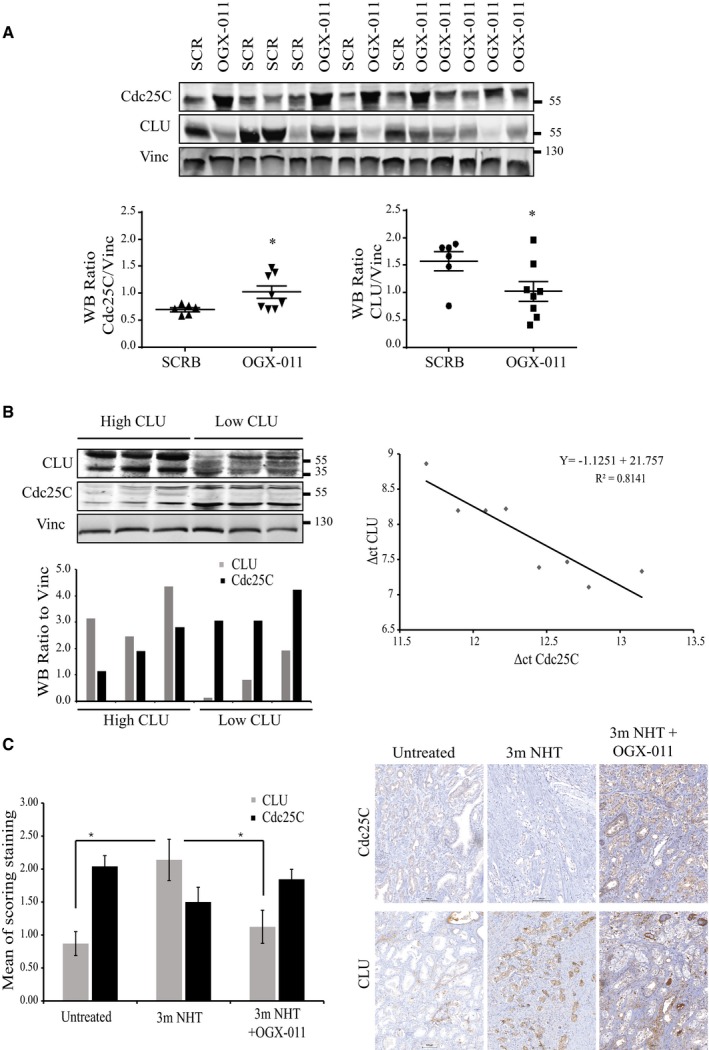
Upper panel: Western blot for CLU and Cdc25C from LNCaP xenografts harvested from mice treated with OGX‐011 (n = 8) or SCR ASO control (n = 6). Vinculin was used as loading control. Lower panel: Quantification of the protein levels, relative to the loading control, reported as dot plots. *P < 0.05 by t‐test followed by Welch's correction (CLU P = 0.049, Cdc25C P = 0.024).
Western blot with the correspondent quantification of protein levels (left) and real‐time PCR (right) from untreated LNCaP xenografts harvested at endpoint. The negative correlation between CLU‐RNA and Cdc25C‐RNA ΔΔC T values was calculated using a spearman test (ρ = −0.86; P = 0.0107).
Immunohistochemical staining for CLU and Cdc25C of radical prostatectomy samples from historical control specimens with no neoadjuvant therapy (n = 5) or neoadjuvant hormone therapy (NHT) (n = 5) or the combination of NHT and OGX‐011 (n = 9) for 3 months prior to surgery. Average score staining from the three groups (left) and representative sections for CLU and Cdc25C (right). Error bars represent mean ± SEM. CLU: *P < 0.05; untreated versus 3mNHT (P = 0.0213); 3mNHT versus 3mNHT + OGX‐011 (P = 0.012) by ANOVA followed by Bonferroni's post hoc analysis. All cases were normalized by clinical stage, Gleason score, and serum PSA. For each patient, the pathologist selected the area with the highest Gleason score. Scale bar represents 100 μm.

Co‐immunoprecipitation from parental PC3 cells transfected with CLU and Cdc25C plasmid expression vectors. Proteins were immunoprecipitated with specific anti‐Cdc25C (left) and CLU (right) antibodies and analyzed by immunoblotting.
Dual immunofluorescence staining with Cdc25C (green) and CLU (red) antibodies in PC3 cells. Confocal microscopy was used to identify the interaction (white arrows). DNA was counterstained with (DAPI) (blue). Scale bar represents 10 μm.
Duolink proximity ligation assay between Cdc25C and CLU in PC3 cells. Confocal microscopy was used to detect the interaction (red dots). DNA was counterstained with DAPI (blue). PC3 cells transfected with siCLU were used as a negative control. Scale bar represents 10 μm.
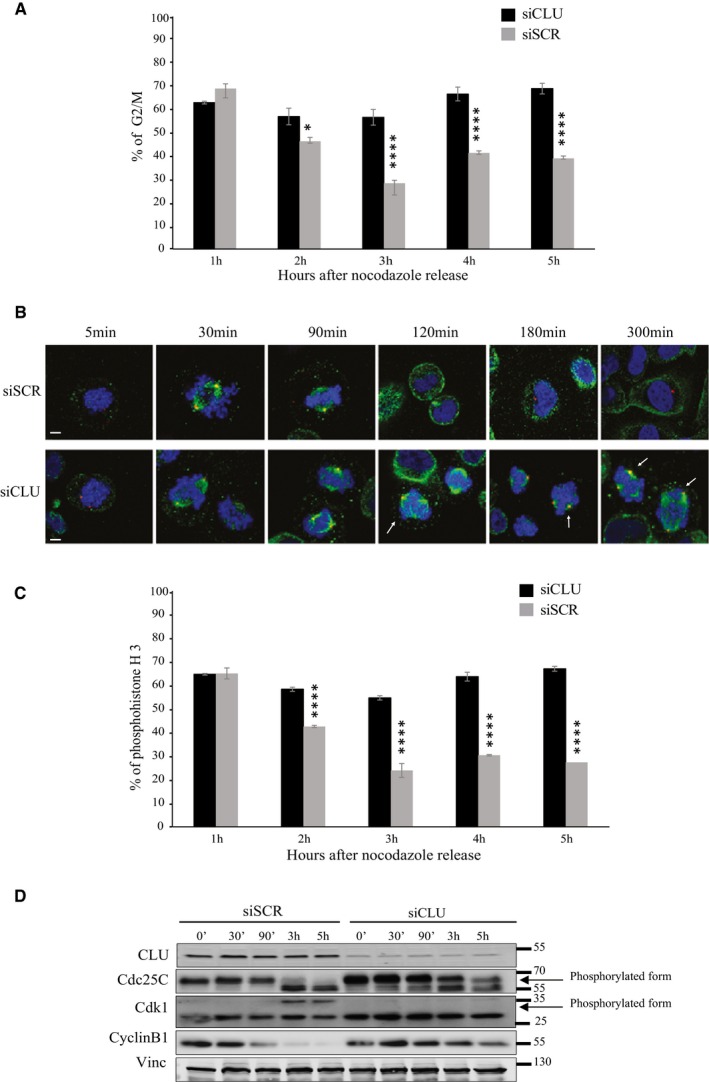
Flow cytometry for PC3 cells after transfection with siSCR or siCLU and synchronization to the M phase with thymidine/nocodazole block. DNA content was analyzed at the indicated time point after nocodazole release. Histograms show % of cells in G2/M, over 5 h period. Error bars represent mean ± SEM, n = 3, *P < 0.05, ****P < 0.0001 by ANOVA followed by Bonferroni's post hoc correction. (2 h P = 0.0142).
Immunofluorescence in PC3 cells after siSCR or siCLU transfection, synchronization and nocodazole release at indicated time points. Mitotic spindle formation was assessed by confocal microscopy, using pericentrin (centrioles; red) and β‐tubulin (microtubules; green) antibodies. DNA was counterstained with (DAPI) (blue). White arrows represent segregation abnormalities. Scale bar represents 10 μm.
Flow cytometry to assess phosphohistone H3 levels in the same setting as in (A). Error bar represents mean ± SEM, n = 3, ****P < 0.0001 by ANOVA followed by Bonferroni's post hoc correction.
Western blot for CLU, Cdc25C, Cdk1, and cyclin B1 antibodies in PC3 cells after transfection with siSCR or siCLU, synchronization and nocodazole release at the indicated time. Vinculin was used as loading control.
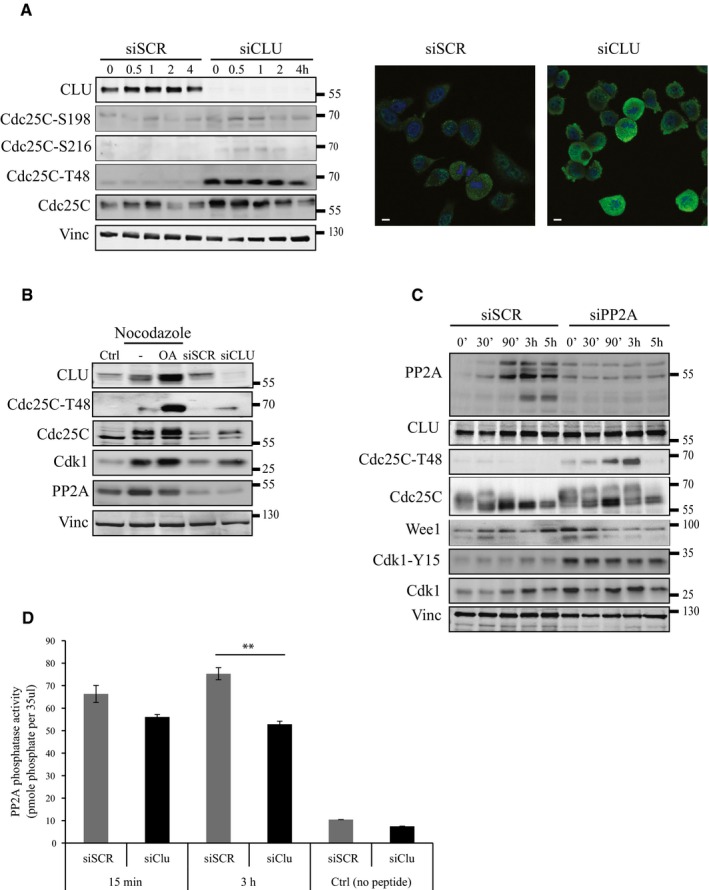
Left panel: Western blot for CLU, Cdc25C, Cdc25C‐T48, Cdc25C S216, and Cdc25C S198 in PC3 cells after siSCR or siCLU transfection, synchronization and nocodazole release at indicated time points. Vinculin was used as loading control. Right panel: Immunofluorescence for Cdc25C‐T48 in PC3 cells after siSCR or siCLU transfection. DNA was counterstained with (DAPI) (blue). Scale bar represents 10 μm.
Western blot for CLU, Cdc25C‐T48, Cdk1, and PP2A in PC3 cells after siSCR or siCLU transfection and after synchronization followed by treatment with or without okadaic acid (OA) (100 nM) for 12 h. Proteins were extracted 15 min after nocodazole release. Vinculin was used as loading control.
Western blot for PP2A, CLU, Cdc25C‐T48, Cdc25C, Wee1, and Cdk1 in PC3 cells transfected with siSCR or siPP2A synchronized and nocodazole released at indicated time points. Vinculin was used as loading control.
PP2A phosphatase activity measurement in PC3 cells after siSCR or siCLU transfection, synchronization and nocodazole release at indicated time points. Error bar represents mean ± SEM, n = 3, **P < 0.01 (P = 0.0025) by ANOVA followed by Bonferroni's post hoc comparisons. Cells treated with no peptide were used as a negative control.

Western blot for CLU, Cdk1‐Y15, Cdk1, and Wee1 in PC3 cells after siSCR or siCLU transfection followed by synchronization and nocodazole release at indicated time points. Vinculin was used as loading control.
Wee1 expression level was evaluated in PC3 cells after CLU silencing by real‐time PCR. Error bar represents mean ± SEM, n = 3, ***P < 0.001 (P = 0.0001) by unpaired t‐test followed by Welch's correction.
FACS analysis showing percentage of the PC3 cells positive for phosphohistone H3 after transfection with siSCR or siCLU in the presence and absence of Wee1 inhibitor, MK‐1775. Error bar represents mean ± SEM, n = 3, ****P < 0.0001 by the Mann–Whitney test.
Western blot for CLU, Wee1, Cdk1‐Y15, Cdk1, and cyclin B1 in PC3 cells after transfection with siSCR or siCLU followed by synchronization and treatment with or without MK‐1775, a specific Wee1 inhibitor, for 12 h. Cells were harvested at different time points after nocodazole release. Vinculin was used as loading control.

Cabazitaxel IC50 calculation using WST1 assay in PC3 cells after transfection with siSCR or siCLU (left), and SCR or OGX‐011 (right) followed by 72 h of cabazitaxel treatment. Percentage of surviving cells was calculated relative to control. Error bar represents mean ± SEM, n = 3. Inset: Western blot was performed to verify CLU knockdown in cells.
Mitotic cells and cells in mitotic catastrophe were counted using DAPI in PC3 cells after SCR or OGX‐011 transfection followed by different concentration of cabazitaxel as indicated (> 1,000 counts). Error bar represents mean ± SEM., *P < 0.05, ***P < 0.001, and ****P < 0.0001 by Student's t‐test (caba 1.5 nM P = 0.00115; 3 nM P = 0.0105; 4.5 nM P = 1.93 × 10⁻⁷; 6.25 nM P = 8.9 × 10⁻⁹; 12.5 nM P = 6.8 × 10⁻⁹; 25 nM P = 1.2 × 10⁻⁹).
Clonogenic assay in PC3 cells after SCR or OGX‐011 transfection followed by treatment with different concentrations of cabazitaxel as indicated. The number of survival clones was assessed after 15 days using crystal violet assay. Error bars represent mean ± SEM n = 3, *P < 0.05, **P < 0.01 by the Mann–Whitney test (0 nM caba P = 0.039; 0.5 nM P = 0.0079; 2 nM P = 0.0079).
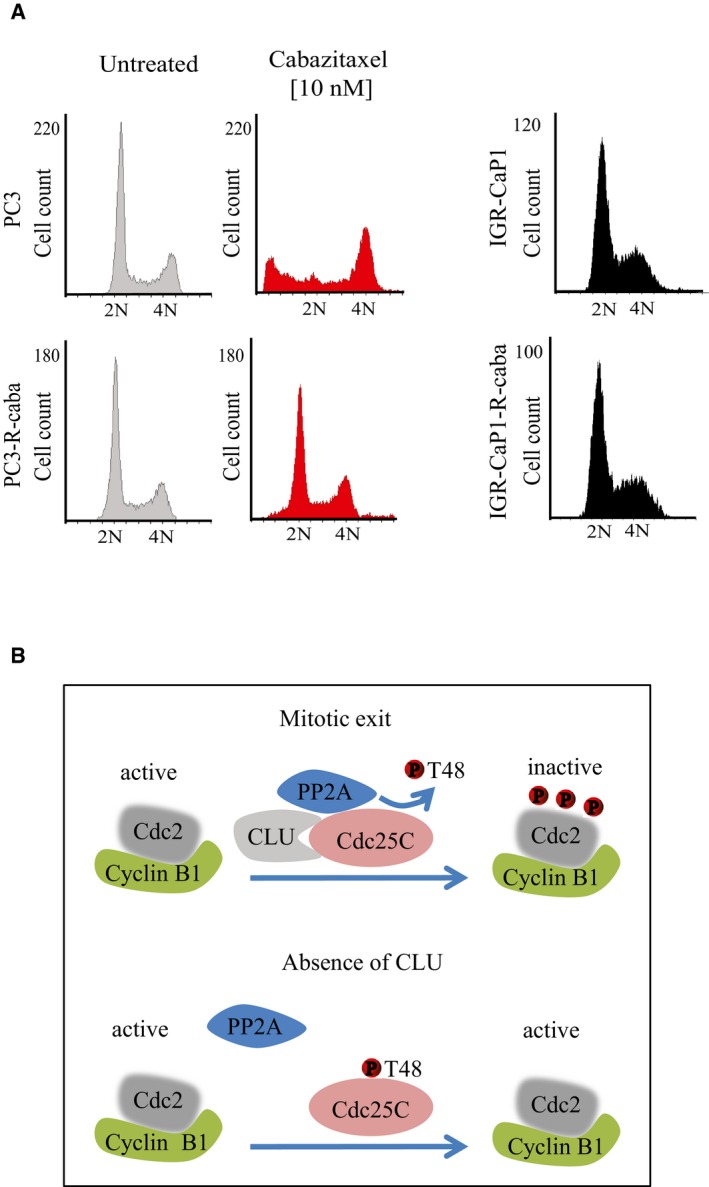
Cell cycle profile of IGR‐CaP1, IGR‐CaP1‐R‐caba; and PC3, PC3‐R‐caba cells in the presence or absence of 10 nM cabazitaxel.
Schema of molecular interaction between CLU and Cdc25C that regulate Cdk1/cyclin B1 activity.
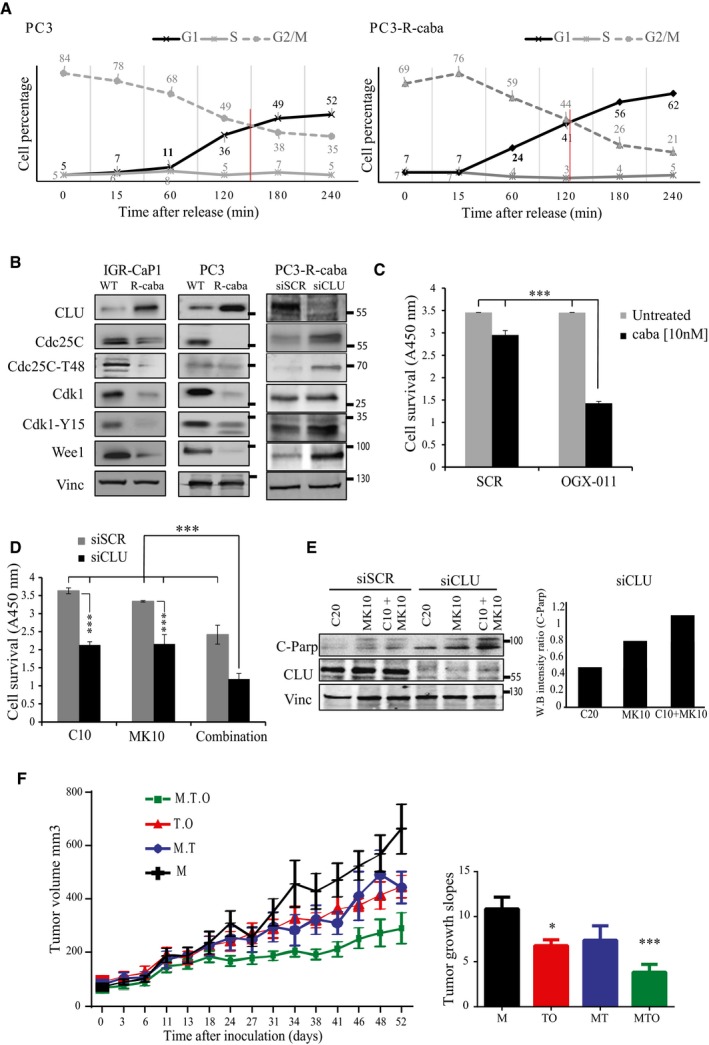
Cell cycle distribution of synchronized PC3 and PC3‐R‐caba cells 60 min after nocodazole release at indicated time points.
Western blot for CLU, Cdc25C, Cdc25C‐T48, Cdk1, Cdk1‐Y15, and Wee1 in IGR‐CaP1 and PC3 parental (WT) or cabazitaxel‐resistant (R‐caba) cells as well as for PC3‐R‐caba cells transfected with siSCR or siCLU. Vinculin was used as loading control.
Cell survival measured using WST1 in PC3‐R‐caba cells after SCR or OGX‐011 transfection and treatment with 10 nM cabazitaxel for 48 h. Error bar represents mean ± SEM, n = 3, ***P < 0.001 by one‐way ANOVA followed by Bonferroni's post hoc correction.
Cell survival measured using WST1 in PC3 resistant cells after transfection with siSCR or siCLU followed by treatment with cabazitaxel (10 nM; C10), MK‐1775 (10 nM; MK10), or both for 72 h. Error bar represents the mean ± SEM, n = 3, ***P < 0.001 by one‐way ANOVA followed by Bonferroni's post hoc correction.
PARP cleavage was assessed by Western blot in cells treated as in (D) and its relative expression was quantified by densitometry using ImageJ. Vinculin was used as loading control.
Left panel: Quantification of tumor volume over 52 days in nude male mice xenotransplanted with PC3‐docetaxel‐resistant cells and treated with either MK‐1775 (M, black line), MK‐1775 and micellar taxane (MT, blue line), micellar taxane and OGX‐011 (TO, red line), or MK‐1775, micellar taxane and OGX‐011 (MTO, green line). The error bars indicate mean ± SEM, n = 8. Right panel: Slopes of tumor growth between groups were compared by ANOVA followed by Dunnett's post hoc analysis. *P < 0.05, ***P < 0.001. P = 0.0488 (M to TO); P = 0.0007 (M to MTO).
References
-
- Al Nakouzi N, Le Moulec S, Albiges L, Wang C, Beuzeboc P, Gross‐Goupil M, de La Motte Rouge T, Guillot A, Gajda D, Massard C et al (2014) Cabazitaxel remains active in patients progressing after docetaxel followed by novel androgen receptor pathway targeted therapies. Eur Urol 68: 228–235 - PubMed
-
- Ammar H, Closset JL (2008) Clusterin activates survival through the phosphatidylinositol 3‐kinase/Akt pathway. J Biol Chem 283: 12851–12861 - PubMed
-
- Baguley BC, Marshall ES, Whittaker JR, Dotchin MC, Nixon J, McCrystal MR, Finlay GJ, Matthews JH, Holdaway KM, van Zijl P (1995) Resistance mechanisms determining the in vitro sensitivity to paclitaxel of tumour cells cultured from patients with ovarian cancer. Eur J Cancer 31A: 230–237 - PubMed
-
- Bettuzzi S, Scorcioni F, Astancolle S, Davalli P, Scaltriti M, Corti A (2002) Clusterin (SGP‐2) transient overexpression decreases proliferation rate of SV40‐immortalized human prostate epithelial cells by slowing down cell cycle progression. Oncogene 21: 4328–4334 - PubMed
-
- de Bono JS, Oudard S, Ozguroglu M, Hansen S, Machiels JP, Kocak I, Gravis G, Bodrogi I, Mackenzie MJ, Shen L et al (2010) Prednisone plus cabazitaxel or mitoxantrone for metastatic castration‐resistant prostate cancer progressing after docetaxel treatment: a randomised open‐label trial. Lancet 376: 1147–1154 - PubMed
Publication types
MeSH terms
Substances
LinkOut - more resources
Full Text Sources
Other Literature Sources
Medical
Molecular Biology Databases
Research Materials
Miscellaneous
