. 2016 May 19;8(1):57.
doi: 10.1186/s13073-016-0310-3.

Reconstruction of gene regulatory networks reveals chromatin remodelers and key transcription factors in tumorigenesis

Affiliations

Reconstruction of gene regulatory networks reveals chromatin remodelers and key transcription factors in tumorigenesis

Valeriya Malysheva et al. Genome Med. .

Abstract

Background: Alterations in genetic and epigenetic landscapes are known to contribute to the development of different types of cancer. However, the mechanistic links between transcription factors and the epigenome which coordinate the deregulation of gene networks during cell transformation are largely unknown.

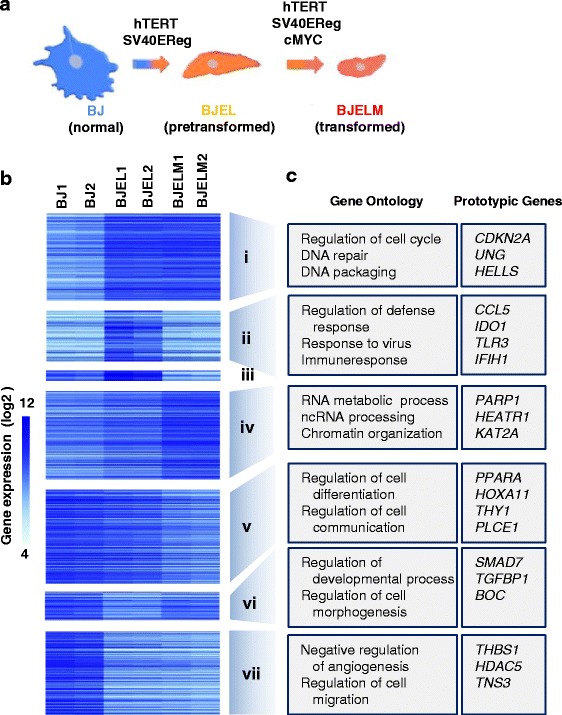
Methods: We used an isogenic model of stepwise tumorigenic transformation of human primary cells to monitor the progressive deregulation of gene networks upon immortalization and oncogene-induced transformation. We applied a systems biology approach by combining transcriptome and epigenome data for each step during transformation and integrated transcription factor-target gene associations in order to reconstruct the gene regulatory networks that are at the basis of the transformation process.

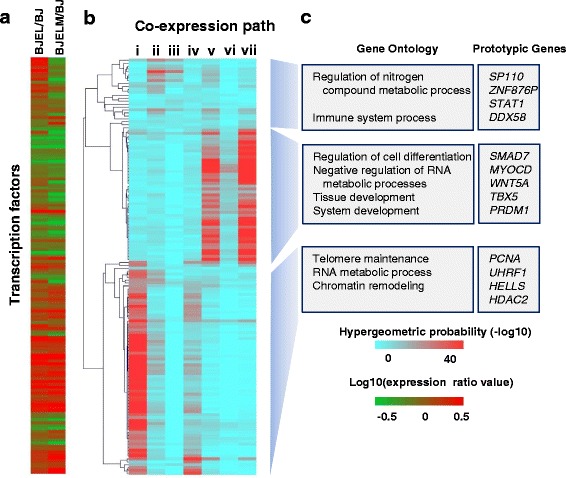
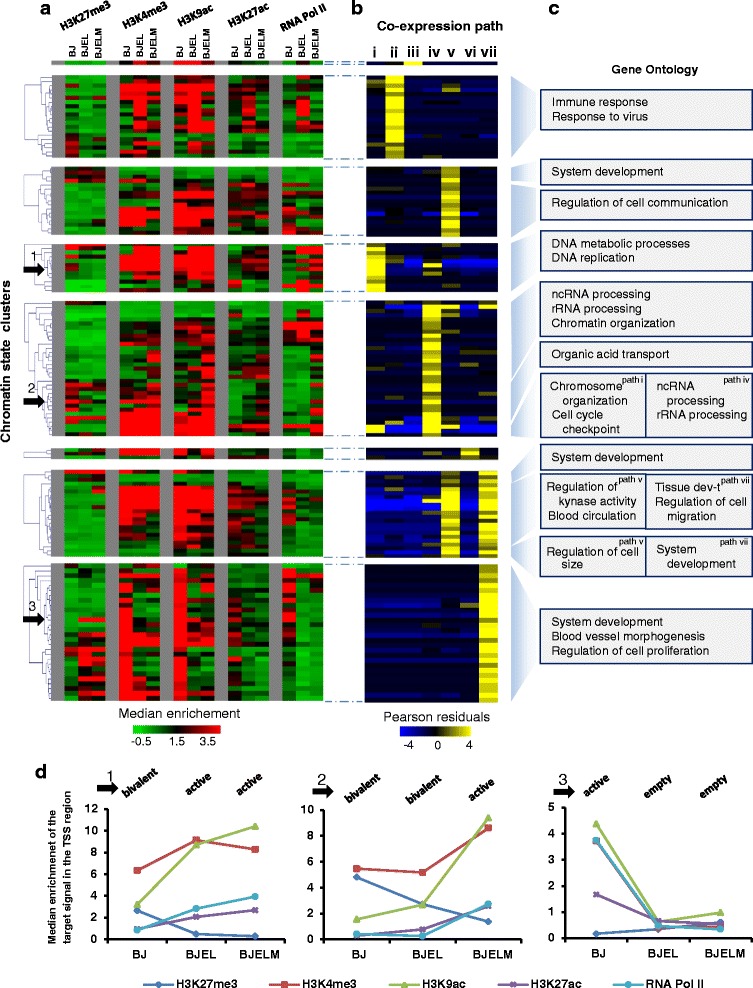
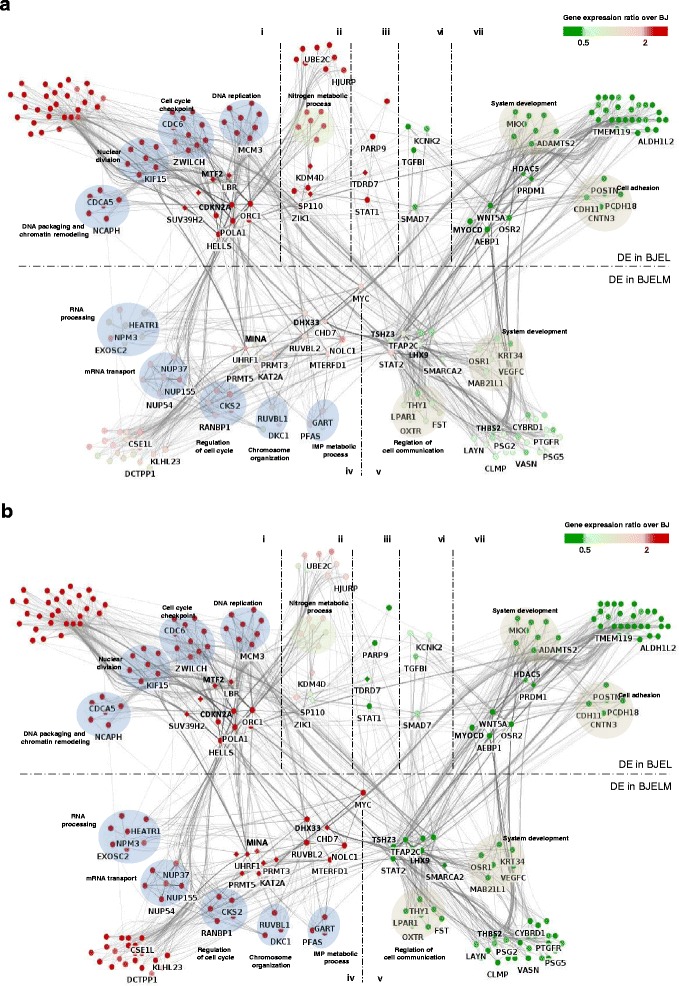
Results: We identified 142 transcription factors and 24 chromatin remodelers/modifiers (CRMs) which are preferentially associated with specific co-expression pathways that originate from deregulated gene programming during tumorigenesis. These transcription factors are involved in the regulation of divers processes, including cell differentiation, the immune response, and the establishment/modification of the epigenome. Unexpectedly, the analysis of chromatin state dynamics revealed patterns that distinguish groups of genes which are not only co-regulated but also functionally related. Decortication of transcription factor targets enabled us to define potential key regulators of cell transformation which are engaged in RNA metabolism and chromatin remodeling.

Conclusions: We reconstructed gene regulatory networks that reveal the alterations occurring during human cellular tumorigenesis. Using these networks we predicted and validated several transcription factors as key players for the establishment of tumorigenic traits of transformed cells. Our study suggests a direct implication of CRMs in oncogene-induced tumorigenesis and identifies new CRMs involved in this process. This is the first comprehensive view of the gene regulatory network that is altered during the process of stepwise human cellular tumorigenesis in a virtually isogenic system.


Figures

Fig. 1
Fig. 1
Transcriptional analysis of the stepwise cell transformation process. a BJ stepwise transformation cell model system. b Changes in the expression rate of differentially expressed genes (DEGs) in normal, immortalized, and transformed cells. c Biological process-based Gene Ontology analysis (performed with DAVID, p < 0.05; Additional file 2: Figure S2) for each co-regulated group of genes (co-expression pathways i to vii) and prototypic genes
Fig. 2
Fig. 2
Association of key transcription factors (TFs) with co-expression pathways. Using the CellNet database of TF–TG associations revealed 142 TFs that were associated with more than 10 % of DEGs. a Expression ratios (relative to BJ) of TFs associated with particular co-expression pathways. b Heat map of hierarchical clustering illustrates the prevalence of corresponding TFs in the regulation of particular co-expression pathways (the color bar corresponds to the − log10(hypergeometric distribution value); red corresponds to high-confidence TF–TG associations, blue to low-confidence associations). c Biological process-based Gene Ontology analysis of clustered groups of TFs associated with particular co-expression pathways (p < 0.05) and prototypic genes
Fig. 3
Fig. 3
Chromatin state transitions in promoters of differentially expressed genes during the cell transformation process and integration of epigenetic data (chromatin state clusters) with transcriptome dynamics (co-expression pathways). a Hierarchical clustering of transcripts based on enrichment of histone modifications and RNA Pol II at the promoter of DEGs. The color represents the median enrichment for each cluster of genes within ±1.5 kb of a TSS of a DEG. b Heat map illustrating the prevalence of chromatin state clusters in particular co-expression paths. The color represents Pearson residuals. Yellow indicates significant enrichment of transcripts in the corresponding expression pathways with a corresponding chromatin state cluster. c Biological process-based Gene Ontology analysis of chromatin state clusters, regrouped by hierarchical clustering (hierarchical tree in a), and associated with the same co-expression pathway. d Three examples of chromatin state clusters illustrating the evolution of the epigenetic landscape in the stepwise transformation process (black arrows in a). Panel 1 correspond to the changes from the bivalent chromatin state in BJ cells to the active state in BJEL and BJELM cells. In the same manner, panel 2 corresponds to the changes from the bivalent chromatin state in BJ and BJEL cells to the active state in BJELM cells. Finally, panel 3 corresponds to the chromatin state cluster that characterizes the group of downregulated genes in BJEL and BJELM cells; the promoters of these genes are in the active state in BJ cells but lose all marks in the BJEL and BJELM cells
Fig. 4
Fig. 4
Gene regulatory network (GRN) of the BJ stepwise transformation system. a GRN of immortalized BJEL cells. b GRN of transformed BJELM cells. Chromatin remodelers/modulators are represented as diamond-shaped nodes, while other genes, highly connected “hubs”, and “bottlenecks” are represented as circles. The differential expression levels at immortalization and during the transformation steps were colored per node in a heat map format such that the dynamic changes could be visualized. Dashed lines separate the GRN into seven segments corresponding to seven (i to vii) gene co-expression pathways. Functionally related genes are circled under an enriched GO term (DAVID, p < 0.05)
Fig. 5
Fig. 5
Validation of predicted factors. a Test for anchorage-independent growth on soft agar. All BJELM transfected conditions, except for the control, exhibit drastic decreases in the capacity to form colonies on soft agar. b Colonies formed by BJELM cells after 3 weeks of incubation on soft agar. The error bars represent the standard deviation between the biological replicates

References

    1. Hanahan D, Weinberg RA. Hallmarks of cancer: the next generation. Cell. 2011;144(5):646–74. doi: 10.1016/j.cell.2011.02.013. - DOI - PubMed
    1. Stratton MR, Campbell PJ, Futreal PA. The cancer genome. Nature. 2009;458(7239):719–24. doi: 10.1038/nature07943. - DOI - PMC - PubMed
    1. Hahn WC, Hahn WC, Counter CM, Counter CM, Lundberg AS, Lundberg AS, et al. Creation of human tumour cells with defined genetic elements. Nature. 1999;400(6743):464–8. doi: 10.1038/22780. - DOI - PubMed
    1. Bernstein BE, Mikkelsen TS, Xie X, Kamal M, Huebert DJ, Cuff J, et al. A bivalent chromatin structure marks key developmental genes in embryonic stem cells. Cell. 2006;125(2):315–26. doi: 10.1016/j.cell.2006.02.041. - DOI - PubMed
    1. Vjetrovic J, Shankaranarayanan P, Mendoza-Parra MA, Gronemeyer H. Senescence-secreted factors activate Myc and sensitize pretransformed cells to TRAIL-induced apoptosis. Aging Cell. 2014;13(3):487–96. doi: 10.1111/acel.12197. - DOI - PMC - PubMed

MeSH terms

Substances