

Seasonal dynamics of bacterial meningitis: a time-series analysis
- PMID: 27198841
- PMCID: PMC5516123
- DOI: 10.1016/S2214-109X(16)30064-X
Seasonal dynamics of bacterial meningitis: a time-series analysis
Abstract
Background: Bacterial meningitis, which is caused mainly by Neisseria meningitidis, Haemophilus influenzae, and Streptococcus pneumoniae, inflicts a substantial burden of disease worldwide. Yet, the temporal dynamics of this disease are poorly characterised and many questions remain about the ecology of the disease. We aimed to comprehensively assess seasonal trends in bacterial meningitis on a global scale.
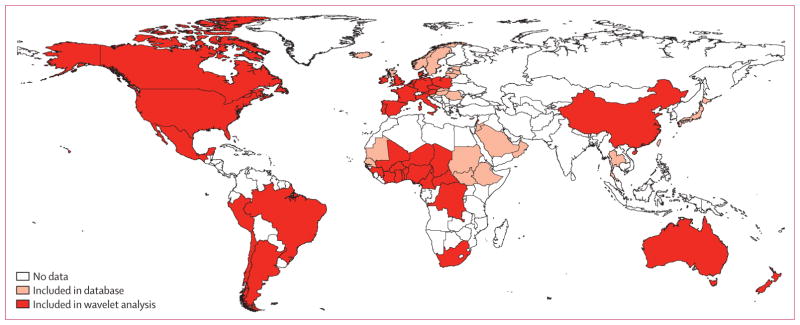
Methods: We developed the first bacterial meningitis global database by compiling monthly incidence data as reported by country-level surveillance systems. Using country-level wavelet analysis, we identified whether a 12 month periodic component (annual seasonality) was detected in time-series that had at least 5 years of data with at least 40 cases reported per year. We estimated the mean timing of disease activity by computing the centre of gravity of the distribution of cases and investigated whether synchrony exists between the three pathogens responsible for most cases of bacterial meningitis.
Findings: We used country-level data from 66 countries, including from 47 countries outside the meningitis belt in sub-Saharan Africa. A persistent seasonality was detected in 49 (96%) of the 51 time-series from 38 countries eligible for inclusion in the wavelet analyses. The mean timing of disease activity had a latitudinal trend, with bacterial meningitis seasons peaking during the winter months in countries in both the northern and southern hemispheres. The three pathogens shared similar seasonality, but time-shifts differed slightly by country.
Interpretation: Our findings provide key insight into the seasonal dynamics of bacterial meningitis and add to knowledge about the global epidemiology of meningitis and the host, environment, and pathogen characteristics driving these patterns. Comprehensive understanding of global seasonal trends in meningitis could be used to design more effective prevention and control strategies.
Funding: Princeton University Health Grand Challenge, US National Institutes of Health (NIH), NIH Fogarty International Center Research and Policy for Infectious Disease Dynamics programme (RAPIDD), Bill & Melinda Gates Foundation.
Copyright © 2016 Paireau et al. Open Access article distributed under the terms of CC BY NC-ND. Published by Elsevier Ltd.. All rights reserved.
Conflict of interest statement
We declare no competing interests.
Figures


Comment in
-
Insights into seasonal dynamics of bacterial meningitis.Lancet Glob Health. 2016 Jun;4(6):e345-6. doi: 10.1016/S2214-109X(16)30078-X. Lancet Glob Health. 2016. PMID: 27198826 No abstract available.
References
-
- McIntyre PB, O’Brien KL, Greenwood B, van de Beek D. Effect of vaccines on bacterial meningitis worldwide. Lancet. 2012;380:1703–11. - PubMed
-
- van de Beek D. Progress and challenges in bacterial meningitis. Lancet. 2012;380:1623–24. - PubMed
-
- Harrison LH, Trotter CL, Ramsay ME. Global epidemiology of meningococcal disease. Vaccine. 2009;27(suppl 2):B51–63. - PubMed
-
- O’Brien KL, Wolfson LJ, Watt JP, et al. Burden of disease caused by Streptococcus pneumoniae in children younger than 5 years: global estimates. Lancet. 2009;374:893–902. - PubMed
MeSH terms
Grants and funding
LinkOut - more resources
Full Text Sources
Other Literature Sources
Medical
