

Electrical stimulation influences chronic intermittent hypoxia-hypercapnia induction of muscle fibre transformation by regulating the microRNA/Sox6 pathway
- PMID: 27199002
- PMCID: PMC4873781
- DOI: 10.1038/srep26415
Electrical stimulation influences chronic intermittent hypoxia-hypercapnia induction of muscle fibre transformation by regulating the microRNA/Sox6 pathway
Abstract
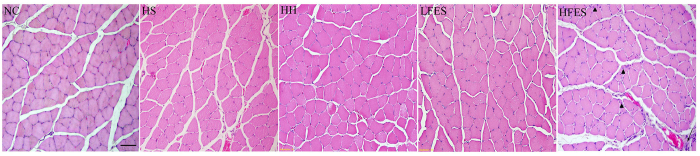
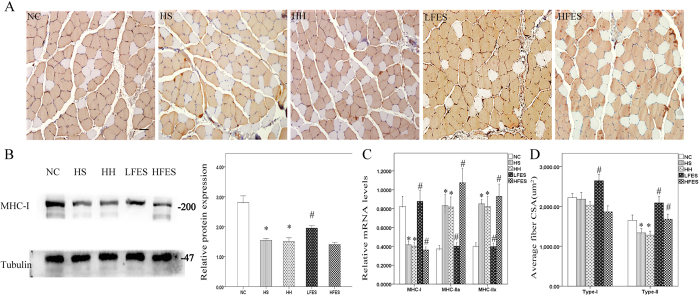
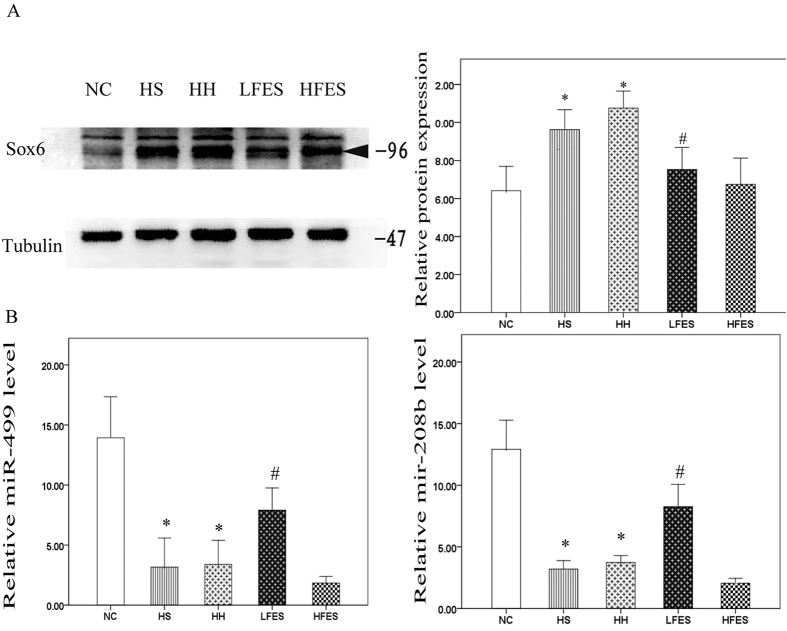
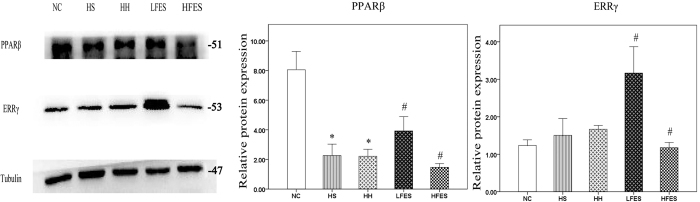
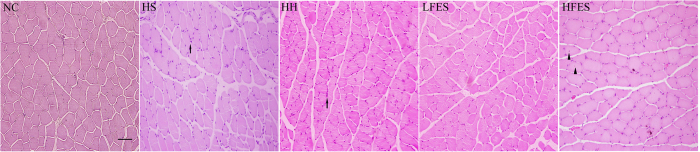
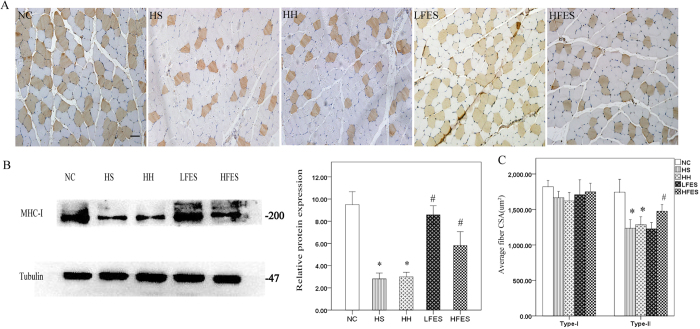
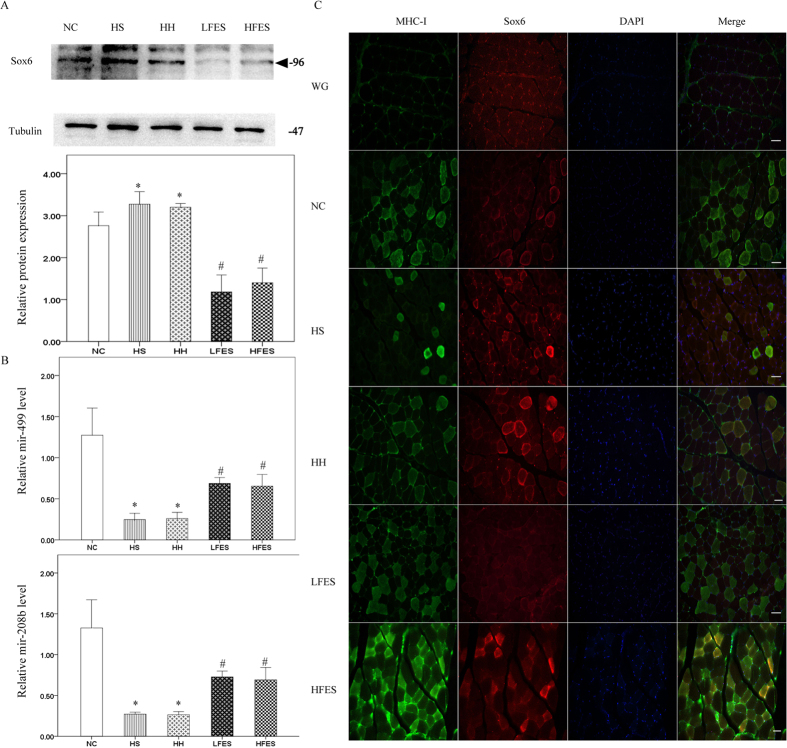
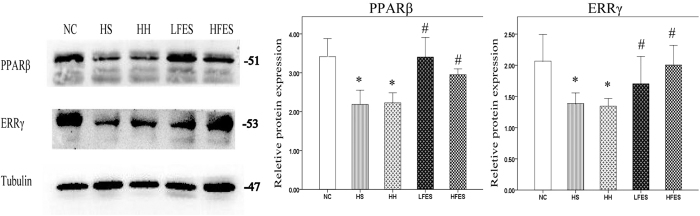
Chronic obstructive pulmonary disease can cause muscle fibre transformation due to chronic intermittent hypoxia-hypercapnia (CIHH). Studies have shown that high expression of Sox6 in muscle could suppress type-I fibres through downregulating the PPARβ (peroxisome proliferator-activated receptor β)/ERRγ (oestrogen-related receptor γ)/microRNA pathway. However, whether this pathway is involved in CIHH-induced muscle fibre transformation is unknown. Electrical stimulation (ES) is an effective approach to ameliorate muscle dysfunction. Here, we explored the effects of ES on CIHH-induced muscle fibre transformation and the microRNA/Sox6 pathway. After CIHH exposure, both the soleus (SOL) and gastrocnemius (GC) muscles showed decreased type-I fibres. The PPARβ/ERRγ/mir-499&208b (PEM, for GC) and PPARβ/mir-499&208b (PM, for SOL) signalling cascades were suppressed, followed by elevated Sox6 expression. Low frequency electrical stimulation (LFES) activated the PEM/PM pathway and enhanced type-I fibre numbers through suppressing Sox6 in SOL and GC. High frequency electrical stimulation (HFES) promoted type-I fibre expression through activating the PEM pathway in GC. Although PPARβ expression and type-I fibres were suppressed in SOL after HFES, no significant change was found in mir-499&208b/Sox6 expression. These results suggest that the microRNA/Sox6 pathway is disturbed after CIHH. Both low and high frequency electrical stimulations induce muscle fibre transformation partly through regulating the microRNA/Sox6 pathway.
Figures
Similar articles
-
Sox6, A Potential Target for MicroRNAs in Cardiometabolic Disease.Curr Hypertens Rep. 2022 May;24(5):145-156. doi: 10.1007/s11906-022-01175-8. Epub 2022 Feb 5. Curr Hypertens Rep. 2022. PMID: 35124768 Review.
-
Electrical Stimulation Improves Rat Muscle Dysfunction Caused by Chronic Intermittent Hypoxia-Hypercapnia via Regulation of miRNA-Related Signaling Pathways.PLoS One. 2016 Mar 29;11(3):e0152525. doi: 10.1371/journal.pone.0152525. eCollection 2016. PLoS One. 2016. PMID: 27023369 Free PMC article.
-
A polymorphism in the porcine miR-208b is associated with microRNA biogenesis and expressions of SOX-6 and MYH7 with effects on muscle fibre characteristics and meat quality.Anim Genet. 2015 Feb;46(1):73-7. doi: 10.1111/age.12255. Epub 2014 Dec 22. Anim Genet. 2015. PMID: 25530254
-
Chronic intermittent hypoxia alters neurotransmission from lateral paragigantocellular nucleus to parasympathetic cardiac neurons in the brain stem.J Neurophysiol. 2015 Jan 1;113(1):380-9. doi: 10.1152/jn.00302.2014. Epub 2014 Oct 15. J Neurophysiol. 2015. PMID: 25318765
-
Sox6, jack of all trades: a versatile regulatory protein in vertebrate development.Dev Dyn. 2011 Jun;240(6):1311-21. doi: 10.1002/dvdy.22639. Epub 2011 Apr 14. Dev Dyn. 2011. PMID: 21495113 Free PMC article. Review.
Cited by
-
Mechanisms of Hypercapnia-Induced Endoplasmic Reticulum Dysfunction.Front Physiol. 2021 Nov 19;12:735580. doi: 10.3389/fphys.2021.735580. eCollection 2021. Front Physiol. 2021. PMID: 34867444 Free PMC article. Review.
-
Hypoxia treatment and resistance training alters microRNA profiling in rats skeletal muscle.Sci Rep. 2024 Apr 10;14(1):8388. doi: 10.1038/s41598-024-58996-7. Sci Rep. 2024. PMID: 38600177 Free PMC article.
-
Sox6, A Potential Target for MicroRNAs in Cardiometabolic Disease.Curr Hypertens Rep. 2022 May;24(5):145-156. doi: 10.1007/s11906-022-01175-8. Epub 2022 Feb 5. Curr Hypertens Rep. 2022. PMID: 35124768 Review.
-
Skeletal Muscle Fiber Type in Hypoxia: Adaptation to High-Altitude Exposure and Under Conditions of Pathological Hypoxia.Front Physiol. 2018 Oct 12;9:1450. doi: 10.3389/fphys.2018.01450. eCollection 2018. Front Physiol. 2018. PMID: 30369887 Free PMC article. Review.
-
Hypoxia and Hypoxia-Inducible Factor Signaling in Muscular Dystrophies: Cause and Consequences.Int J Mol Sci. 2021 Jul 5;22(13):7220. doi: 10.3390/ijms22137220. Int J Mol Sci. 2021. PMID: 34281273 Free PMC article. Review.
References
-
- William D.-C. M., Paul K., John M. & Michael I. P. Skeletal muscle dysfunction in COPD: clinical and laboratory observations. Clin Sci (Lond) 117, 251–264 (2009). - PubMed
-
- Swallow E. B. et al. A novel technique for nonvolitional assessment of quadriceps muscle endurance in humans. J Appl Physiol (1985) 103, 739–746 (2007). - PubMed
Publication types
MeSH terms
Substances
LinkOut - more resources
Full Text Sources
Other Literature Sources
Research Materials
Miscellaneous
