. 2016 Jul;64(7):412-24.
doi: 10.1369/0022155416646538. Epub 2016 May 19.

Potential Involvement of Draxin in the Axonal Projection of Cranial Nerves, Especially Cranial Nerve X, in the Chick Hindbrain

Affiliations

Potential Involvement of Draxin in the Axonal Projection of Cranial Nerves, Especially Cranial Nerve X, in the Chick Hindbrain

Sanbing Zhang et al. J Histochem Cytochem. 2016 Jul.

Abstract

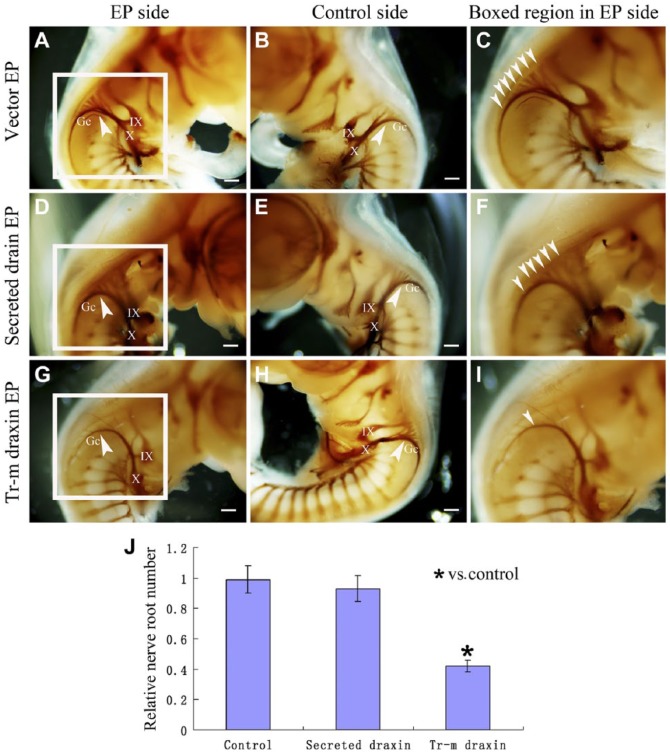
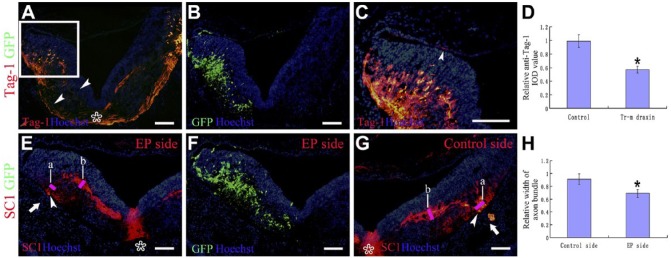
The appropriate projection of axons within the nervous system is a crucial component of the establishment of neural circuitry. Draxin is a repulsive axon guidance protein. Draxin has important functions in the guidance of three commissures in the central nervous system and in the migration of neural crest cells and dI3 interneurons in the chick spinal cord. Here, we report that the distribution of the draxin protein and the location of 23C10-positive areas have a strong temporal and spatial correlation. The overexpression of draxin, especially transmembrane draxin, caused 23C10-positive axon bundles to misproject in the dorsal hindbrain. In addition, the overexpression of transmembrane draxin caused abnormal formation of the ganglion crest of the IX and X cranial nerves, misprojection of some anti-human natural killer-1 (HNK-1)-stained structures in the dorsal roof of the hindbrain, and a simultaneous reduction in the efferent nerves of some motoneuron axons inside the hindbrain. Our data reveal that draxin might be involved in the fascicular projection of cranial nerves in the hindbrain.

Keywords: axon projection; chick; cranial nerve; draxin; hindbrain.


Conflict of interest statement

Competing Interests: The authors declared no potential conflicts of interest with respect to the research, authorship, and/or publication of this article.

Figures

Figure 1.
Figure 1.
Distribution pattern of draxin and projection pattern of 23C10-positive axons in the embryonic chick hindbrain at different stages. The dorsal part is at the top. At level r7 of the chick hindbrain. Asterisks point to the ventral midline. Hoechst staining shows the structure of the sections. (A) At Hamburger–Hamilton (HH) stages 18–19, draxin protein was detected at the regions which are near the rhombic lip, and a weakly dispersed distribution of the draxin protein was detected in the peripheral area of the hindbrain basal zone. (B) Using the same section as A, 23C10-positive areas were detected in the ventral peripheral area of the hindbrain basal zone. (C) Overlay of A and B. Arrows point to the double-positive areas (yellow). (D) At HH stages 21–22, draxin protein expression was increased in the peripheral area of the hindbrain basal zone. White dotted lines mark the whole area in right half hindbrain. Pink dotted lines mark the draxin distribution area in the same half hindbrain. (E) Using the same section as D, 23C10-positive areas were detected in the ventral peripheral area of the hindbrain basal zone. (F) Overlay of D and E. Arrows point to the double-positive areas (yellow). Scale bar = 200 µm.
Figure 2.
Figure 2.
Draxin overexpression caused misprojection of 23C10-positive axons in the whole-mount hindbrain. Dorsal view of the whole-mount hindbrain (the head is on the upper right) and right side was electroporated. (A) Whole-mount 23C10 immunostaining after control vector overexpression. (B) Higher magnification of the same embryo in A. (C) Whole-mount 23C10 immunostaining after secreted draxin overexpression. (D) Higher magnification of the same embryo in C. (E) Whole-mount 23C10 immunostaining after transmembrane draxin overexpression. (F) Higher magnification of the same embryo in E. (G) Column diagram shows the statistical difference of the misprojecting axons in different groups. Arrowheads point to the misprojected axons in the electroporated side. Arrows point to the misprojected axons in the contralateral side. (H) Whole-mount Tuj-1 immunostaining after transmembrane draxin overexpression. Abbreviations: EP, electroporation; Tr-m, transmembrane. * indicate transmembrane or secreted draxin-overexpressed group compares with control group and ▲ indicate transmembrane draxin-overexpressed group compares with secreted draxin-overexpressed group (p < 0.05). Scale bar = 300 µm.
Figure 3.
Figure 3.
Draxin overexpression caused misprojection of 23C10-positive axons in the hindbrain sections. The dorsal part is at the top in transverse section, and the enhanced green fluorescent protein (EGFP)-positive side was overexpressed. The sections were sampled at level r6-r7 of the chick hindbrain. Hoechst staining shows the structure of the sections. (A–C) The same section after control vector overexpression was used. (A) 23C10 immunostaining of the electroporated side. (B) 23C10 immunostaining of the contralateral side. (C) EGFP expression. (D–F) The same section after secreted draxin overexpression was used. (D) 23C10 immunostaining of the electroporated side. (E) 23C10 immunostaining of the contralateral side. (F) EGFP expression. (G–I) The same section after transmembrane draxin overexpression was used. (G) 23C10 immunostaining of the electroporated side. (H) 23C10 immunostaining of the contralateral side. (I) EGFP expression. Arrowheads point to the misprojected axons in the electroporated side. Abbreviations: EP, electroporation; GFP, green fluorescent protein; Tr-m, transmembrane. Scale bar = 100 µm.
Figure 4.
Figure 4.
Different neural markers could detect the misprojected axons in the dorsal roof of the hindbrain. Control vector-overexpressed embryos (D, H, and L) and transmembrane draxin-overexpressed embryos (except D, H, and L) were used at level r6-r7 of the chick hindbrain. Hoechst staining shows the structure of the sections. (A) Neurofilament staining of the electroporated side. (B) Neurofilament staining of the contralateral side using the same section as A. (C) Enhanced green fluorescent protein (EGFP) expression using the same section as A showed that the overexpressed side was the left side. (D) Neurofilament staining of the electroporated side. EGFP expression showed that the overexpressed side was the left side. (E) Tuj-1 staining of the electroporated side. (F) Tuj-1 staining of the contralateral side using the same section as E. (G) EGFP expression using the same section as E showed that the overexpressed side was the left side. (H) Tuj-1 staining of the electroporated side. EGFP expression showed that the overexpressed side was the left side. (I) Human natural killer-1 (HNK-1) staining of the electroporated side. (J) HNK-1 staining of the contralateral side using the same section as I. (K) EGFP expression using the same section as I showed that the overexpressed side was the left side. (L) HNK-1 staining of the electroporated side. EGFP expression showed that the overexpressed side was the left side. Arrowheads indicate some of the misprojected axons in both electroporation (EP) side and the contralateral side. Abbreviation: GFP, green fluorescent protein. Scale bar = 100 µm.
Figure 5.
Figure 5.
Overexpression of transmembrane draxin causes abnormal formation of the rootlets of ganglion crest of cranial nerves (Gc) in the chick hindbrain. Lateral view of 23C10 whole-mount immunostaining of Hamburger–Hamilton (HH) stages 25–26 chick hindbrain. (A) Electroporated side after control vector electroporation. The arrowhead indicates the normally formed Gc. (B) Control side using the same embryo as A. The arrowhead indicates the normally formed Gc. (C) Higher magnification of the boxed region in A. Arrowheads indicate all the thick rootlets of the Gc. (D) Electroporated side after secreted draxin electroporation. The arrowhead indicates that no obvious abnormality was found. (E) Control side using the same embryo as D. The arrowhead indicates that the Gc was formed normally. (F) Higher magnification of the boxed region in D. Arrowheads indicate all the thick rootlets of the Gc. (G) Electroporated side after transmembrane draxin electroporation. The arrowhead indicates that the normal structure of Gc rootlets, which just left the hindbrain, was missing. (H) Control side using the same embryo as G. The arrowhead indicates that the Gc was formed normally. (I) Higher magnification of the boxed region in G. Arrowheads indicate all the thick rootlets of the Gc. (J) Column diagram shows the statistical difference of the relative nerve root number in different groups. Abbreviations: EP, electroporation; Tr-m, transmembrane. Gc, ganglion crest of cranial nerves X; X, cranial nerves X; IX, cranial nerves IX. *p < 0.05. Scale bar = 300 µm.
Figure 6.
Figure 6.
Abnormal formation of the Gc rootlets might be related to the motor axon projections. Transmembrane draxin-overexpressed embryos were used. At level r7 of the chick hindbrain. Asterisks point to the ventral midline. Hoechst staining shows the structure of the sections. (A) Chick Tag-1 staining at low magnification. Arrowheads indicate that the ventral projection of the commissural axons was significantly affected. (B) Enhanced green fluorescent protein (EGFP) expression using the same section as A showed that the overexpressed side was left. (C) Higher magnification of the boxed region in A. Arrowheads showed a few misprojected axons could be detected. (D) Column diagram shows the statistical difference of the relative anti-Tag-1 integral optical density (IOD) value in different groups. (E) SC1 staining on the electroporated side. Arrowheads showed that the number of motoneuron axons passing through the ventral peripheral area of the hindbrain basal zone was reduced. Arrows showed that the root of the cranial nerve was absent on the electroporated side. (F) EGFP expression using the same section as E showed that the overexpressed side was left. (G) SC1 staining of the contralateral side using the same section as E. Arrowheads showed many motoneuron axons passed through the ventral peripheral area of the hindbrain basal zone. Arrows showed the root of the cranial nerve on the control side. No SC1-positive axons could be detected in the dorsal roof of the hindbrain on either side. (H) Column diagram shows the statistical difference of the relative width of axon bundle in different groups: a points the width of axon bundle which passes through the ventral peripheral area of the hindbrain basal zone, and b points the largest width of the projecting axon bundle inside the hindbrain basal zone. Abbreviations: GFP, green fluorescent protein; EP, electroporation. *p < 0.05. Scale bar = 100 µm.

Similar articles

Cited by

References

    1. Lumsden A. The cellular basis of segmentation in the developing hindbrain. Trends Neurosci. 1990;13:329–35. - PubMed
    1. Lumsden A, Krumlauf R. Patterning the vertebrate neuraxis. Science. 1996;274:1109–15. - PubMed
    1. Tillo M, Schwarz Q, Ruhrberg C. Mouse hindbrain ex vivo culture to study facial branchiomotor neuron migration. J Vis Exp. 2014;85:e51397. - PMC - PubMed
    1. Grant PK, Moens CB. The neuroepithelial basement membrane serves as a boundary and a substrate for neuron migration in the zebrafish hindbrain. Neural Dev. 2010;5:9. - PMC - PubMed
    1. Culotti JG, Kolodkin AL. Functions of netrins and semaphorins in axon guidance. Curr Opin Neurobiol. 1996;6:81–8. - PubMed

Publication types

Substances

LinkOut - more resources