. 2016 May 20;352(6288):aad3018.
doi: 10.1126/science.aad3018.

The tumor microenvironment underlies acquired resistance to CSF-1R inhibition in gliomas

Affiliations

The tumor microenvironment underlies acquired resistance to CSF-1R inhibition in gliomas

Daniela F Quail et al. Science. .

Abstract

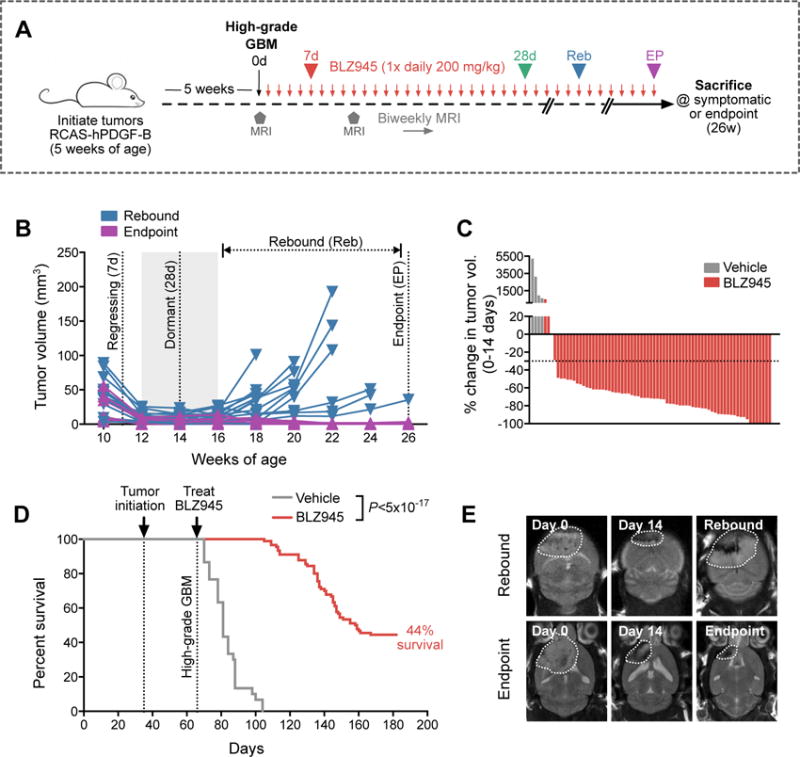
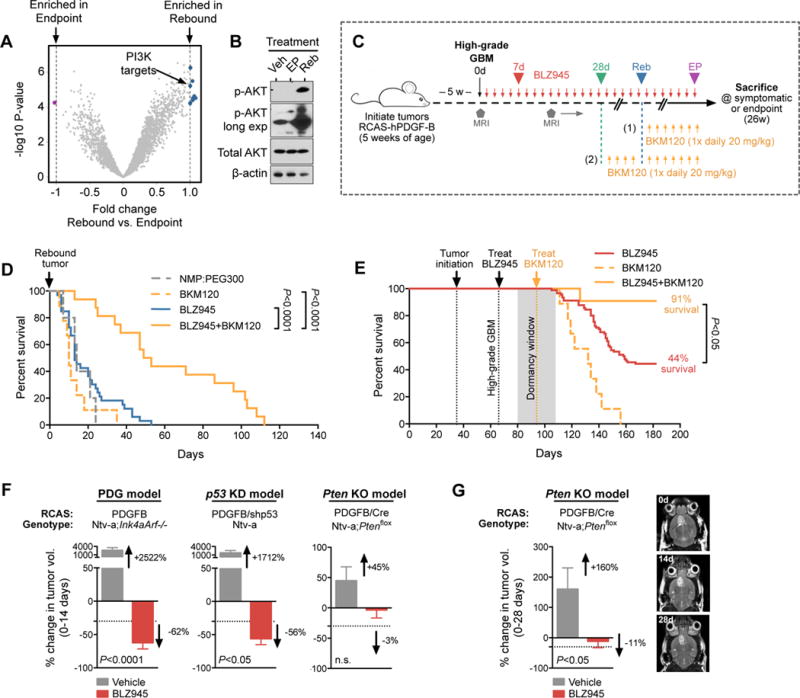
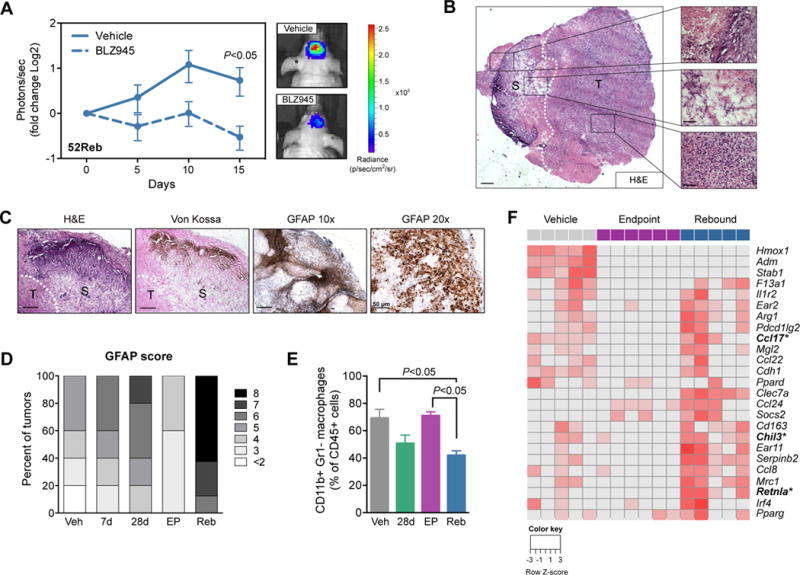
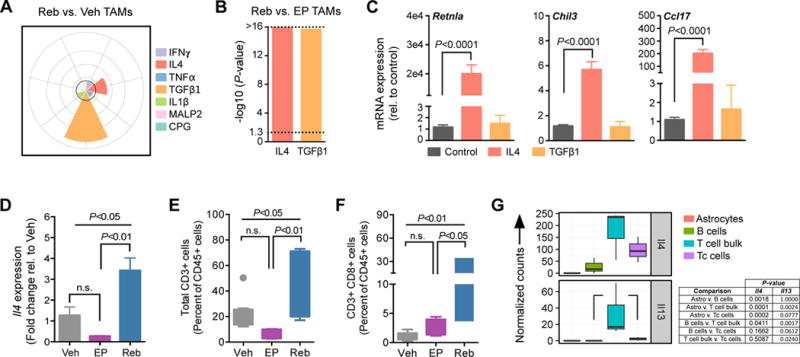
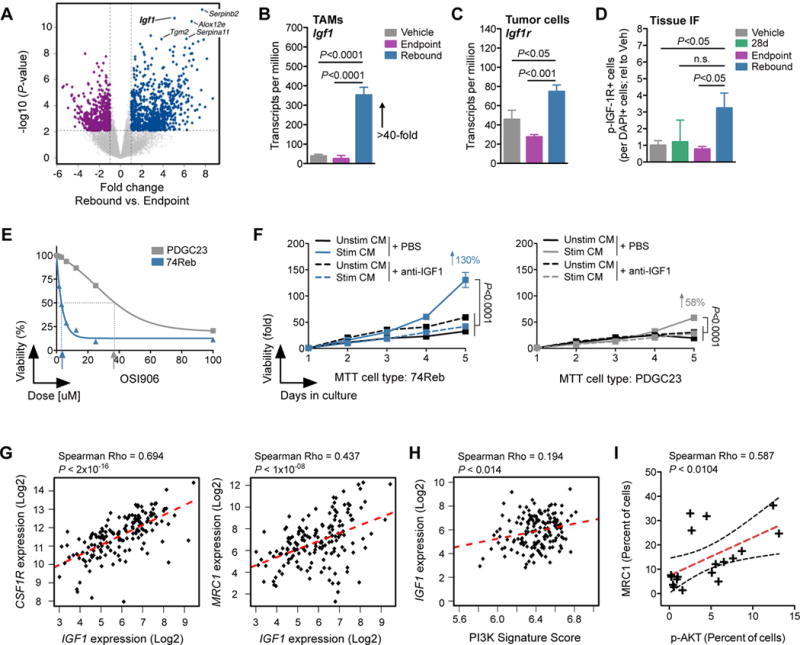
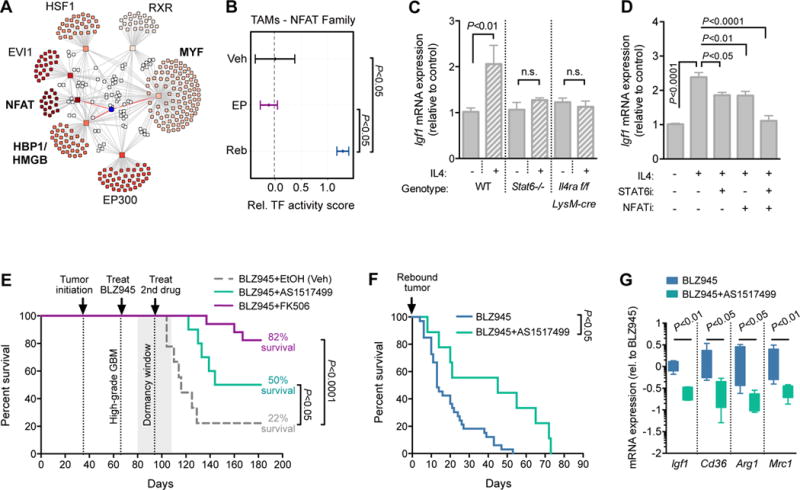
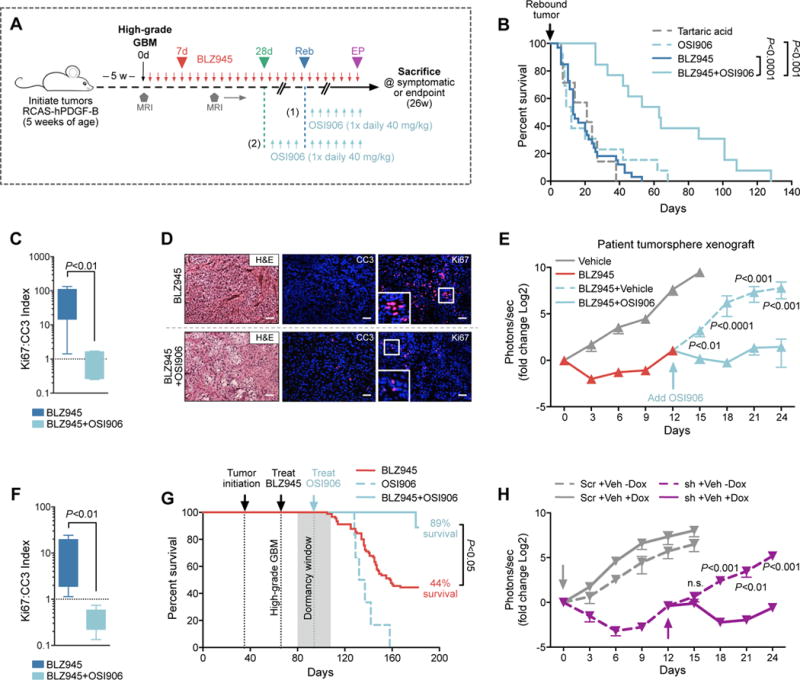
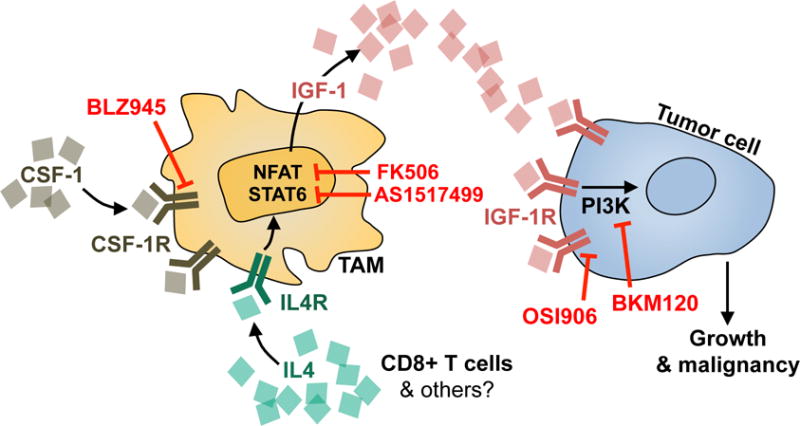
Macrophages accumulate with glioblastoma multiforme (GBM) progression and can be targeted via inhibition of colony-stimulating factor-1 receptor (CSF-1R) to regress high-grade tumors in animal models of this cancer. However, whether and how resistance emerges in response to sustained CSF-1R blockade is unknown. We show that although overall survival is significantly prolonged, tumors recur in >50% of mice. Gliomas reestablish sensitivity to CSF-1R inhibition upon transplantation, indicating that resistance is tumor microenvironment-driven. Phosphatidylinositol 3-kinase (PI3K) pathway activity was elevated in recurrent GBM, driven by macrophage-derived insulin-like growth factor-1 (IGF-1) and tumor cell IGF-1 receptor (IGF-1R). Combining IGF-1R or PI3K blockade with CSF-1R inhibition in recurrent tumors significantly prolonged overall survival. Our findings thus reveal a potential therapeutic approach for treating resistance to CSF-1R inhibitors.


Figures

Figure 1
Figure 1. 56% of GBMs develop resistance to CSF-1R inhibition in long-term preclinical trials
(A) Long-term trial design for testing BLZ945 efficacy in a PDGF-B-driven glioma (PDG) model. High-grade PDG tumors were treated with BLZ945 (200 mg/kg/d) or vehicle (20% captisol) and monitored by biweekly MRI for up to 26 weeks (defined endpoint; see methods) or until symptomatic. (B) Tumor volume curves from biweekly MRIs of long-term BLZ945 trials (n=90 animals treated, 23 representative curves are shown). Four key phases are indicated, including 7d (regressing tumor), 28d (dormant tumor), rebound (Reb; recurrent tumor, evaluated on a mouse-to-mouse basis by MRI), and endpoint (EP; stable regression at the 26-week endpoint). (C) Waterfall plots showing percent change in tumor volume between 0–14d in a representative subset of animals from Fig. 1D (BLZ945 n=71; vehicle n=4). (D) Kaplan-Meier of BLZ945-treated (n=90) versus vehicle-treated (n=30) mice bearing high-grade PDG tumors (Log-rank Mantel-Cox test, P<5×10⁻¹⁷). Median survival for vehicle-treated animals was 15d post-treatment initiation, while median survival for BLZ945-treated animals was 93d. (E) Representative MRI images over time of one mouse with a rebounded tumor (top row), and another mouse that had stable disease until EP (bottom row).
Figure 2
Figure 2. Combined CSF-1R and PI3K inhibition improves survival in the PDG model
(A) Gene set variation analysis based on RNA-seq from FACS-purified EP and Reb tumor cells (PDGFRα+; see fig. S3B). Blue circles indicate gene sets significantly enriched in Reb tumor cells, while purple circles identify those enriched in EP tumor cells. The PI3K gene set is indicated with an arrow. Vertical lines indicate fold cutoff for significance (n=5–6 samples per group). (B) Immunoblot from snap-frozen Veh, EP and Reb tumors demonstrating elevated phospho (p)-AKT in Reb tumors compared to Veh and EP (n=3 experiments, one representative blot is shown). (C) Long-term trial design for evaluating BLZ945 and BKM120 combination therapy on PDG tumors. High-grade tumors were treated with BLZ945 until recurrent tumors developed (trial design 1) or until dormancy (28d, trial design 2), whereupon BKM120 was either added (with continuous BLZ945 treatment) or switched (discontinued BLZ945). (D) Survival of animals with recurrent tumors treated either with BLZ945 alone (n=33), BKM120 alone (n=9), or BLZ945 in combination with BKM120 (n=16; trial design 1 in Fig. 2C). Combination of BLZ945+BKM120 led to an increase in overall survival (Log-rank Mantel-Cox test, P<0.0001), and in median survival (51d) following recurrence compared to BLZ945 (13d) or BKM120 (10d) monotherapy. (E) Survival of animals with 28d dormant tumors treated either with BLZ945 alone (n=90; same cohort as presented in Fig. 1D), BKM120 alone (n=9), or BLZ945 in combination with BKM120 (n=11; trial design 2 in Fig. 2C). Combination of BLZ945+BKM120 led to increased overall survival compared to either monotherapy. Log-rank Mantel-Cox test was used to calculate significance. (F) Average percent change in tumor volume (0–14d) between vehicle- or BLZ945-treated tumors, in 3 different RCAS-PDGFB-HA Nestin-Tv-a GBM models (termed PDG, p53 knockdown (KD), and Pten knockout (KO) here; see methods). BLZ945 efficacy in the p53 KD model (BLZ945 n=8 mice; vehicle n=6 mice) was comparable to the PDG model (BLZ945 n=71 mice; vehicle n=4 mice) after 2 weeks (56% and 62% volume reduction, respectively); however, BLZ945 efficacy was less pronounced in the Pten KO model (n=5 mice per treatment group; 3% volume reduction). (G) Average percent change in tumor volume (0–28d) between vehicle- or BLZ945-treated Pten KO tumors (n=5 mice per group). BLZ945 caused 11% volume reduction after 4 weeks. Data were analyzed by Student’s t-test unless indicated otherwise.
Figure 3
Figure 3. Resistance to CSF-1R inhibition is mediated by the microenvironment and rebound TAMs are alternatively activated
(A) Quantification of bioluminescent imaging (BLI) from intracranially transplanted 52Reb cells into naïve mice. Results show that 52Reb cells, isolated from a recurrent PDG tumor that developed resistance to BLZ945 treatment in vivo, reestablish sensitivity to BLZ945 in the naïve setting (Student’s t-test d15, P<0.05, n=10 mice). Representative BLI images at d15 are shown. (B) Left: H&E of a rebound tumor (T) adjacent to glial scarring (S). Scale bar = 500 μm. Right: Representative regions of calcification (top), reactive astrocytic barrier (middle), and recurrent tumor (bottom). Scale bars = 50 μm. (C) H&E, Von Kossa and GFAP staining on rebound tissue. Scale bars = 200 μm, except GFAP 20× = 50 μm as indicated. (D) Allred score for the astrocyte marker GFAP, showing a higher intensity and proportion of GFAP+ staining in Reb tissues (n=8 mice) compared to other treatment groups (n=5 mice per group). (E) Flow cytometry of TAMs (CD45+CD11b+Gr1) in Veh, 28d, EP and Reb tumors (n=5–7). Data were analyzed by a one-way ANOVA and Tukey’s multiple comparisons test. (F) Heatmap showing RNA-seq expression changes of M2-like associated genes in Veh, EP and Reb TAMs (n=5–6 per group). Wound-associated genes are indicated in bold with asterisks.
Figure 4
Figure 4. IL4 activates wound-associated genes in rebound TAMs and is produced by T cells in the rebound tumor microenvironment
(A) Spectrum model of macrophage activation using gene set enrichment analysis (GSEA) of transcriptional programs regulated by the indicated cytokines (see methods). Reb TAMs exhibit activation of programs driven by TGFβ1 and IL4 compared to Veh TAMs (n=5 per group). The -log10 (P-value) is plotted for each gene set (0, 4, 8, 12, and >16 radially outward in grey concentric circles). The black line indicates a -log10 (P-value) cutoff of 3. (B) GSEA as in (A), confirming that Reb TAMs exhibit activation of programs driven by IL4 and TGFβ1 compared to EP TAMs (n=5–6 per group). Dotted line demarcates P<0.05. (C) qRT-PCR analysis demonstrates that IL4 induces expression of the wound-associated genes Retnla, Chil3 and Ccl17 in bone marrow-derived macrophages (BMDMs) in culture, while recombinant TGFβ1 treatment does not. Bone marrow isolate was obtained from 5 or more independent WT mice for replicate experiments. (D) qRT-PCR analysis of Il4 expression in snap frozen whole-tumor samples from Veh, EP or Reb treatment groups, demonstrating elevated expression in the Reb setting (n=4 tumors) compared to both Veh (n=4 tumors) and EP (n=4 tumors). (E) Flow cytometry of total CD3+ T cells (n=5–10) and (F) CD3+ CD8+ cytotoxic T cells (n=5–10) in Veh, EP and Reb tumors. (G) RNA-seq data from a panel of cell types (GFAP+ astrocytes, CD19+ B cells, CD3+ CD8+ cytotoxic T cells (Tc), and remaining CD3+ CD8- bulk T cells) isolated from rebound tumors by FACS (n=3,). Results show elevated Il4 expression in bulk T and Tc cells, and Il13 expression in bulk T cells. Significance values for C-F were calculated by one-way ANOVA and Tukey’s multiple comparisons test.
Figure 5
Figure 5. The IGF-1/IGF-1R axis is induced in rebound gliomas
(A) Volcano plot showing the fold change (log2(fold)) between Reb (n=5) and EP (n=6) TAMs on the x-axis and the significance (−log10(P-value)) on the y-axis. Blue dots indicate genes upregulated in Reb TAMs, while purple dots indicate genes downregulated in Reb TAMs. Igf1 is labeled in the upper right quadrant. (B) RNA-seq barplot depicting Igf1 transcripts per million (TPM) in Veh, EP and Reb TAMs (n=5–6 per group; one-way ANOVA and Tukey’s multiple comparisons). (C) RNA-seq barplot depicting Igf1r TPM in Veh, EP and Reb tumor cells (n=5–6 per group; one-way ANOVA and Tukey’s multiple comparisons). (D) Quantification of immunofluorescent staining of phospho (p)-IGF-1R in Veh, 28d, EP and Reb tumor tissues. Results show pIGF-1R is elevated in rebound tumors compared to all other groups (n=5–8 per group; one-way ANOVA and Dunnett’s multiple comparisons to Reb). (E) MTT assay demonstrating higher sensitivity of an early-passage primary rebound PDG cell line (74Reb, blue) to IGF-1R inhibition with OSI906 compared to a primary treatment-naïve PDG cell line (PDGC23, grey) (n=3, one representative experiment shown). IC50 values are indicated with arrows. (F) MTT proliferation assays of 74Reb cells (left) compared to PDGC23 cells (right), treated with conditioned media (CM) from BMDMs that were stimulated with rebound glioma microenvironment culture CM (see fig. S8, I and J for details). Stimulated BMDM CM (Stim CM) induced growth of 74Reb cells more than PDGC23 cells (130% versus 58%, respectively), and this effect was blocked with an anti-IGF-1 neutralizing antibody (n=4 replicate experiments). A one-way ANOVA and Dunnett’s multiple comparisons to Stim CM + PBS was used to calculate differences at 5d (P<0.0001 for all). (G) Correlation between IGF1 and CSF1R or MRC1 expression from TCGA-GBM data. (H) Single sample GSEA for a hallmark PI3K signature was used to assign a pathway activity score (see methods) across patients from the TCGA-GBM dataset. PI3K signature scores were then correlated with IGF1 expression levels as shown. (I) Linear regression analysis of immunohistochemical staining for phospho (p)-AKT and MRC1 in serial sections from GBM patient tissue (n=18 patients). A significant correlation between MRC1 protein levels and AKT signaling was observed. For correlational analyses (G-I), a Spearman coefficient was used to assess significance, and a line of best fit is shown (red hatched). The 95% confidence band (black hatched) is also shown in (I).
Figure 6
Figure 6. NFAT and Stat6 cooperate to regulate Igf1 expression in rebound TAMs
(A) Transcription factor (TF) network analysis from RNA-seq data showing enriched TF families (squares) connected with a line to target genes (circles). White circles indicate genes targeted by multiple TFs. Igf1 is shown as a blue circle connected by red lines to three regulating TF families. (B) Predicted NFAT TF activity in Veh, EP and Reb TAMs, showing a high score specifically in Reb TAMs (n=5–6 per group). (C) qRT-PCR analysis of Igf1 in BMDMs derived from WT, Stat6−/− or Il4ra flox; LysM-cre mice, treated +/− recombinant mouse IL4 (10 ng/ml; n=5 independent experiments). Student’s t-test was used for pairwise comparisons within each genotype. (D) qRT-PCR analysis of Igf1 in BMDMs derived from WT mice, treated +/− recombinant mouse IL4 (10 ng/ml), a Stat6 inhibitor (AS1517499, 50 nM) and/or an NFAT inhibitor (INCA-6, 40 μM; n=6 independent experiments). A one-way ANOVA and Dunnett’s multiple comparisons to the +IL4 condition was used to calculate significance. (E) Survival of PDG animals with high-grade tumors treated first with BLZ945 alone until dormancy (28d), and then enrolled on combination therapy with either AS1517499 (n=10), FK506 (NFAT inhibitor; n=17), or EtOH vehicle control (n=9). Combination therapy with either inhibitor led to a significant increase in overall survival (FK506= 82% survival P<0.0001; AS1517499= 50% survival P<0.05), compared to vehicle control (22% survival). Log-rank Mantel-Cox test was used to calculate significance. (F) Survival curve representing animals with recurrent tumors treated either with continuous BLZ945 alone (n=33) or BLZ945+AS1517499 (n=9). Combination therapy led to a significant increase in overall survival (Log-rank Mantel-Cox test, P<0.05), and in median survival following recurrence (45d) compared to BLZ945 monotherapy (13d). (G) qRT-PCR analysis of Igf1, CD36, Arg1 and Mrc1 levels in a subset of animals from (F). Results show a significant reduction of Igf1 expression in rebound tumors following Stat6 inhibition (n=5 per group, P<0.01), and a reduction of known IL4-Stat6 transcriptional targets (CD36 Pπ.05 Arg1 P<0.05; Mrc1 P<0.01), confirming drug efficacy in the brain (n=5 for all, Mann-Whitney test).
Figure 7
Figure 7. Combination of CSF-1R inhibition and IGF-1R inhibition significantly improves outcome in preclinical models
(A) Long-term trial design for testing BLZ945 and OSI906 combination therapy on PDG tumors. High-grade tumors were treated with BLZ945 until recurrent tumors developed (trial design 1) or until dormancy (28d, trial design 2), whereupon OSI906 was either added (with continuous BLZ945) or switched (discontinued BLZ945). (B) Survival of animals with recurrent tumors treated either with BLZ945 alone (n=33), OSI906 alone (n=13), or BLZ945 in combination with OSI906 (n=13; trial design 1 in Fig. 7A). Combination therapy of BLZ945+OSI906 led to an increase in overall survival (Log-rank Mantel-Cox test, P<0.001), and in median survival following recurrence (63d) compared to BLZ945 (13d), or OSI906 (12d) monotherapy. (C) Ki67:CC3 (cleaved caspase 3) proliferation:apoptosis index from immunofluorescent staining of recurrent tumors treated with BLZ945 alone versus BLZ945+OSI906 for 2 weeks (Mann-Whitney test, P<0.01, n=7–8 mice). (D) Representative H&E and immunofluorescent images corresponding to data in (C). Scale bars = 50 μm. (E) Bioluminescent imaging (BLI) from orthotopically xenografted patient-derived tumorspheres (TS573) that were subject to 24d of treatment with BLZ945 (red) versus vehicle control (grey). Results demonstrate that treatment with BLZ945+OSI906 blunts outgrowth of rebound tumors compared to BLZ945+vehicle. Mann-Whitney test was used to calculate P-values for each time point (n=5–20 mice). (F) Ki67:CC3 index from immunofluorescent staining of TS573 orthotopic xenograft tissues (Mann-Whitney test, P<0.01, n=5 mice per group). (G) Kaplan-Meier analysis of PDG animals treated either with BLZ945 alone (n=90; same cohort as presented in Fig. 1D), OSI906 alone (n=6) or with BLZ945 in combination with OSI906 during dormancy (n=9; trial design 2 in Fig. 7A). Combination therapy of BLZ945+OSI906 extended overall survival compared to either monotherapy. Log-rank Mantel-Cox test was used to calculate significance. (H) BLI of orthotopically xenografted U251 cells genetically engineered to express an IGF1R-targeted doxycycline (dox)-inducible shRNA (sh; n=15–16 mice; purple lines) or a scrambled control vector (Scr; n=4–5 mice; grey lines). Colored arrows indicate respective administration of dox. Graph shows two combined shRNAs; data for individual hairpins are shown in fig. S13E. Mann-Whitney test was used to calculate significance.
Figure 8
Figure 8. Working model for mechanism of resistance to CSF-1R inhibition in glioma
IGF-1 is significantly upregulated in TAMs in response to long-term CSF-1R inhibition in GBM. IGF-1 secretion into the extracellular environment results in activation of IGF-1R on tumor cells, and downstream PI3K signaling to support tumor regrowth during continuous BLZ945 treatment. Upstream of IGF-1 in TAMs, NFAT and/or Stat6 transcriptional activity regulate its expression. This is thought to be initiated in response to IL4/IL4Ra pathway activation, feeding in from other cell types in the TME, including T cells (and possibly others). Multiple nodes in this signaling loop can be targeted therapeutically, including OSI906, BKM120, AS1517499, or FK506, resulting in a substantial improvement in survival in preclinical trials when combined with CSF-1R inhibition.

Comment in

  • The Taming of the TAMs.
    Seoane J. Seoane J. Trends Cell Biol. 2016 Aug;26(8):562-563. doi: 10.1016/j.tcb.2016.06.007. Epub 2016 Jul 6. Trends Cell Biol. 2016. PMID: 27394965

References

    1. Quail DF, Joyce JA. Microenvironmental regulation of tumor progression and metastasis. Nat Med. 2013;19:1423–1437. - PMC - PubMed
    1. Junttila MR, de Sauvage FJ. Influence of tumour micro-environment heterogeneity on therapeutic response. Nature. 2013;501:346–354. - PubMed
    1. Stupp R, Mason WP, van den Bent MJ, Weller M, Fisher B, Taphoorn MJ, Belanger K, Brandes AA, Marosi C, Bogdahn U, Curschmann J, Janzer RC, Ludwin SK, Gorlia T, Allgeier A, Lacombe D, Cairncross JG, Eisenhauer E, Mirimanoff RO, R. European Organisation for, T. Treatment of Cancer Brain, G. Radiotherapy, G. National Cancer Institute of Canada Clinical Trials Radiotherapy plus concomitant and adjuvant temozolomide for glioblastoma. N Engl J Med. 2005;352:987–996. - PubMed
    1. Komohara Y, Ohnishi K, Kuratsu J, Takeya M. Possible involvement of the M2 anti-inflammatory macrophage phenotype in growth of human gliomas. J Pathol. 2008;216:15–24. - PubMed
    1. Bingle L, Brown NJ, Lewis CE. The role of tumour-associated macrophages in tumour progression: implications for new anticancer therapies. J Pathol. 2002;196:254–265. - PubMed

Publication types

MeSH terms

Substances