. 2016 Feb 27:9788:97880P.
doi: 10.1117/12.2216096. Epub 2016 Mar 29.

Voxel Based Morphometry in Optical Coherence Tomography: Validation & Core Findings

Affiliations

Voxel Based Morphometry in Optical Coherence Tomography: Validation & Core Findings

Bhavna J Antony et al. Proc SPIE Int Soc Opt Eng. .

Abstract

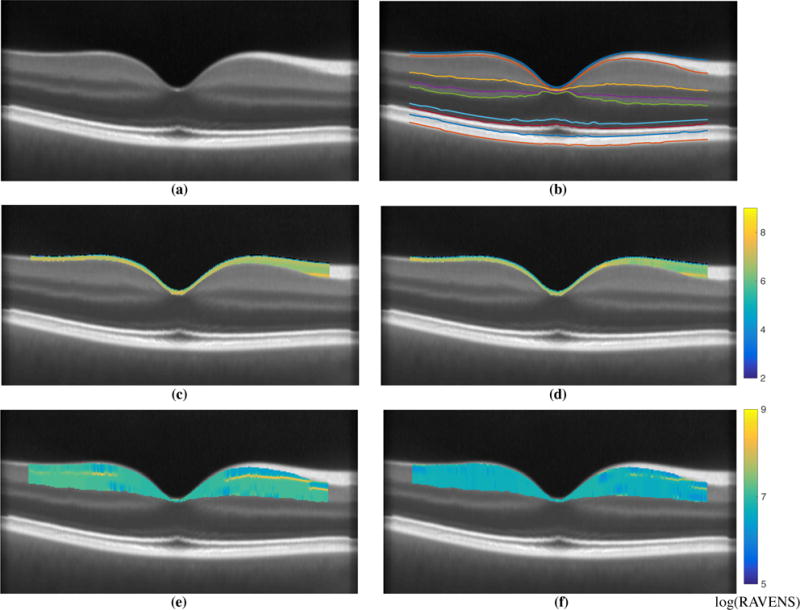
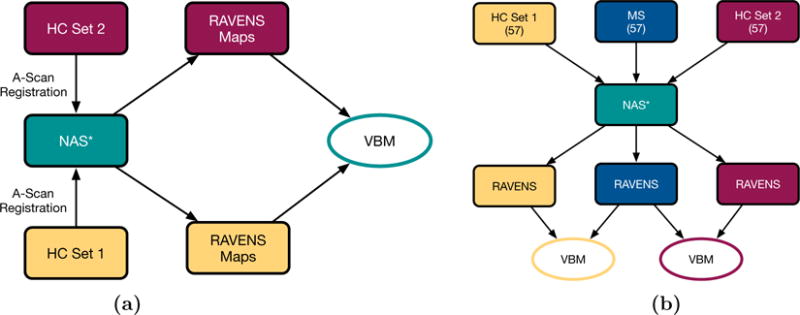
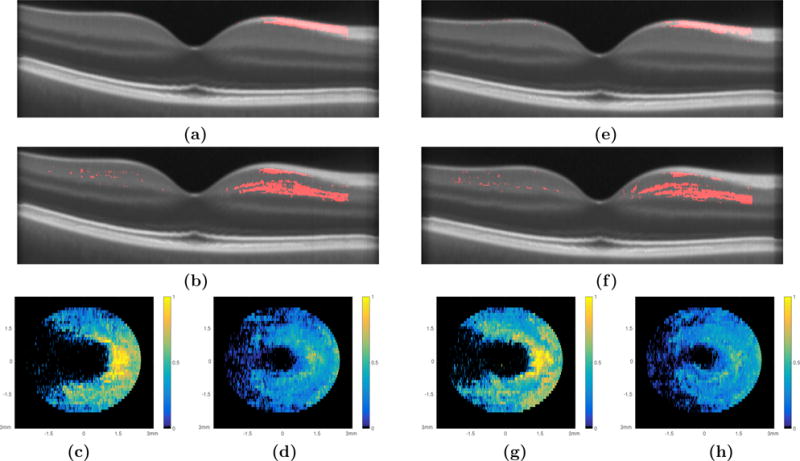
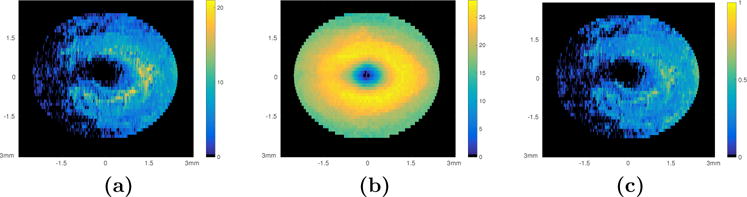
Optical coherence tomography (OCT) of the human retina is now becoming established as an important modality for the detection and tracking of various ocular diseases. Voxel based morphometry (VBM) is a long standing neuroimaging analysis technique that allows for the exploration of the regional differences in the brain. There has been limited work done in developing registration based methods for OCT, which has hampered the advancement of VBM analyses in OCT based population studies. Following on from our recent development of an OCT registration method, we explore the potential benefits of VBM analysis in cohorts of healthy controls (HCs) and multiple sclerosis (MS) patients. Specifically, we validate the stability of VBM analysis in two pools of HCs showing no significant difference between the two populations. Additionally, we also present a retrospective study of age and sex matched HCs and relapsing remitting MS patients, demonstrating results consistent with the reported literature while providing insight into the retinal changes associated with this MS subtype.

Keywords: RAVENS; multiple sclerosis; normalized atlas; optical coherence tomography; registration; retina; voxel-based morphometry.


Figures

Figure 1
Figure 1
Shown in (a) is central B-scan from NAS I and (b) the overlaid corresponding automated segmentation used to extract the relevant layers. Example RAVENS maps of the extracted RNFL are shown for a (c) a HC, and (d) a RRMS subject scan. For the same two subjects we also show the GCIP RAVENS map in (e) the HC, and (f) the RRMS subject. Note the differing RAVENS scale for the two layers. The segmented surfaces and the RAVENS maps are only depicted within a 5mm circular region centered on the fovea.
Figure 2
Figure 2
Flowcharts depicting (a) the validation experiment where the two age- and sex-matched HC sets were compared to each other, and (b) the comparison of the two HC sets and the MS cohort. The * denotes that the experiment was conducted twice, once using NAS I and once using NAS II.
Figure 3
Figure 3
The comparison of HC Set I and the RRMS set are summarized with central B-scans depicting the significant voxels as detected through VBM analysis of (a) the RNFL and (b) the GCIP and the density maps of the (c) RNFL and (d) GCIP, respectively. An example of the density map computation can be seen in Fig. 4. The comparison of HC Set II and the RRMS set; central B-scans depicting the significant voxels as detected through VBM analysis of (e) the RNFL and (f) the GCIP and the density maps of the (g) RNFL and (h) GCIP, respectively.
Figure 4
Figure 4
Density map generation. (a) The sum of the significant voxels in each A-scan location within the GCIP layer, (b) the thickness of the GCIP layer (in voxels) created using the layer segmentation of the NAS II, and (c) the density map created by normalizing the sum of the significant voxels by the thickness of the layer.
Figure 5
Figure 5
The multivariate regression comparison of the HC Set I and the RRMS cohort while controlling for age and sex are summarized with central B-scans depicting the significant voxels within (a) the RNFL and (b) the GCIP and the density maps of the (c) RNFL and (d) GCIP, respectively. Similar analysis of HC Set II and the RRMS set; central B-scans depicting the significant voxels as detected through VBM analysis of (e) the RNFL and (f) the GCIP and the density maps of the (g) RNFL and (h) GCIP, respectively.

Similar articles

Cited by

References

    1. Saidha S, Sotirchos ES, Oh J, Syc SB, Seigo MA, Shiee N, Eckstein C, Durbin MK, Oakley JD, Meyer SA, Frohman TC, Newsome S, Ratchford JN, Balcer LJ, Pham DL, Crainiceanu CM, Frohman EM, Reich DS, Calabresi PA. Relationships between retinal axonal and neuronal measures and global central nervous system pathology in multiple sclerosis. JAMA Neurol. 2013;70(1):34–43. - PMC - PubMed
    1. Ratchford JN, Saidha S, Sotirchos ES, Oh JA, Seigo MA, Eckstein C, Durbin MK, Oakley JD, Meyer SA, Conger A, Frohman TC, Newsome SD, Balcer LJ, Frohman EM, Calabresi PA. Active MS is associated with accelerated retinal ganglion cell/inner plexiform layer thinning. Neurology. 2013;80(1):47–54. - PMC - PubMed
    1. Antony BJ, Song Q, Abràmoff MD, Sohn EH, Wu X, Garvin MK. Incorporation of learned shape priors into a graph-theoretic approach with application to the 3D segmentation of intraretinal surfaces in SD-OCT volumes of mice. Proc SPIE 2014 Med Imaging Biomed Appl Mol Struct Funct Imaging. 2014;9038:90380D.
    1. Antony BJ, Abràmoff MD, Harper MM, Jeong W, Sohn EH, Kwon YH, Kardon R, Garvin MK. A combined machine-learning and graph-based framework for the segmentation of retinal surfaces in SD-OCT volumes. Biomed Opt Express. 2013 Dec;4:2712–2728. - PMC - PubMed
    1. Song Q, Bai J, Garvin MK, Sonka M, Buatti JM, Wu X. Optimal multiple surface segmentation with shape and context priors. IEEE Trans Med Imag. 2013 Feb;32:376–86. - PMC - PubMed

LinkOut - more resources