

Clarifying CLARITY: Quantitative Optimization of the Diffusion Based Delipidation Protocol for Genetically Labeled Tissue
- PMID: 27199642
- PMCID: PMC4847491
- DOI: 10.3389/fnins.2016.00179
Clarifying CLARITY: Quantitative Optimization of the Diffusion Based Delipidation Protocol for Genetically Labeled Tissue
Abstract
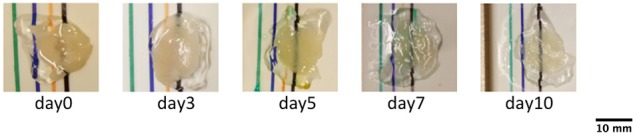
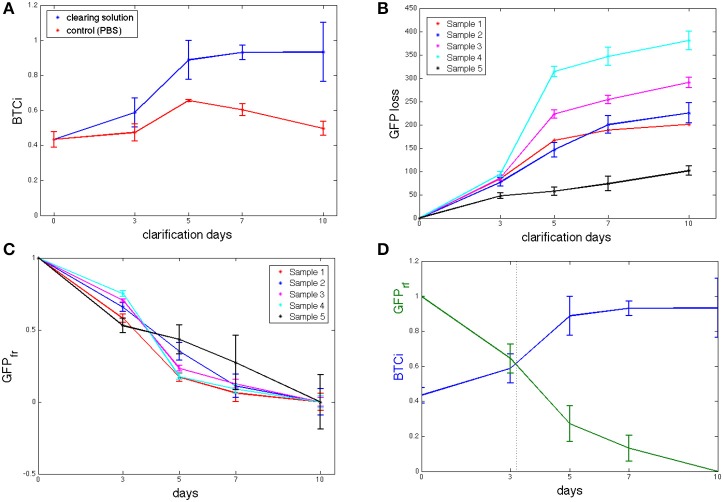
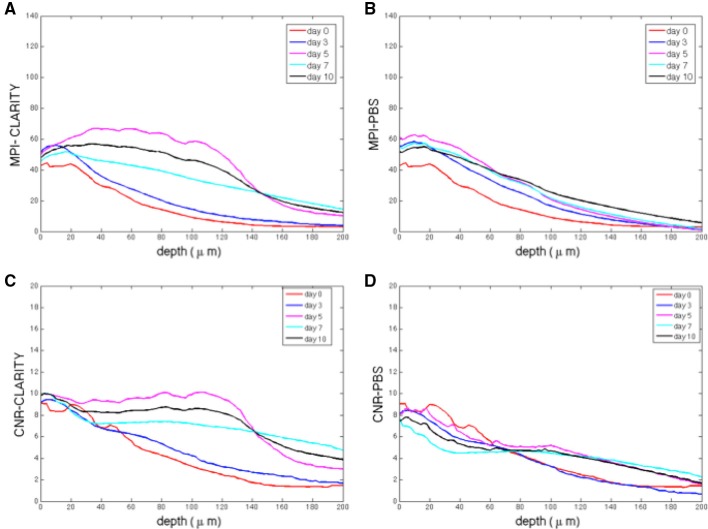
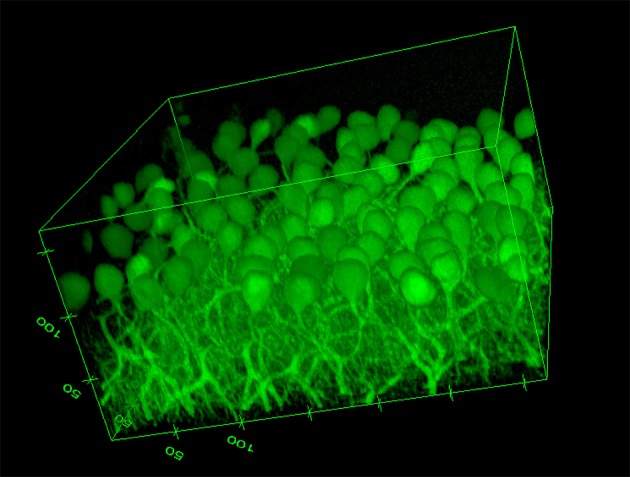
Tissue clarification has been recently proposed to allow deep tissue imaging without light scattering. The clarification parameters are somewhat arbitrary and dependent on tissue type, source and dimension: every laboratory has its own protocol, but a quantitative approach to determine the optimum clearing time is still lacking. Since the use of transgenic mouse lines that express fluorescent proteins to visualize specific cell populations is widespread, a quantitative approach to determine the optimum clearing time for genetically labeled neurons from thick murine brain slices using CLARITY2 is described. In particular, as the main objective of the delipidation treatment is to clarify tissues, while limiting loss of fluorescent signal, the "goodness" of clarification was evaluated by considering the bulk tissue clarification index (BTCi) and the fraction of the fluorescent marker retained in the slice as easily quantifiable macroscale parameters. Here we describe the approach, illustrating an example of how it can be used to determine the optimum clearing time for 1 mm-thick cerebellar slice from transgenic L7GFP mice, in which Purkinje neurons express the GFP (green fluorescent protein) tag. To validate the method, we evaluated confocal stacks of our samples using standard image processing indices (i.e., the mean pixel intensity of neurons and the contrast-to-noise ratio) as figures of merit for image quality. The results show that detergent-based delipidation for more than 5 days does not increase tissue clarity but the fraction of GFP in the tissue continues to diminish. The optimum clearing time for 1 mm-thick slices was thus identified as 5 days, which is the best compromise between the increase in light penetration depth due to removal of lipids and a decrease in fluorescent signal as a consequence of protein loss: further clearing does not improve tissue transparency, but only leads to more protein removal or degradation. The rigorous quantitative approach described can be generalized to any clarification method to identify the moment when the clearing process should be terminated to avoid useless protein loss.
Keywords: CLARITY; GFP; image processing; mouse brain slices; quantitative protocol optimization.
Figures
Similar articles
-
Comparison of different tissue clearing methods and 3D imaging techniques for visualization of GFP-expressing mouse embryos and embryonic hearts.Histochem Cell Biol. 2016 Aug;146(2):141-52. doi: 10.1007/s00418-016-1441-8. Epub 2016 May 4. Histochem Cell Biol. 2016. PMID: 27145961
-
Immunostaining of Whole-Mount Retinas with the CLARITY Tissue Clearing Method.J Vis Exp. 2021 Mar 6;(169). doi: 10.3791/62178. J Vis Exp. 2021. PMID: 33749674
-
A rapid approach to high-resolution fluorescence imaging in semi-thick brain slices.J Vis Exp. 2011 Jul 26;(53):2807. doi: 10.3791/2807. J Vis Exp. 2011. PMID: 21841756 Free PMC article.
-
Advances in CLARITY-based tissue clearing and imaging.Exp Ther Med. 2018 Sep;16(3):1567-1576. doi: 10.3892/etm.2018.6374. Epub 2018 Jun 29. Exp Ther Med. 2018. PMID: 30186373 Free PMC article. Review.
-
Navigating across multi-dimensional space of tissue clearing parameters.Methods Appl Fluoresc. 2021 Mar 11;9(2):022001. doi: 10.1088/2050-6120/abe6fb. Methods Appl Fluoresc. 2021. PMID: 33592593 Review.
Cited by
-
Quantitative validation of immunofluorescence and lectin staining using reduced CLARITY acrylamide formulations.Brain Struct Funct. 2018 Mar;223(2):987-999. doi: 10.1007/s00429-017-1583-z. Epub 2017 Dec 14. Brain Struct Funct. 2018. PMID: 29243106 Free PMC article.
-
Tutorial: practical considerations for tissue clearing and imaging.Nat Protoc. 2021 Jun;16(6):2732-2748. doi: 10.1038/s41596-021-00502-8. Epub 2021 May 21. Nat Protoc. 2021. PMID: 34021294 Free PMC article. Review.
-
Hydrogel-Tissue Chemistry: Principles and Applications.Annu Rev Biophys. 2018 May 20;47:355-376. doi: 10.1146/annurev-biophys-070317-032905. Annu Rev Biophys. 2018. PMID: 29792820 Free PMC article. Review.
-
Optimization of GFP Fluorescence Preservation by a Modified uDISCO Clearing Protocol.Front Neuroanat. 2018 Aug 15;12:67. doi: 10.3389/fnana.2018.00067. eCollection 2018. Front Neuroanat. 2018. PMID: 30158858 Free PMC article.
-
Optical clearing potential of immersion-based agents applied to thick mouse brain sections.PLoS One. 2019 May 10;14(5):e0216064. doi: 10.1371/journal.pone.0216064. eCollection 2019. PLoS One. 2019. PMID: 31075111 Free PMC article.
References
LinkOut - more resources
Full Text Sources
Other Literature Sources