. 2016 Apr 25:10:35.
doi: 10.3389/fnsys.2016.00035. eCollection 2016.

More Gamma More Predictions: Gamma-Synchronization as a Key Mechanism for Efficient Integration of Classical Receptive Field Inputs with Surround Predictions

Affiliations

More Gamma More Predictions: Gamma-Synchronization as a Key Mechanism for Efficient Integration of Classical Receptive Field Inputs with Surround Predictions

Martin Vinck et al. Front Syst Neurosci. .

Abstract

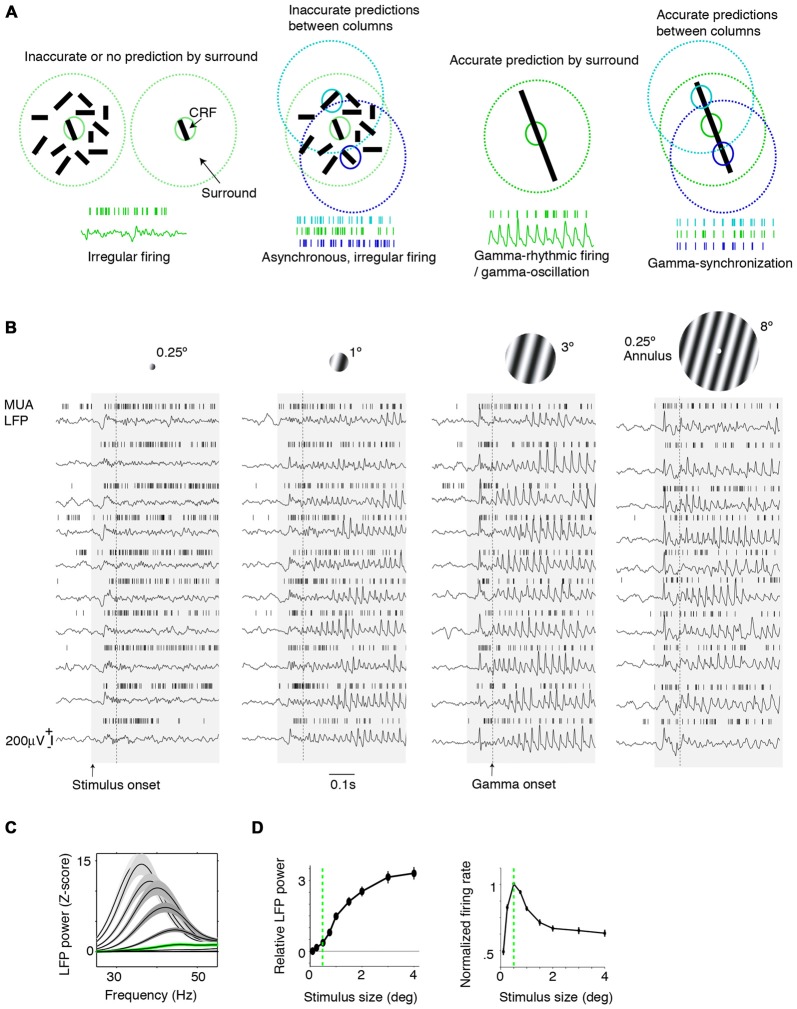
During visual stimulation, neurons in visual cortex often exhibit rhythmic and synchronous firing in the gamma-frequency (30-90 Hz) band. Whether this phenomenon plays a functional role during visual processing is not fully clear and remains heavily debated. In this article, we explore the function of gamma-synchronization in the context of predictive and efficient coding theories. These theories hold that sensory neurons utilize the statistical regularities in the natural world in order to improve the efficiency of the neural code, and to optimize the inference of the stimulus causes of the sensory data. In visual cortex, this relies on the integration of classical receptive field (CRF) data with predictions from the surround. Here we outline two main hypotheses about gamma-synchronization in visual cortex. First, we hypothesize that the precision of gamma-synchronization reflects the extent to which CRF data can be accurately predicted by the surround. Second, we hypothesize that different cortical columns synchronize to the extent that they accurately predict each other's CRF visual input. We argue that these two hypotheses can account for a large number of empirical observations made on the stimulus dependencies of gamma-synchronization. Furthermore, we show that they are consistent with the known laminar dependencies of gamma-synchronization and the spatial profile of intercolumnar gamma-synchronization, as well as the dependence of gamma-synchronization on experience and development. Based on our two main hypotheses, we outline two additional hypotheses. First, we hypothesize that the precision of gamma-synchronization shows, in general, a negative dependence on RF size. In support, we review evidence showing that gamma-synchronization decreases in strength along the visual hierarchy, and tends to be more prominent in species with small V1 RFs. Second, we hypothesize that gamma-synchronized network dynamics facilitate the emergence of spiking output that is particularly information-rich and sparse.

Keywords: V1; communication through coherence; efficient coding; gamma oscilations; gamma synchrony; laminar organization; predictive coding; surround suppression.


Figures

Figure 1
Figure 1
Dependence of gamma-synchronization on stimuli properties. (A) Schematic overview of Principles 1 and 2 (see “Introduction” and “The Relationship Between Gamma-Synchronization and Geometry” Sections). Gamma-synchronization emerges when there is a predictive relationship between surround and classical receptive field (CRF) data. Neurons fire irregularly when the CRF content is not accurately predicted by the surround (Principle 1). Different columns gamma-synchronize if they predict each other’s visual input accurately, but fire asynchronously otherwise (Principle 2). See Chen et al. (2014) for the lack of gamma-synchronization with an array of randomly oriented lines. (B) Gieselmann and Thiele (2008) performed V1 recordings from awake monkeys which were passively viewing stationary gratings. Shown are multiple trials with LFP and multi-unit traces recorded from the same electrode. Gray shading indicates stimulus onset. Strong gamma-synchronization is observed for gratings larger than the CRF, but gamma-synchronization is not detected for a small stimulus. For large gratings, spikes exhibit phase locking to LFP. Dashed line indicates approximate onset of first induced gamma peaks/troughs around 100 ms. Surround suppression already occurs before the onset of gamma (Xing et al., ; Gieselmann and Thiele, 2008). In the 0.15–0.5 s period, firing variability is high for the small 0.25° stimulus (Fano Factor 3.18) while it is low for the large 3° stimulus (Fano Factor 0.81). Right: monkeys viewed a large grating stimulus of 8° with a small modification of CRF structure (annulus mask) that diminishes the accuracy of surround predictions. This stimulus is accompanied by reduced gamma-synchronization compared to the case of a large coherent grating. For this annulus stimulus, the average reduction in 20–100 Hz gamma-power is about 50% compared to the case of a 4° grating, such that gamma-synchronization is at the same level as a grating of about 1.25° (Gieselmann and Thiele, 2008). Assuming that the annulus is precisely centered around the recorded neuron’s CRF, it should cover an area of about 25% of the CRF. If the annulus is not precisely centered around the recorded neuron’s CRF, it will cover a smaller area. (C) Average z-scored LFP power spectra relative to baseline. In green, the curve for the median CRF size (0.5°). (D) Change in gamma power (20–100 Hz; left) and firing rate (right) with size. (B–D) Adapted from Gieselmann and Thiele (2008).
Figure 2
Figure 2
Gamma-synchronization for natural images and noise stimuli. (A) An image can be decomposed into the amplitude and the phase spectrum. Shown on the left is an image in which amplitude information is preserved, but where the phase spectrum is randomized. Shown on the right is an image in which phase information is preserved, but where the amplitude spectrum is whitened. The phase spectrum contains most of the meaningful image information, while the amplitude spectrum is insufficient to perform object recognition. The phase spectrum determines higher-order image correlations, like the kurtosis (4th order correlation). (B) V1 gamma-synchronization is reliably induced when monkeys are freely viewing natural images. LFP signals were recorded using a subdural ECoG grid and referenced bipolarly. Red and blue lines show change in LFP power spectra (as % increase) for the two monkeys separately. Narrow-band V1 gamma-synchronization was found for all 64 presented images. Adapted from Brunet et al. (2013). (C) Recordings from superficial layers of V1 in anesthetized cats. Visual stimuli were drifting gratings in a circular aperture of 8° diameter. Spatial noise was added to gratings by swapping randomly chosen pairs of pixel areas. Shown are average cross-correlograms across all synchronized cell pairs. Gamma-synchronization decreases with noise magnitude. Adapted from Zhou et al., . (D) V1 recordings from superficial layers in anesthetized monkeys. Gamma LFP power (black) shows incremental decrease as a function of noise amplitude, while firing rates (FR; red) do not show a change. Adapted from Jia et al. (2013b).
Figure 3
Figure 3
Dependence of gamma on the motion of stimuli. (A) V1 MUA and LFP recordings in anesthetized cats. Gamma-rhythmicity is reliably induced by a drifting grating with continuous motion. Adding random jitter to motion gradually disrupts gamma-synchronization. Adapted from Kruse and Eckhorn (1996). (B) V1 recordings from awake cats. Gamma-synchrony is induced when natural images or gratings have regular motion, but not when they have irregular motion. The irregular motion in this case was derived from a natural movie made from a camera mounted on a cat’s head. Adapted from Kayser et al. (2003). (C) V1 recordings from superficial layers in awake monkeys. Presentation of a large drifting grating (>8°) induces reliable gamma-synchronization between spiking responses recorded from different electrodes. The addition of a second grating component to a drifting grating (i.e., a plaid stimulus) reduces V1 gamma-synchronization as compared to the case of a single-component grating. Adapted from Lima et al. (2010). (D) V1 ECoG recordings from awake monkeys. Monkeys were freely viewing natural images. Shown is the average V1 LFP power spectrum around the saccade, as a function of time (s). Time t = 0 was defined as the moment of peak saccade velocity. Saccades temporarily disrupt gamma-synchronization. Adapted from Brunet et al. (2013).
Figure 4
Figure 4
Dependence of intercolumnar gamma-synchronization on stimulus properties. (A) Predicted pattern of gamma-synchronization for example stimulus. Zebra has image regions with regular texture (similar to a grating) that should induce V1 gamma-synchronization when viewed from appropriate distance. Discontinuities in texture do however occur, in which case Principle 2 predicts that multiple, incoherent gamma rhythms emerge for the zebra fur. Dashed green and dashed red connecting lines indicate the presence and absence of gamma-synchronization between neurons having non-overlapping CRFs, respectively. Top image is shown with filled circles in order to illustrate that the receptive field (RF) content can be predicted from the surround. (B) Schematic inspired by experiments of Gray et al. (1989) and Roelfsema et al. (2004). Green circles indicate RFs. Binding-by-synchronization (BBS) predicts gamma-synchronization between neurons responding to the same smoothly curved object (among i, ii and iii; and among iv and v), but not between neurons responding to a different object (e.g., not between iii and iv). Principle 2 predicts gamma-synchronization only between those neurons that accurately predict each other’s visual input (i.e., between ii and iii but not i and ii). This means that there is only short-range synchronization for a stimulus like the curved line, but long-range V1 gamma-synchronization for a single, long bar stimulus. (C) Long-range (7 mm) V1 gamma-synchronization in anesthetized cats induced by coherently (II) moving bars, or by one single bar (III) that stimulates the CRFs of two cells simultaneously. No gamma-synchronization is detected when the bars move in opposite directions (I). Adapted from Gray et al. (1989).
Figure 5
Figure 5
Mechanisms of gamma-synchronization: connections and lamina. (A) Schematic that illustrates various aspects of the V1 circuit. Cells receive information from the surround through lateral and extrastriate feedback projections that carry predictions and are predominantly excitatory. These projections target both excitatory and inhibitory cells in L4B and L2/3. The surround inputs are processed within the local column through recurrent excitatory and inhibitory interactions. L4B and L2/3 also receive bottom-up inputs from L4C, which does not receive substantial extrastriate feedback and lateral input. (B) Patchy pattern of axonal projections in V1 of squirrel monkey. Scale bar is 0.5 mm. Black circle corresponds to injection site. Adapted from Angelucci et al. (2002b). (C) Fraction of pairs showing synchrony for different distances and preferred orientation differences during presentation of a moving bar stimulus. Error bars show 95% confidence intervals derived from binomial distribution. Recordings were made from V1 of anesthetized cats. Adapted from Gray et al. (1989). (D) Horizontal connectivity in V1 of squirrel monkey. Scale bar is 0.5 mm. Injection site to the left (not shown). Patchy connectivity pattern is visible in L2/3 and L4B, but mostly absent in L4C and L5. Connectivity is also observed with L6. Adapted from Rockland and Lund (1983). (E) Laminar recordings from anesthetized macaque monkeys. Gamma LFP power is most prominent in L2/3 and L4B. Adapted from Xing et al. (2012). (F) Fraction of V1 cells showing gamma-rhythmic firing in > 25% of responses. The 95% confidence intervals were derived by using the binomial distribution. Recordings were made from anesthetized squirrel monkeys. Lamina were identified through post mortem histological analysis performed after each experiment (16 monkeys). V1 gamma-synchronization is most prominent in L2/3 and L4B, and weaker in L4C and L5/6. Adapted from Livingstone (1996).
Figure 6
Figure 6
Mechanisms of gamma-synchronization: surround suppression and network dynamics. (A) Different stimuli produce various degrees of surround suppression in area V1. Homogenous image patches in natural scenes are associated with more surround suppression than heterogeneous image patches. Drifting gratings are associated with more surround suppression than natural scenes. Adapted from Coen-Cagli et al. (2015). (B) Network model of gamma-synchronization between two columns that have weak excitatory projections to one another, targeting both pyramidal cells and fast spiking (FS) basket cells. For conduction delays <5 ms, the network produces intercolumnar gamma-synchronization. Adapted from Bush and Sejnowski (1996). (C) Network model of gamma-synchronization and its modulation by the MS-DS ratio. Inhibitory interneurons receive both monosynaptic and disynaptic (DS; i.e., mediated by local excitatory neurons) inputs. The MS-DS ratio governs the strength of gamma-synchronization. Adapted from Jadi and Sejnowski (2014).
Figure 7
Figure 7
Dependence of gamma-synchronization on experience and development. (A) In strabismic cats (right), tangential connections between cells responding to different eyes are strongly reduced in comparison to normal case (left). Shown is a tangential section. Green and red dots correspond to retrogradely labeled cells using either green or red beads injections. Scale bar is 1 mm. Adapted from Löwel and Singer (1992). (B) V1 gamma-synchronization between cells responding to inputs from different eyes is strongly reduced in strabismic cats in comparison to normal case. Adapted from König et al. (1993). (C) Gamma-synchronization increases with stimulus presentation, both in areas V1 and V4 of the awake monkey. Recordings were made with subdural ECoG grid. Trials were divided into eight equispaced bins. On the left, LFP traces are shown for each of the eight bins for an example recording site. On the top right shown the % change in gamma power for this example site (52–74 Hz). Right bottom shows the raw power spectrum (a.u.) for the eight bins for this example site. Adapted from Brunet et al. (2014a).
Figure 8
Figure 8
Variability in gamma-synchronization across areas and species. (A) Schematic overview of how the strength of gamma-synchronization differs across visual areas, and of the extent to which gamma propagates. L4C in area V1 provides an irregular spiking input to L2/3 in V1, which transforms this input into a gamma-rhythmic output provided that CRF content is accurately predicted by the surround. This gamma-rhythmic output can then entrain L4 in downstream visual areas, in which neurons have larger RFs. L2/3 in the next visual area can generates a gamma-rhythm that is only weakly synchronous with the gamma-rhythm in L2/3 of area V1 (see “Gamma Across the Visual Hierarchy” Section). Because of the larger RF size (see “Gamma Across the Visual Hierarchy” Section), gamma-synchronization is on average weaker in L2/3 of higher than lower visual areas. This will also cause a weaker entrainment of L4 in the next downstream visual area. (B) Spatial topography of increases in gamma LFP power for grating stimuli (left) and natural stimuli (right). Increases in LFP gamma power are stronger in area V1 and weaker in downstream visual areas. Adapted from Brunet et al. (2014a, 2013). (C) Left: spike-field locking (estimated with a metric not biased by firing rate or spike count; Vinck et al., 2012) in area V1 of the awake monkey. Adapted from Womelsdorf et al. (2012). Right: spike-field locking of L2/3 pyramidal cells in area V4 of the awake monkey. Adapted from Vinck et al. (2013a). (D) V1-V2 cross-correlations, recorded from anesthetized monkeys during presentation of drifting grating stimuli. Cross-correlograms with zero-lag peaks were mostly restricted to V1 and middle-layer V2 pairs. Adapted from Zandvakili and Kohn (2015). (E) Laminar recordings from areas V1 and V2. Colormaps show the induced LFP power as a function of frequency. Induced LFP power was defined as (S−B)/(S+B), where S and B are the LFP power during visual stimulation and baseline, respectively. Monkeys viewed static grating stimuli that had an average diameter of 5° and 72% luminance-contrast. Black lines correspond to the top 5% pairs with strongest CSD-CSD (current source density) gamma-coherence. Dashed line indicates top layer 4C in area V1 and top layer 4 in area V2. Strongest gamma-band coherence is seen between the output layer (L2/3) of V1 and the input layer (L4) of V2. Adapted from Roberts et al. (2013).
Figure 9
Figure 9
Function of V1 gamma-synchronization. (A) V1 recordings from superficial layers in anesthesized cat. Cells that show strong V1 gamma-synchronization are also sharply orientation tuned. Adapted from Folias et al. (2013). See also Womelsdorf et al. (2012) for a similar result obtained in the awake monkey. (B) Gamma spike phase code in area V1. Cells fire earlier in the gamma cycle when they are stimulated by a grating of their preferred orientation. Shown is a single unit’s average firing rate and spike phase density for eight different orientations. Adapted from Vinck et al. (2010). (C) V1 recordings were obtained from superficial layers in awake monkeys viewing a > 8° grating stimulus. The top panel shows the spike gamma phase histogram. For the bottom panel, gamma phase bins were determined such that each phase bin contained the same number of spikes. Virtual spike trains were then constructed by taking spikes only from one phase bin. Orientation tuning was then computed for each phase bin separately. The bottom panel shows that orientation tuning fluctuates gamma-rhythmically: the cell is more orientation tuned around the preferred gamma phase and less orientation tuned around the non-preferred gamma phase. Adapted from Womelsdorf et al. (2012). (D) In a network model, FS basket cells and pyramidal cells received excitatory currents. The FS basket cells provided feedforward inhibition onto the pyramidal cells. Small excitatory currents drive some spiking in FS basket cells and generate slowly decaying EPSPs (excitatory postsynaptic potentials) in pyramidal cells. Large excitatory currents give rise to strong feedback inhibition from FS basket cells, which can fire at very high rates. This gives rise to strong feedback inhibition in pyramidal cells and compresses the excitatory response in time, which can lead to a suppression of firing on average. Adapted from Bush and Sejnowski (1996). (E) Left, top: schematic illustrating functional consequences of gamma-synchronization. Top: under gamma-synchronized network dynamics, lateral, excitatory inputs are temporally convergent and escape feedback inhibition because they arrive at moments in time when GABAergic inhibition has waned off. These inputs therefore result in a strong drive, followed by strong feedback inhibition that makes the overall output sparse. The irregular inputs from L4C are therefore less effective over a large part of the gamma cycle in driving L2/3 cells, whereas the lateral inputs from L2/3 cells in other columns are more effective. Thus, gamma-synchronized network dynamics produce spiking output that is sparse, yet information-rich. Information content is further boosted through spike phase coding. Right, top: the synchronicity of the L2/3 output will, through feedforward coincidence detection, be more effective in triggering spikes in L4 cells of the next downstream area, which compensates for the loss of gain caused by the sparsification of spiking output. Left, bottom: irregular, asynchronous network dynamics are characterized by higher firing intensity in L2/3 cells, as well as inhibitory feedback that is more evenly spread in time. The lateral inputs from other columns are less effective in driving spiking, because inputs are not temporally convergent and do not arrive at a phase of weak GABAergic inhibition. Because spiking outputs are asynchronous, they are less effective in driving L4 cells of downstream areas than gamma-synchronous outputs.

Similar articles

Cited by

References

    1. Abeles M. (1982). Role of the cortical neuron: integrator or coincidence detector? Isr. J. Med. Sci. 18, 83–92. - PubMed
    1. Adesnik H., Bruns W., Taniguchi H., Huang Z. J., Scanziani M. (2012). A neural circuit for spatial summation in visual cortex. Nature 490, 226–231. 10.1038/nature11526 - DOI - PMC - PubMed
    1. Akam T. E., Kullmann D. M. (2012). Efficient “communication through coherence” requires oscillations structured to minimize interference between signals. PLoS Comput. Biol. 8:e1002760. 10.1371/journal.pcbi.1002760 - DOI - PMC - PubMed
    1. Anderson J. C., Martin K. A. (2009). The synaptic connections between cortical areas V1 and V2 in macaque monkey. J. Neurosci. 29, 11283–11293. 10.1523/JNEUROSCI.5757-08.2009 - DOI - PMC - PubMed
    1. Angelucci A., Levitt J. B., Lund J. S. (2002a). Anatomical origins of the classical receptive field and modulatory surround field of single neurons in macaque visual cortical area V1. Prog. Brain Res. 136, 373–388. 10.1016/s0079-6123(02)36031-x - DOI - PubMed

LinkOut - more resources