

Transient Hepatic Overexpression of Insulin-Like Growth Factor 2 Induces Free Cholesterol and Lipid Droplet Formation
- PMID: 27199763
- PMCID: PMC4843762
- DOI: 10.3389/fphys.2016.00147
Transient Hepatic Overexpression of Insulin-Like Growth Factor 2 Induces Free Cholesterol and Lipid Droplet Formation
Erratum in
-
Corrigendum: Transient Hepatic Overexpression of Insulin-Like Growth Factor 2 Induces Free Cholesterol and Lipid Droplet Formation.Front Physiol. 2016 Jul 29;7:328. doi: 10.3389/fphys.2016.00328. eCollection 2016. Front Physiol. 2016. PMID: 27489546 Free PMC article.
Abstract
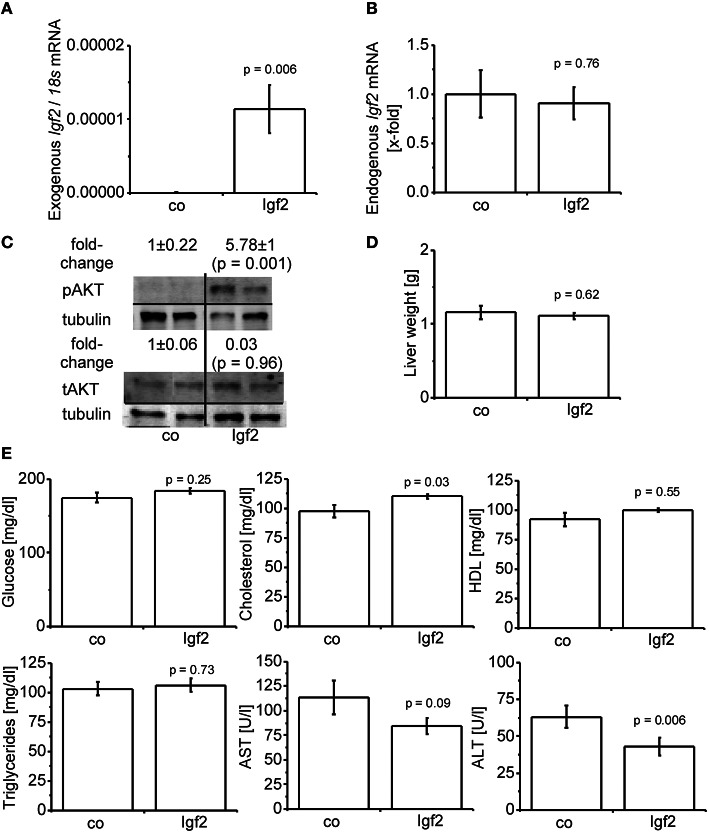
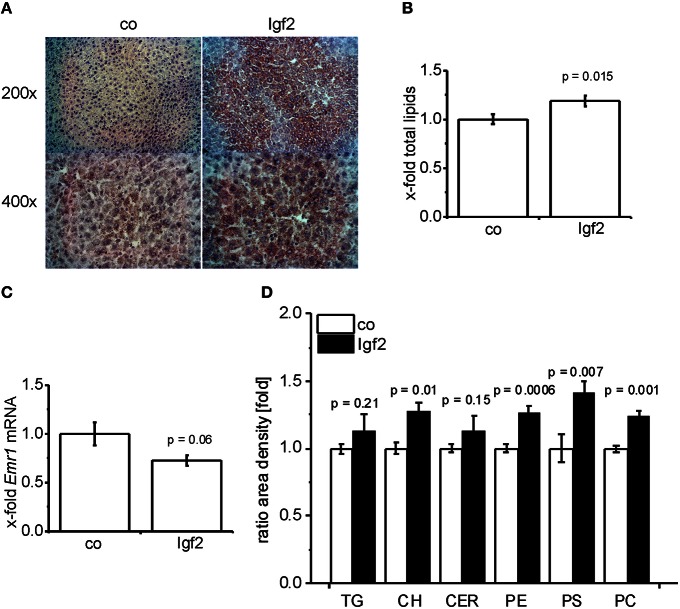
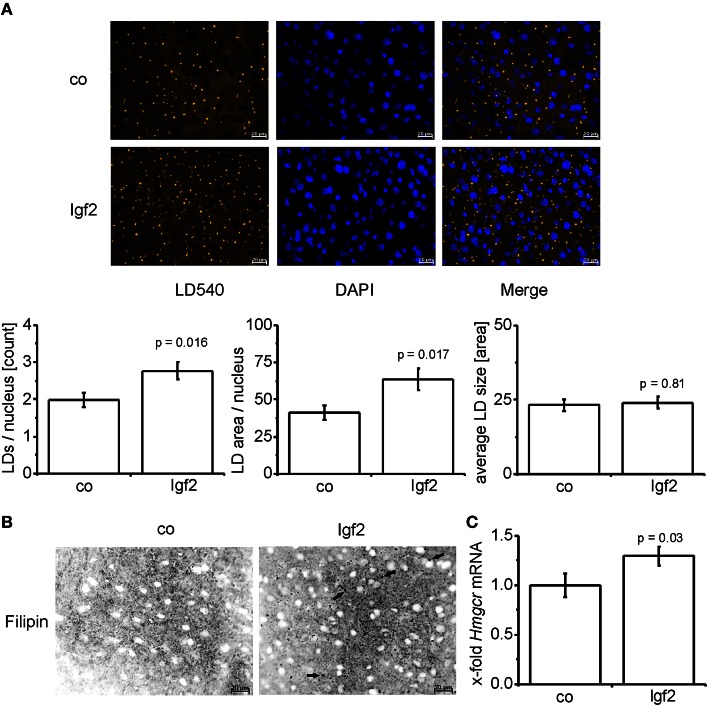
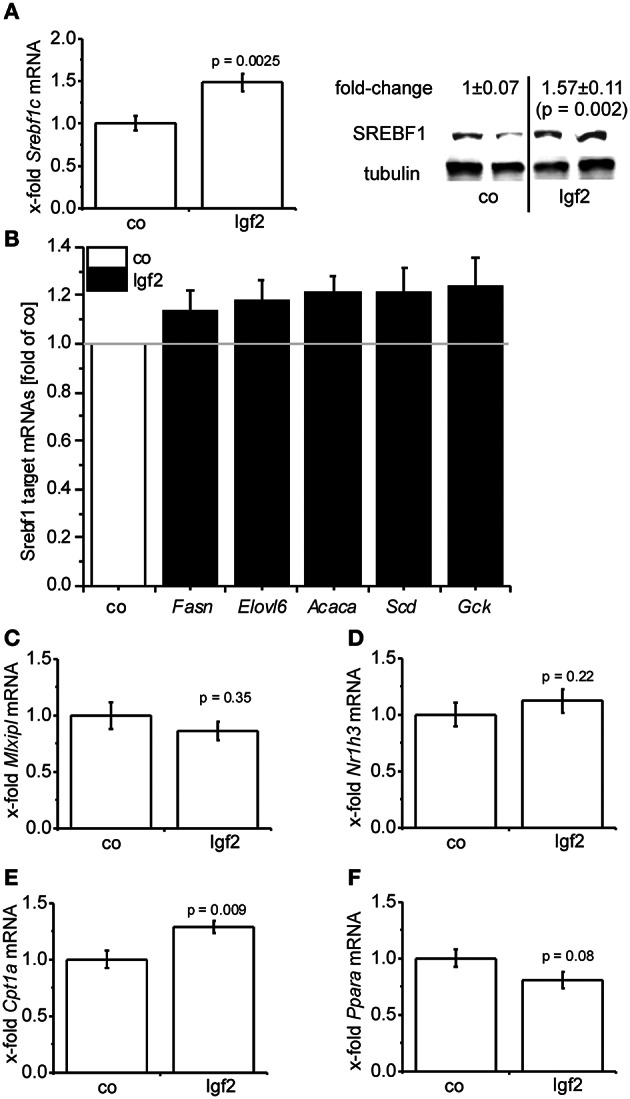
Although insulin-like growth factor 2 (IGF2) has been reported to be overexpressed in steatosis and steatohepatitis, a causal role of IGF2 in steatosis development remains elusive. Aim of our study was to decipher the role of IGF2 in steatosis development. Hydrodynamic gene delivery of an Igf2 plasmid used for transient Igf2 overexpression employing codon-optimized plasmid DNA resulted in a strong induction of hepatic Igf2 expression. The exogenously delivered Igf2 had no influence on endogenous Igf2 expression. The downstream kinase AKT was activated in Igf2 animals. Decreased ALT levels mirrored the cytoprotective effect of IGF2. Serum cholesterol was increased and sulfo-phospho-vanillin colorimetric assay confirmed lipid accumulation in Igf2-livers while no signs of inflammation were observed. Interestingly, hepatic cholesterol and phospholipids, determined by thin layer chromatography, and free cholesterol by filipin staining, were specifically increased. Lipid droplet (LD) size was not changed, but their number was significantly elevated. Furthermore, free cholesterol, which can be stored in LDs and has been reported to be critical for steatosis progression, was elevated in Igf2 overexpressing mice. Accordingly, Hmgcr/HmgCoAR was upregulated. To have a closer look at de novo lipid synthesis we investigated expression of the lipogenic transcription factor SREBF1 and its target genes. SREBF1 was induced and also SREBF1 target genes were slightly upregulated. Interestingly, the expression of Cpt1a, which is responsible for mitochondrial fatty acid oxidation, was induced. Hepatic IGF2 expression induces a fatty liver, characterized by increased cholesterol and phospholipids leading to accumulation of LDs. We therefore suggest a causal role for IGF2 in hepatic lipid accumulation.
Keywords: NASH; fatty liver; hydrodynamic gene delivery; insulin-like growth factor 2 (IGF2); lipid droplets.
Figures
Similar articles
-
Elevated free cholesterol in a p62 overexpression model of non-alcoholic steatohepatitis.World J Gastroenterol. 2014 Dec 21;20(47):17839-50. doi: 10.3748/wjg.v20.i47.17839. World J Gastroenterol. 2014. PMID: 25548482 Free PMC article.
-
The IGF2 mRNA binding protein p62/IGF2BP2-2 induces fatty acid elongation as a critical feature of steatosis.J Lipid Res. 2014 Jun;55(6):1087-97. doi: 10.1194/jlr.M045500. Epub 2014 Apr 22. J Lipid Res. 2014. PMID: 24755648 Free PMC article.
-
Corrigendum: Transient Hepatic Overexpression of Insulin-Like Growth Factor 2 Induces Free Cholesterol and Lipid Droplet Formation.Front Physiol. 2016 Jul 29;7:328. doi: 10.3389/fphys.2016.00328. eCollection 2016. Front Physiol. 2016. PMID: 27489546 Free PMC article.
-
Non-Alcoholic Fatty Liver Disease.Adv Exp Med Biol. 2017;960:443-467. doi: 10.1007/978-3-319-48382-5_19. Adv Exp Med Biol. 2017. PMID: 28585211 Review.
-
Etiopathogenesis of nonalcoholic steatohepatitis.Semin Liver Dis. 2001;21(1):27-41. doi: 10.1055/s-2001-12927. Semin Liver Dis. 2001. PMID: 11296694 Review.
Cited by
-
Activation of Cx43 Hemichannels Induces the Generation of Ca2+ Oscillations in White Adipocytes and Stimulates Lipolysis.Int J Mol Sci. 2021 Jul 28;22(15):8095. doi: 10.3390/ijms22158095. Int J Mol Sci. 2021. PMID: 34360859 Free PMC article.
-
Deletion of RhoA in Progesterone Receptor-Expressing Cells Leads to Luteal Insufficiency and Infertility in Female Mice.Endocrinology. 2017 Jul 1;158(7):2168-2178. doi: 10.1210/en.2016-1796. Endocrinology. 2017. PMID: 28498971 Free PMC article.
-
Interference of a mammalian circRNA regulates lipid metabolism reprogramming by targeting miR-24-3p/Igf2/PI3K-AKT-mTOR and Igf2bp2/Ucp1 axis.Cell Mol Life Sci. 2023 Aug 17;80(9):252. doi: 10.1007/s00018-023-04899-1. Cell Mol Life Sci. 2023. PMID: 37587272 Free PMC article.
-
IGF2 mRNA Binding Protein 2 Transgenic Mice Are More Prone to Develop a Ductular Reaction and to Progress Toward Cirrhosis.Front Med (Lausanne). 2019 Sep 4;6:179. doi: 10.3389/fmed.2019.00179. eCollection 2019. Front Med (Lausanne). 2019. PMID: 31555647 Free PMC article.
-
Insulin-Like Growth Factor (IGF) System in Liver Diseases.Int J Mol Sci. 2018 Apr 27;19(5):1308. doi: 10.3390/ijms19051308. Int J Mol Sci. 2018. PMID: 29702590 Free PMC article. Review.
References
LinkOut - more resources
Full Text Sources
Other Literature Sources
Research Materials
Miscellaneous