

Bacterioplankton Biogeography of the Atlantic Ocean: A Case Study of the Distance-Decay Relationship
- PMID: 27199923
- PMCID: PMC4845060
- DOI: 10.3389/fmicb.2016.00590
Bacterioplankton Biogeography of the Atlantic Ocean: A Case Study of the Distance-Decay Relationship
Abstract
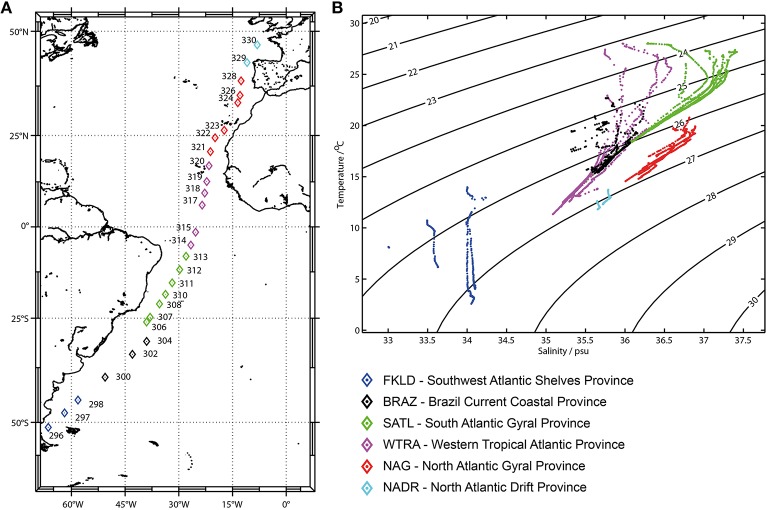
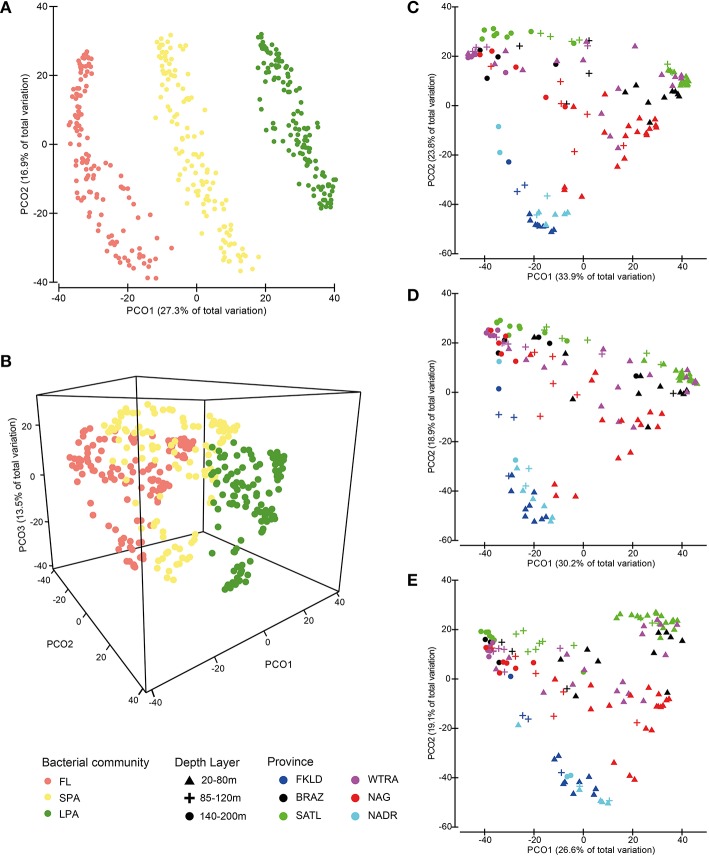
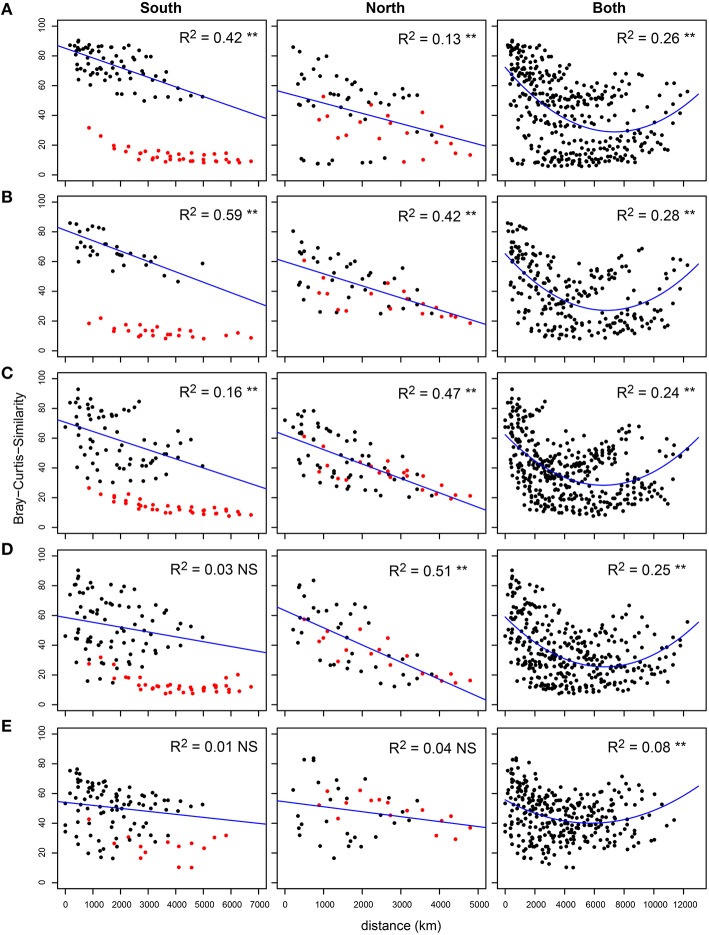
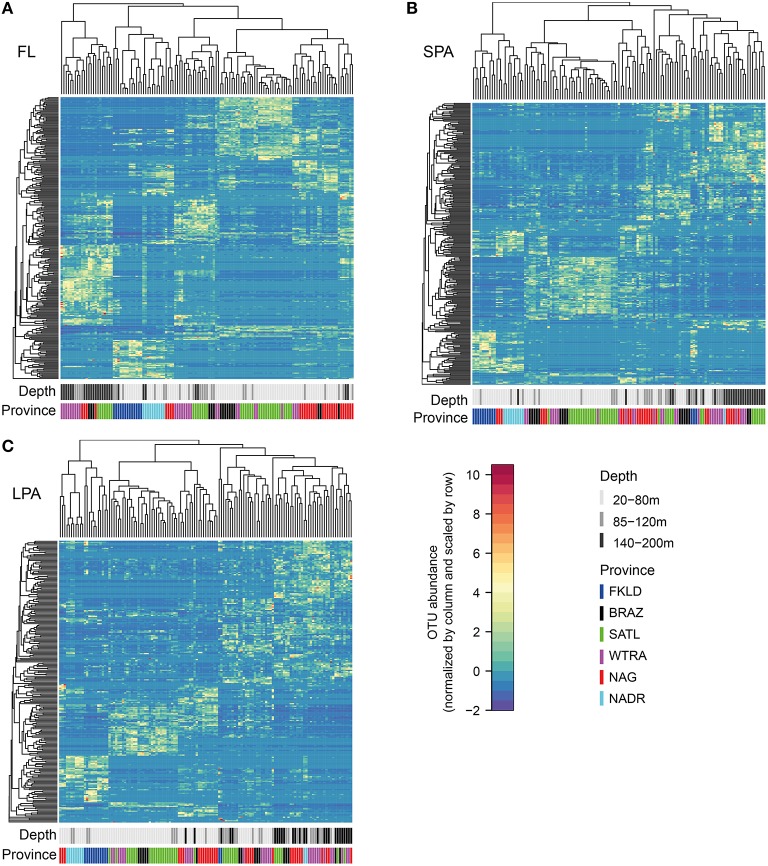
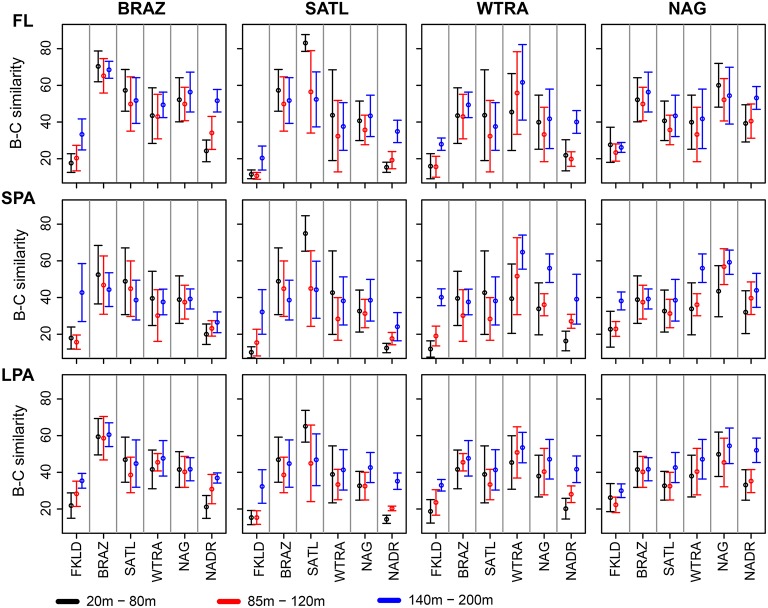
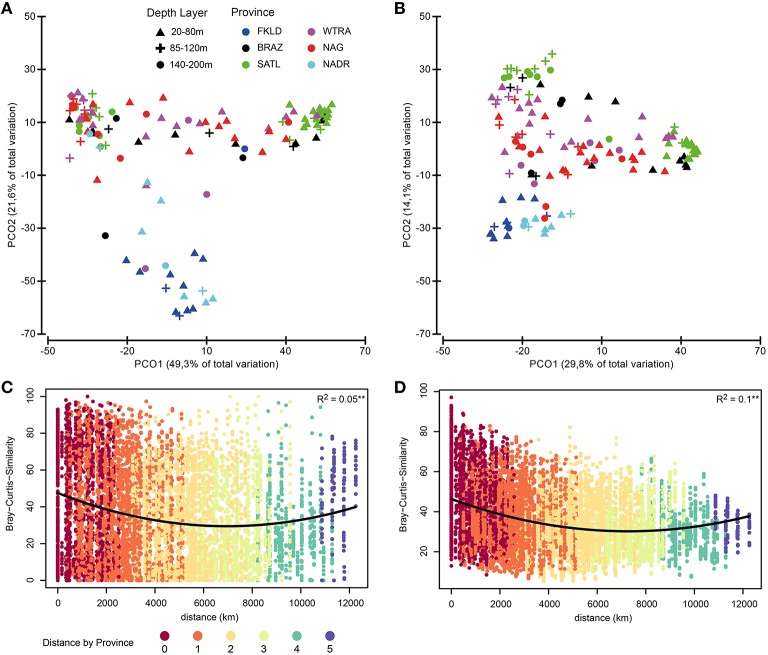
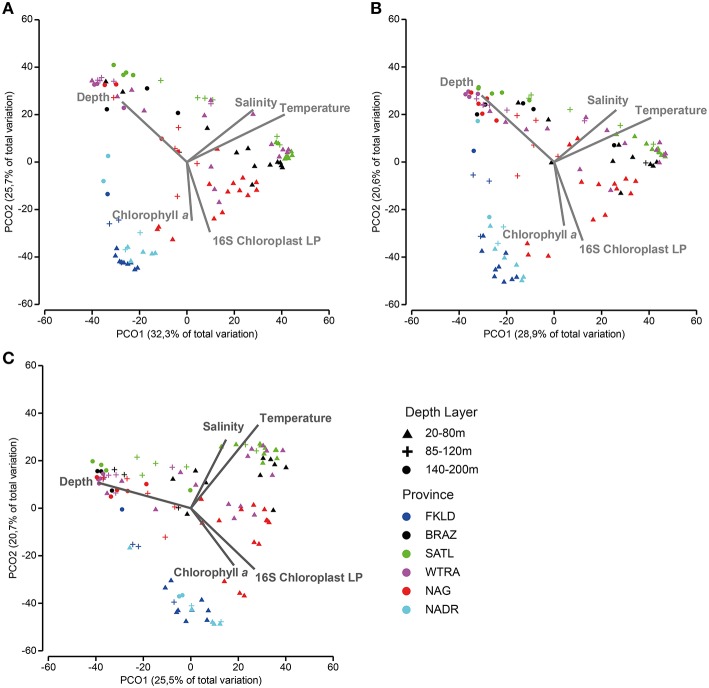
In order to determine the influence of geographical distance, depth, and Longhurstian province on bacterial community composition and compare it with the composition of photosynthetic micro-eukaryote communities, 382 samples from a depth-resolved latitudinal transect (51°S-47°N) from the epipelagic zone of the Atlantic ocean were analyzed by Illumina amplicon sequencing. In the upper 100 m of the ocean, community similarity decreased toward the equator for 6000 km, but subsequently increased again, reaching similarity values of 40-60% for samples that were separated by ~12,000 km, resulting in a U-shaped distance-decay curve. We conclude that adaptation to local conditions can override the linear distance-decay relationship in the upper epipelagial of the Atlantic Ocean which is apparently not restrained by barriers to dispersal, since the same taxa were shared between the most distant communities. The six Longhurstian provinces covered by the transect were comprised of distinct microbial communities; ~30% of variation in community composition could be explained by province. Bacterial communities belonging to the deeper layer of the epipelagic zone (140-200 m) lacked a distance-decay relationship altogether and showed little provincialism. Interestingly, those biogeographical patterns were consistently found for bacteria from three different size fractions of the plankton with different taxonomic composition, indicating conserved underlying mechanisms. Analysis of the chloroplast 16S rRNA gene sequences revealed that phytoplankton composition was strongly correlated with both free-living and particle associated bacterial community composition (R between 0.51 and 0.62, p < 0.002). The data show that biogeographical patterns commonly found in macroecology do not hold for marine bacterioplankton, most likely because dispersal and evolution occur at drastically different rates in bacteria.
Keywords: Particle associated bacteria; bacterioplankton; biogeography; distance-decay relationship; macroecology; marine bacteria; microalgae; oceanographic province.
Figures
Similar articles
-
Co-occurrence Analysis of Microbial Taxa in the Atlantic Ocean Reveals High Connectivity in the Free-Living Bacterioplankton.Front Microbiol. 2016 May 6;7:649. doi: 10.3389/fmicb.2016.00649. eCollection 2016. Front Microbiol. 2016. PMID: 27199970 Free PMC article.
-
Low diversity of planktonic bacteria in the tropical ocean.Sci Rep. 2016 Jan 11;6:19054. doi: 10.1038/srep19054. Sci Rep. 2016. PMID: 26750451 Free PMC article.
-
Composition and Biogeography of Planktonic Pro- and Eukaryotic Communities in the Atlantic Ocean: Primer Choice Matters.Front Microbiol. 2022 Jun 28;13:895875. doi: 10.3389/fmicb.2022.895875. eCollection 2022. Front Microbiol. 2022. PMID: 35836413 Free PMC article.
-
Microbe biogeography tracks water masses in a dynamic oceanic frontal system.R Soc Open Sci. 2017 Mar 15;4(3):170033. doi: 10.1098/rsos.170033. eCollection 2017 Mar. R Soc Open Sci. 2017. PMID: 28405400 Free PMC article.
-
A trait based perspective on the biogeography of common and abundant marine bacterioplankton clades.Mar Genomics. 2014 Jun;15:17-28. doi: 10.1016/j.margen.2014.03.002. Epub 2014 Mar 21. Mar Genomics. 2014. PMID: 24662471 Review.
Cited by
-
Agulhas Current properties shape microbial community diversity and potential functionality.Sci Rep. 2018 Jul 12;8(1):10542. doi: 10.1038/s41598-018-28939-0. Sci Rep. 2018. PMID: 30002454 Free PMC article.
-
Zooming in on the phycosphere: the ecological interface for phytoplankton-bacteria relationships.Nat Microbiol. 2017 May 30;2:17065. doi: 10.1038/nmicrobiol.2017.65. Nat Microbiol. 2017. PMID: 28555622 Review.
-
Seasonality in Spatial Turnover of Bacterioplankton Along an Ecological Gradient in the East China Sea: Biogeographic Patterns, Processes and Drivers.Microorganisms. 2020 Sep 27;8(10):1484. doi: 10.3390/microorganisms8101484. Microorganisms. 2020. PMID: 32992545 Free PMC article.
-
Co-occurrence Analysis of Microbial Taxa in the Atlantic Ocean Reveals High Connectivity in the Free-Living Bacterioplankton.Front Microbiol. 2016 May 6;7:649. doi: 10.3389/fmicb.2016.00649. eCollection 2016. Front Microbiol. 2016. PMID: 27199970 Free PMC article.
-
Divergent altitudinal patterns of arbuscular and ectomycorrhizal fungal communities in a mid-subtropical mountain ecosystem.IMA Fungus. 2025 Apr 3;16:e140187. doi: 10.3897/imafungus.16.e140187. eCollection 2025. IMA Fungus. 2025. PMID: 40225017 Free PMC article.
References
-
- Anderson M. J., Gorley R. N., Clarke R. K. (2006). PERMANOVA+ for PRIMER: Guide to Software and Statistical Methods. Plymouth, MA: PRIMER-E.
-
- Astorga A., Oksanen J., Luoto M., Soininen J., Virtamen R., Muokta T. (2012). Distance decay of similarity in freshwater communities: do macro- and microorganisms follow the same rules? Global Ecol. Biogeogr. 21, 375 10.1111/j.1466-8238.2011.00681.x - DOI
LinkOut - more resources
Full Text Sources
Other Literature Sources