. 2016 May 3:7:566.
doi: 10.3389/fpls.2016.00566. eCollection 2016.

Orthology Analysis and In Vivo Complementation Studies to Elucidate the Role of DIR1 during Systemic Acquired Resistance in Arabidopsis thaliana and Cucumis sativus

Affiliations

Orthology Analysis and In Vivo Complementation Studies to Elucidate the Role of DIR1 during Systemic Acquired Resistance in Arabidopsis thaliana and Cucumis sativus

Marisa Isaacs et al. Front Plant Sci. .

Erratum in

Abstract

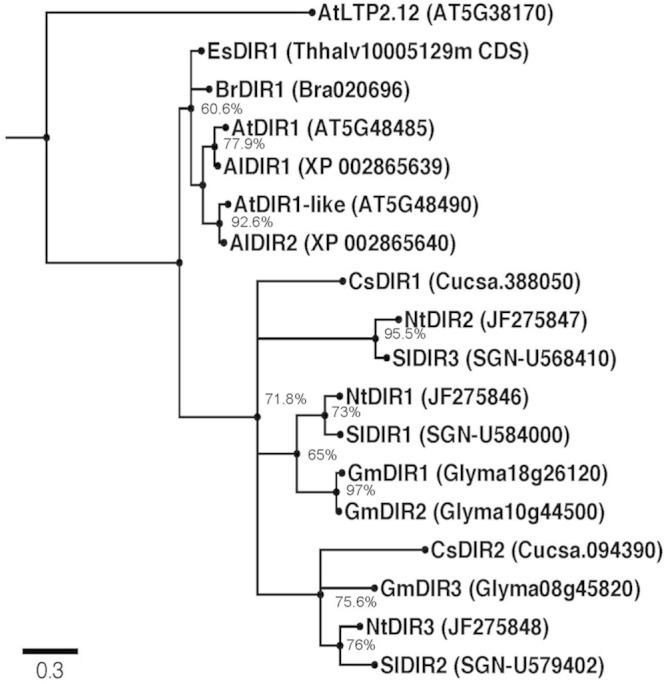
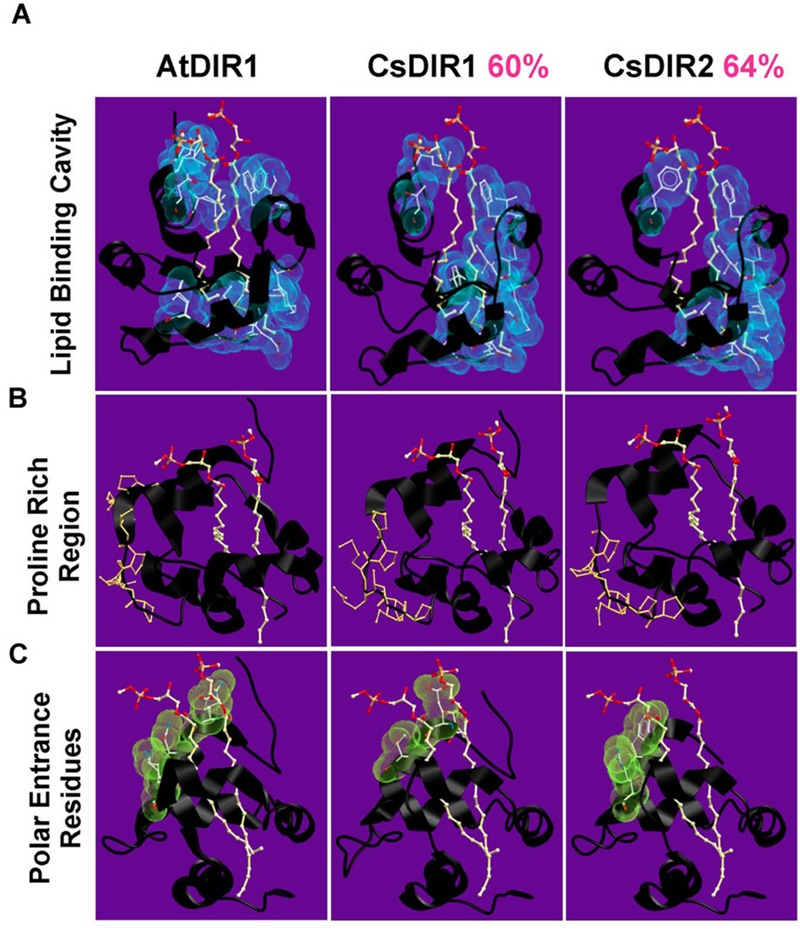
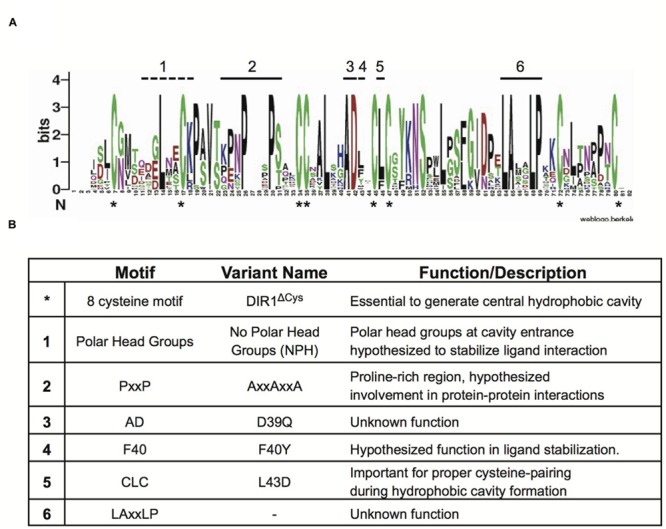
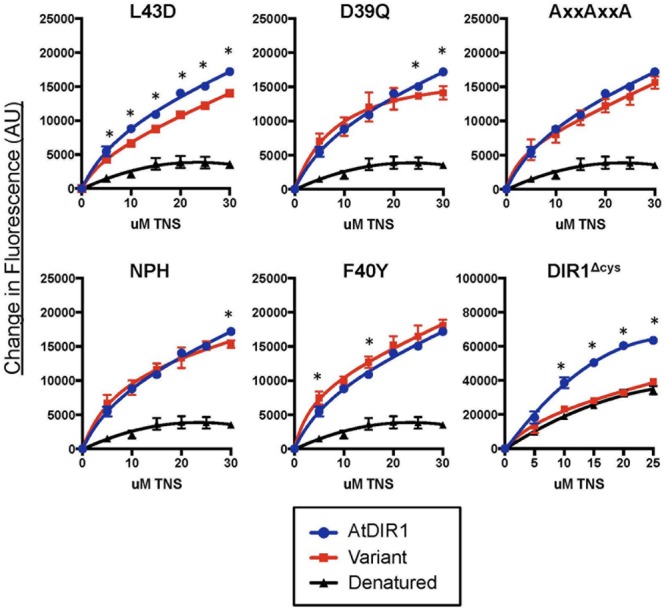
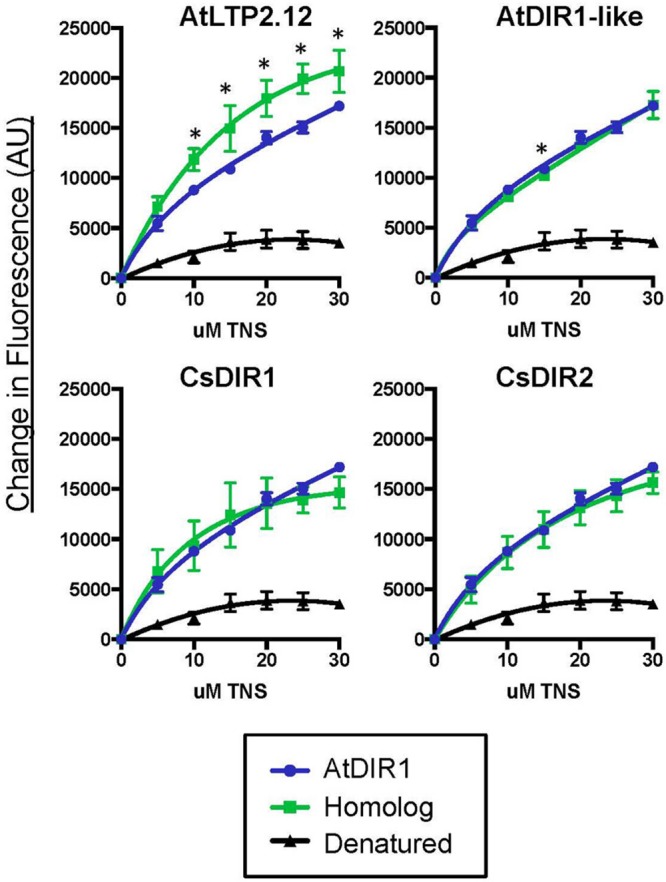
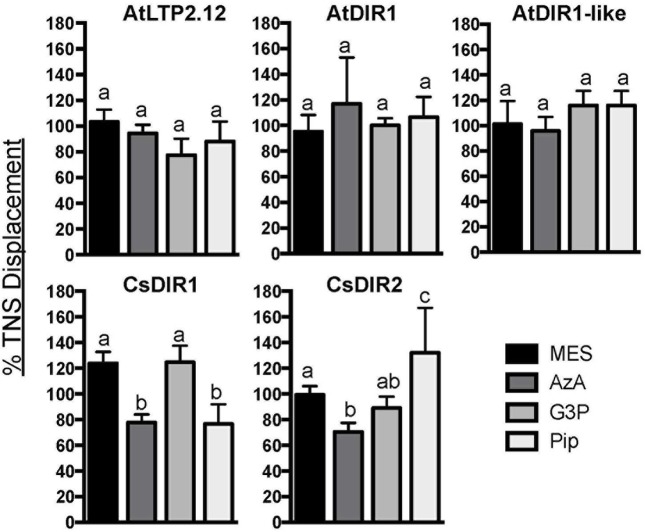
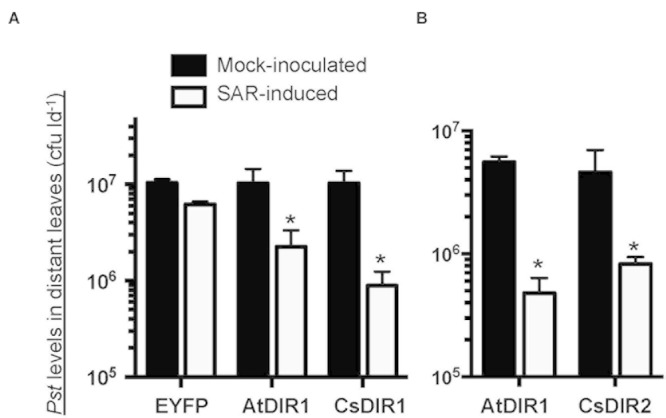
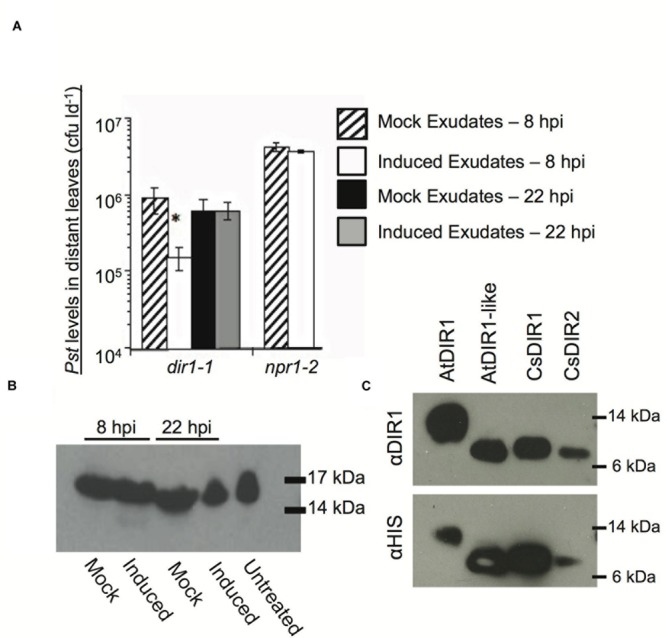
AtDIR1 (Defective in Induced Resistance1) is an acidic lipid transfer protein essential for systemic acquired resistance (SAR) in Arabidopsis thaliana. Upon SAR induction, DIR1 moves from locally infected to distant uninfected leaves to activate defense priming; however, a molecular function for DIR1 has not been elucidated. Bioinformatic analysis and in silico homology modeling identified putative AtDIR1 orthologs in crop species, revealing conserved protein motifs within and outside of DIR1's central hydrophobic cavity. In vitro assays to compare the capacity of recombinant AtDIR1 and targeted AtDIR1-variant proteins to bind the lipophilic probe TNS (6,P-toluidinylnaphthalene-2-sulfonate) provided evidence that conserved leucine 43 and aspartic acid 39 contribute to the size of the DIR1 hydrophobic cavity and possibly hydrophobic ligand binding. An Arabidopsis-cucumber SAR model was developed to investigate the conservation of DIR1 function in cucumber (Cucumis sativus), and we demonstrated that phloem exudates from SAR-induced cucumber rescued the SAR defect in the Arabidopsis dir1-1 mutant. Additionally, an AtDIR1 antibody detected a protein of the same size as AtDIR1 in SAR-induced cucumber phloem exudates, providing evidence that DIR1 function during SAR is conserved in Arabidopsis and cucumber. In vitro TNS displacement assays demonstrated that recombinant AtDIR1 did not bind the SAR signals azelaic acid (AzA), glycerol-3-phosphate or pipecolic acid. However, recombinant CsDIR1 and CsDIR2 interacted weakly with AzA and pipecolic acid. Bioinformatic and functional analyses using the Arabidopsis-cucumber SAR model provide evidence that DIR1 orthologs exist in tobacco, tomato, cucumber, and soybean, and that DIR1-mediated SAR signaling is conserved in Arabidopsis and cucumber.

Keywords: DIR1; cucumber; hydrophobic cavity; lipid transfer protein; long-distance signaling; systemic acquired resistance.


Figures

FIGURE 1
FIGURE 1
Rooted Phylogenetic Maximum Likelihood tree of putative DIR1 orthologs. DNA sequences lacking the divergent ER signal sequence were aligned using MUSCLE. The evolutionary history was inferred using the Maximum Likelihood method based on the Kimura 2-parameter model with discrete Gamma distribution using MEGA 5. Ten thousand bootstrap replicates were conducted and percent bootstrap values were placed on corresponding branches. Nodes with bootstrap values below 50% were collapsed using Archaeopteryx software. Phylogeny was viewed in FigTree v1.4. Branches were drawn to scale, measured in number of substitutions per site and branches were labeled by species name followed by TAIR gene number or Phytozome 8.0 accession. Al: Arabidopsis lyrata, At: Arabidopsis thaliana, Br: Brassica rapa, Cs: Cucumis sativus, Es: Eutrema salsugineum, Gm: Glycine max, Nt: Nicotiana tabacum, Sl: Solanum lycopersicum.
FIGURE 2
FIGURE 2
Homology models of CsDIR1 and CsDIR2. Proteins were modeled with SWISS-MODEL 4.0.1 server using AtDIR1-phospholipid crystal structure as a template and modeled with SWISS-MODEL 4.0.1 server and viewed using Molsoft ICM browser. Percent sequence similarity compared to AtDIR1 is identified in pink. (A–C) phospholipids in orange (phosphate), red (oxygen), and white (carbon). (A) The hydrophobic residues (blue) that are within 5 Å of the phospholipids highlight the inner hydrophobic cavity. (B) The proline residues of the proline rich regions are highlighted in orange. (C) The polar residues at the cavity entrance are highlighted in green.
FIGURE 3
FIGURE 3
Identification of conserved amino acid residues and motifs among DIR1 orthologs. (A) Sequence Logo plot of Muscle aligned mature DIR1 orthologs protein sequences. Residues of the orthologs are stacked on top of one another and their frequency determines the height of the residue letter in the plot. Bits is a measure of the information content at that position in the sequence. Conserved cysteine residues are indicated by an asterisk () that appears under the x-axis. Other conserved areas are highlighted with numbers above the corresponding letter. (B) Summary of identified motifs. Motif name, DIR1 variant protein generated, and a short description are included.
FIGURE 4
FIGURE 4
Comparative in vitro TNS (6,P-toluidinylnaphthalene-2-sulfonate) binding assays of recombinant DIR1 variant proteins and AtDIR1. DIR1 variants (L43D, D39Q, AxxAxxA, NPH, F40Y, and DIR1Δcys: red lines, squares) are compared to natured (blue lines, circles) and denatured (black lines, triangles) AtDIR1 protein. Increasing concentrations of TNS were added to each Rosetta Gami E. coli purified protein lacking the ER signal sequence. TNS binding curves were generated in PRISM6 by non-linear curve fitting for one site saturation binding. Proteins were denatured by boiling in 6 M Urea. Samples were excited at 320 nm and emission at 437 nm and the change in fluorescence was calculated for three replicates. Error bars represent the standard deviation. Significant differences between AtDIR1 and each variant at a given concentration of TNS were determined by Student’s t-test (p < 0.05) and are indicated by an asterisk (). The DIR1Δcys data was obtained using a different instrument (see Section “Materials and methods”).
FIGURE 5
FIGURE 5
Comparative in vitro TNS binding assays of recombinant AtDIR1, AtDIR1-like, AtLTP2.12, and the CsDIR1/CsDIR2 orthologs. DIR1 homologs and the AtLTP2.12 control (green lines, squares) are compared to natured (blue lines, circles) and denatured (black lines, triangles) AtDIR1 protein. Increasing concentrations of TNS were added to each Rosetta Gami E. coli purified protein lacking the ER signal sequence. TNS binding curves were generated in PRISM6 by non-linear curve fitting for one site saturation binding. Proteins were denatured by boiling in 6 M Urea. Samples were excited at 320 nm and emission at 437 nm and the change in fluorescence was calculated for three replicates. Error bars represent the standard deviation of the technical variation. Significant differences between AtDIR1 and each homolog at a given concentration of TNS were determined by Student’s t-test (p < 0.05) and are indicated by an asterisk ().
FIGURE 6
FIGURE 6
In vitro ligand binding assays. TNS displacement assays using AtDIR1, AtLTP2.12, AtDIR1-like, CsDIR1, and CsDIR2 to test the binding of azelaic acid (AzA), glycerol-3-phosphate (G3P), pipecolic acid (Pip), and MES buffer control. Fluorescence was measured when TNS (3 μm) and putative ligands (16 μm) were incubated together for 3 min, then again after purified proteins were added. Fluorescence was measured at excitation wavelength of 320 nm and emission at 437 nm in triplicate. The data is represented as the percent TNS Displacement, which indicates the fluorescence level of protein-ligand-TNS compared to TNS-protein alone (100%). Error bars indicate standard deviation of three replicate measurements. Different letters indicate significant differences (ANOVA, Tukey’s HSD, p < 0.05).
FIGURE 7
FIGURE 7
In vivo complementation of dir1-1 by Agrobacterium-mediated transient expression of (A)CsDIR1 and (B)CsDIR2. At 3 weeks post germination (wpg), two leaves of dir1-1 were inoculated with Agrobacterium expressing EYFP, AtDIR1(-EYFP), CsDIR1, or CsDIR2. Four days later, the same leaves were mock-inoculated (10 mM MgCl2) or induced for SAR with 106 cfu ml-1 Pst (avrRpt2). Distant leaves were challenged for SAR 2 days post mock/SAR-induction with virulent Pst (105 cfu ml-1) and in planta bacterial levels were determined in distant leaves 3 days post challenge. Statistically significant differences between mock-induced and SAR-induced plants (Student’s t-test p < 0.05) are indicated with asterisks (). (A) was performed four times with similar results and (B) was performed three times with similar results.
FIGURE 8
FIGURE 8
Characterization of DIR1-mediated SAR in Cucumis sativus. (A) SAR-induced cucumber exudates rescue the SAR defect in dir1-1. Petiole exudates were collected from cut cucumber ends at 8 or 22 hpi with 10 mM MgCl2 (mock) or SAR-inducing (induced) Pseudomonas syringae pv. syringae D20. Exudates from Mock (8 or 22 hpi) or SAR-induced (8 or 22 hpi) were infiltrated into 2 dir1-1 or npr1-2 leaves. Two days later distant leaves were inoculated with virulent Pst (105 cfu ml-1) and 3 dpi Pst levels were measured. An asterisk () indicates a significant difference between plants infiltrated with mock and induced exudates. (B) A DIR1-sized band is present in cucumber phloem before and after SAR induction Exudates were lyophilized and subjected to immunoblot analysis using the DIR1 antibody. 17 and 14 kDa protein molecular weight markers are indicated. (C) Recombinant CsDIR1 and CsDIR2 protein is detected by the polyclonal DIR1 antibody. Immunoblots of crude extracts from IPTG-induced Rosetta-gami strains expressing His-tagged AtDIR1, AtDIR1-like, CsDIR1, and CsDIR2 proteins using anti-DIR1 or anti-HIS antibodies. (A) Was repeated two additional times, (B,C) were repeated once, all with similar results.

Similar articles

Cited by

References

    1. Arnold K., Bordoli L., Kopp J., Schwede T. (2006). The SWISS-MODEL workspace: a web-based environment for protein structure homology modelling. Bioinformatics 22 195–201. 10.1093/bioinformatics/bti770 - DOI - PubMed
    1. Bakan B., Hamberg M., Perrocheau L., Maume D., Rogniaux H., Tranquet O., et al. (2006). Specific adduction of plant lipid transfer protein by an allene oxide generated by 9-lipoxygenase and allene oxide synthase. J. Biol. Chem. 281 38981–38988. 10.1074/jbc.M608580200 - DOI - PubMed
    1. Buhot N., Gomes E., Milat M.-L., Ponchet M., Marion D., Lequeu J., et al. (2004). Modulation of the biological activity of a tobacco LTP1 by lipid complexation. Mol. Biol. Cell 15 5047–5052. 10.1091/mbc.E04-07-0575 - DOI - PMC - PubMed
    1. Cameron R. K., Dixon R. A., Lamb C. J. (1994). Biologically induced systemic acquired resistance in Arabidopsis thaliana. Plant J. 5 715–725. 10.1111/j.1365-313X.1994.00715.x - DOI
    1. Cameron R. K., Paiva N. L., Lamb C. J., Dixon R. A. (1999). Accumulation of salicylic acid and PR-1 gene transcripts in relation to the systemic acquired resistance (SAR) response induced by Pseudomonas syringae pv. tomato in Arabidopsis. Phys. Mol. Plant Pathol. 55 121–130. 10.1006/pmpp.1999.0214 - DOI

LinkOut - more resources