. 2016:2016:6731093.
doi: 10.1155/2016/6731093. Epub 2016 Apr 20.

Age-Associated Changes in the Vascular Renin-Angiotensin System in Mice

Affiliations

Age-Associated Changes in the Vascular Renin-Angiotensin System in Mice

Hye Eun Yoon et al. Oxid Med Cell Longev. 2016.

Abstract

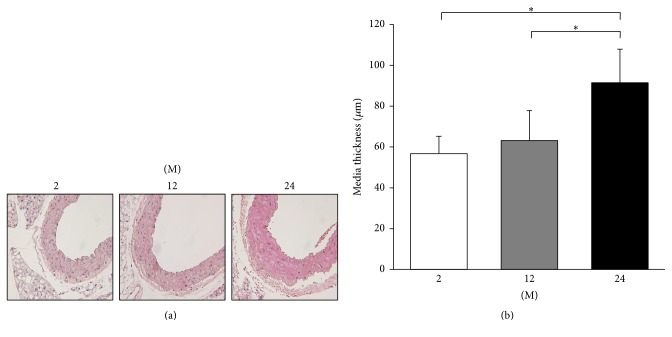
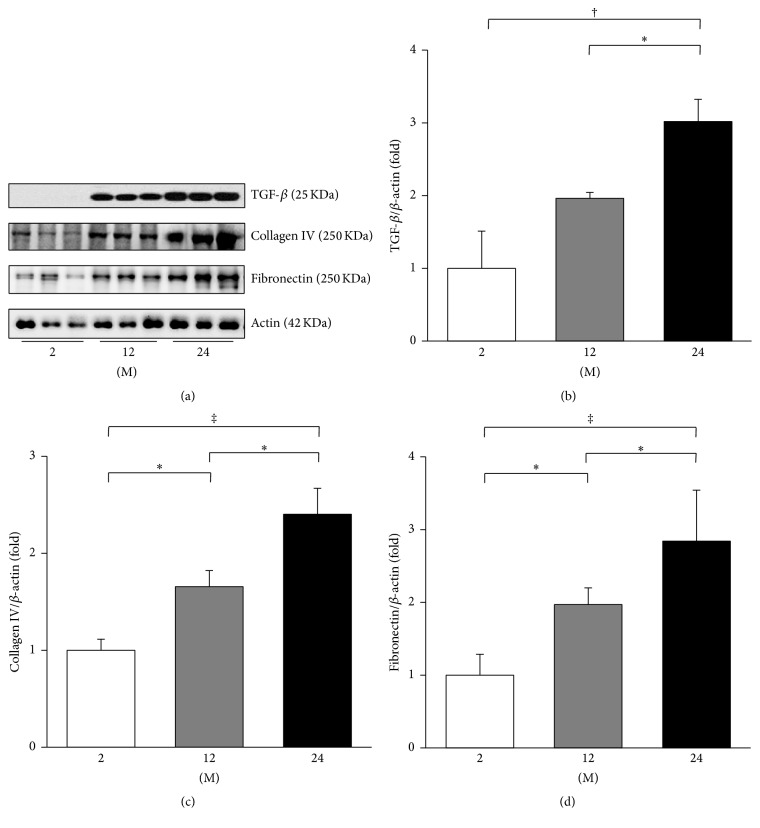
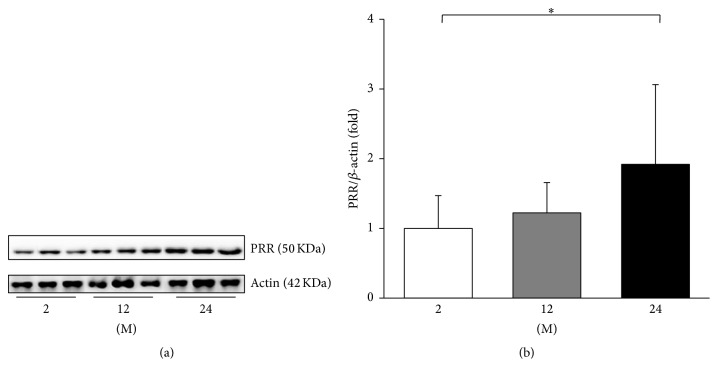
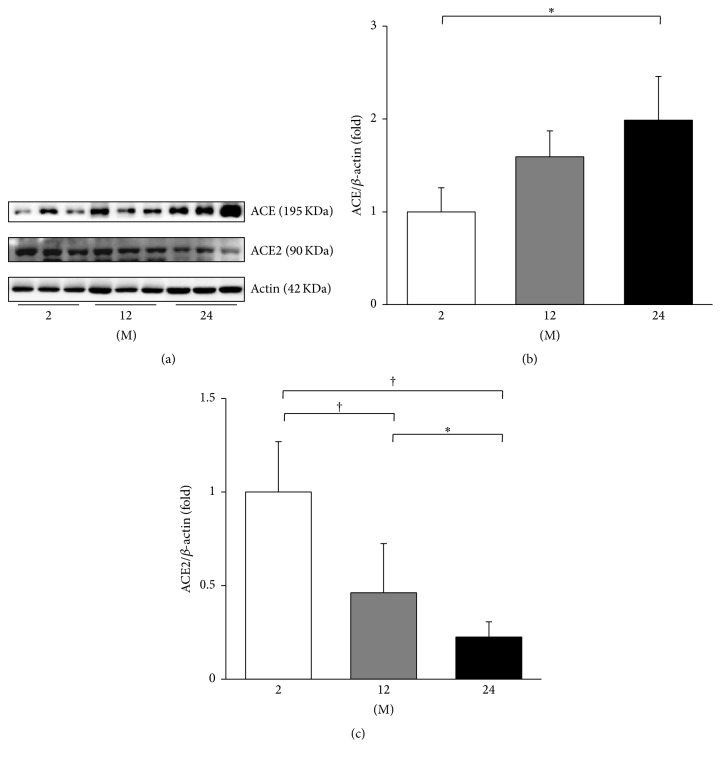
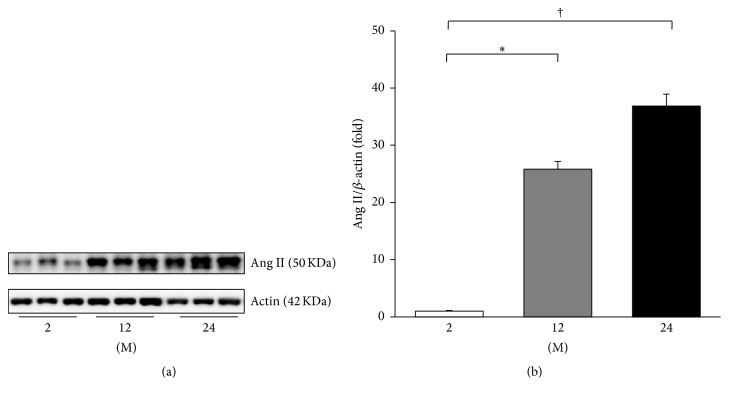
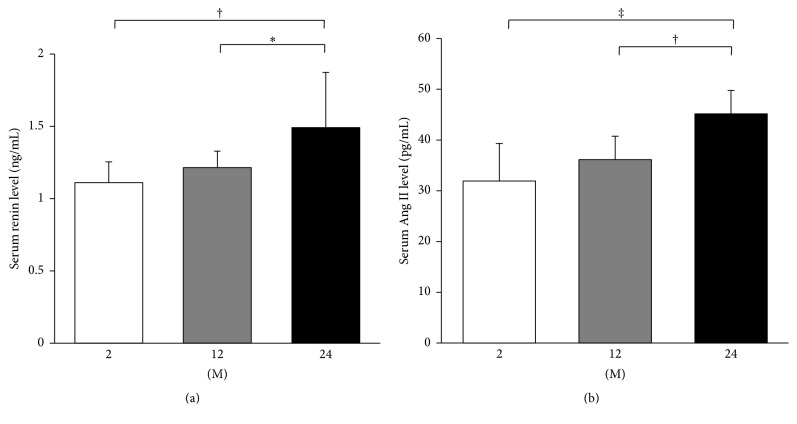
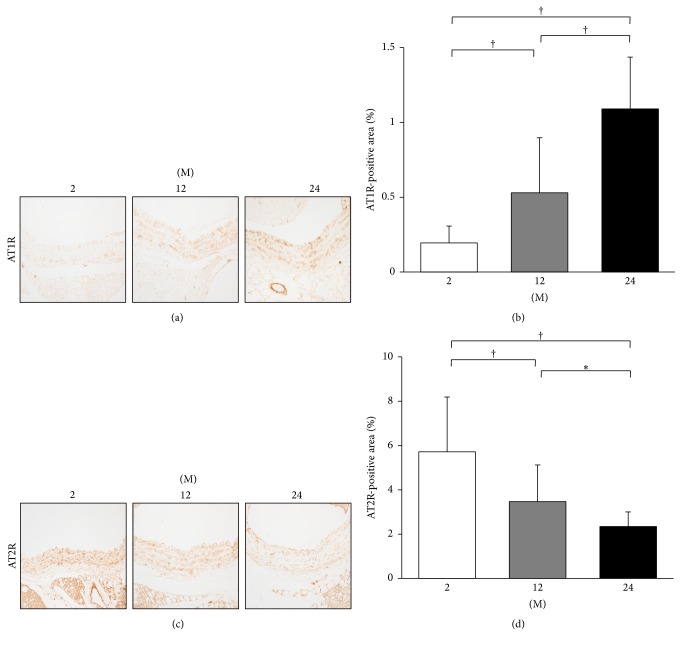
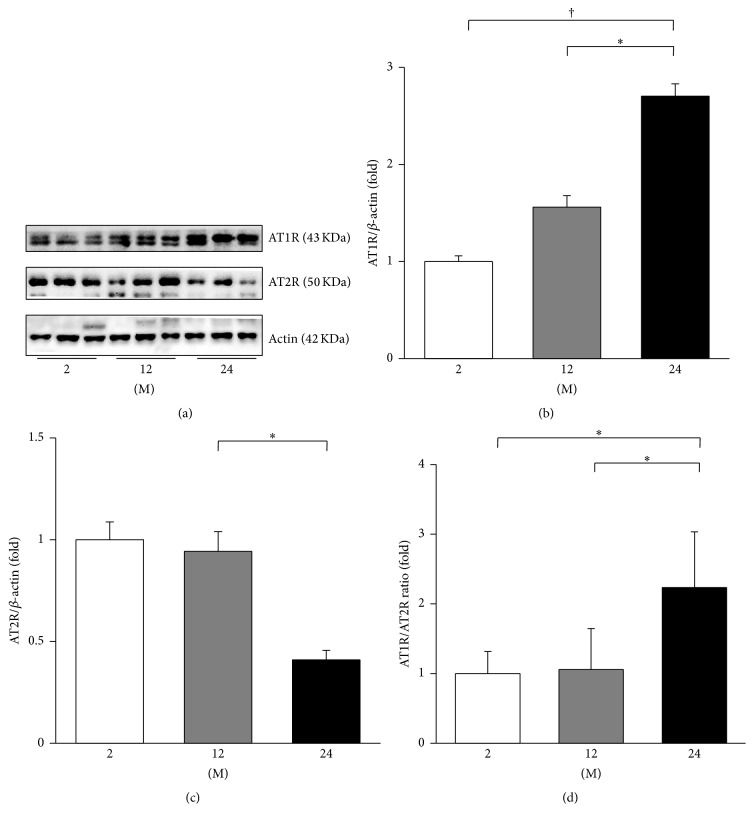
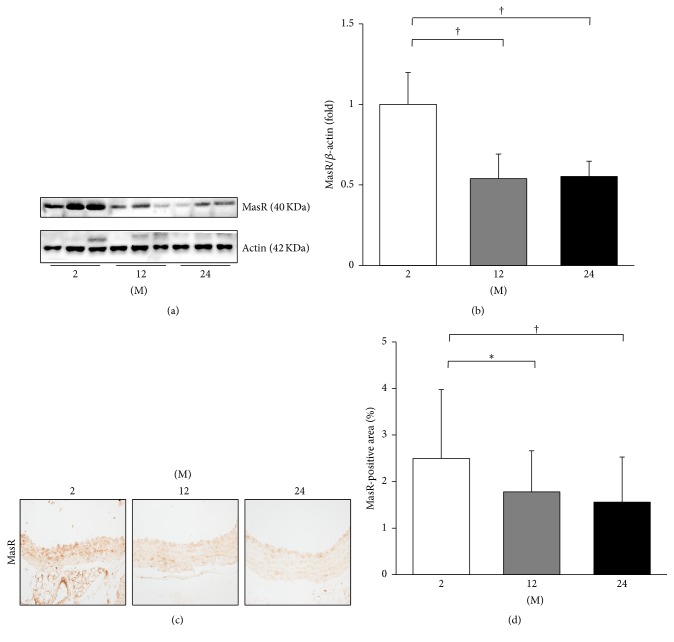
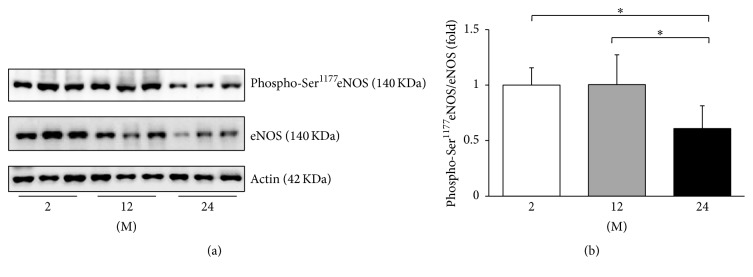
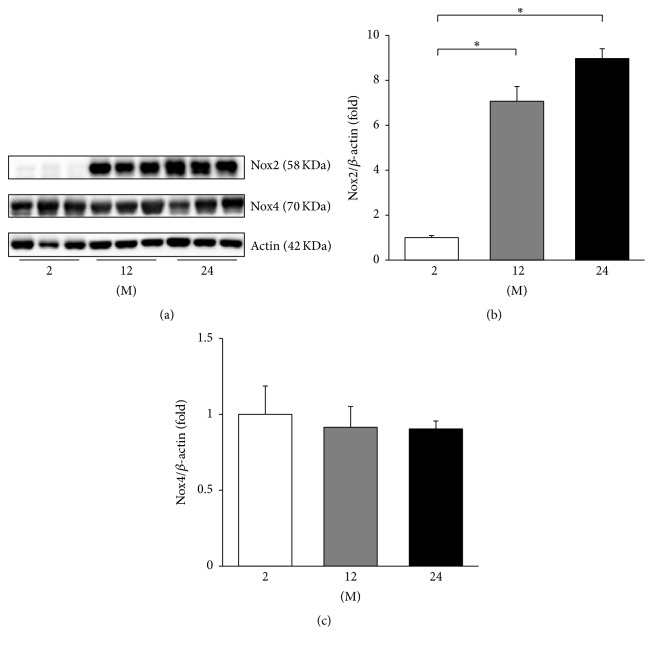
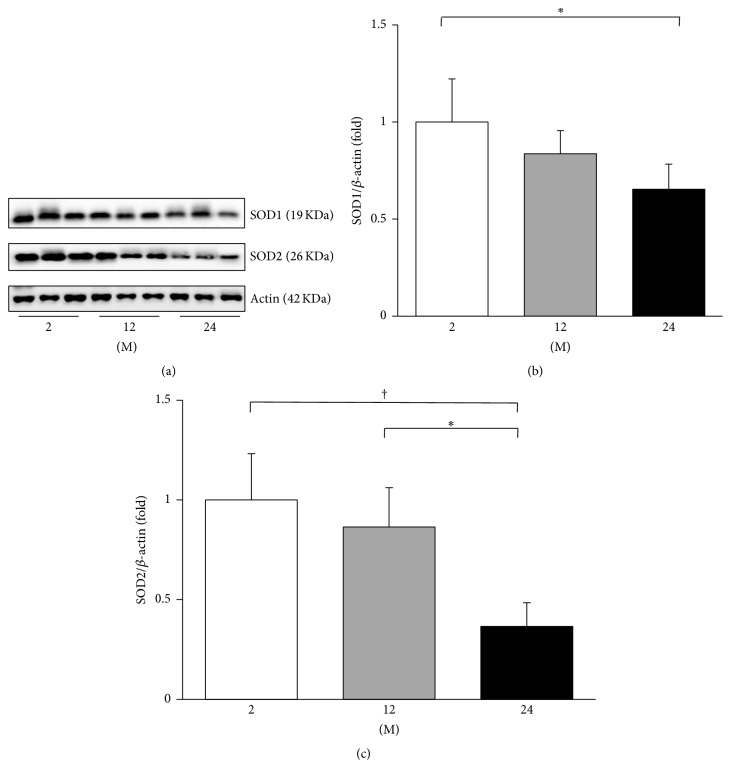
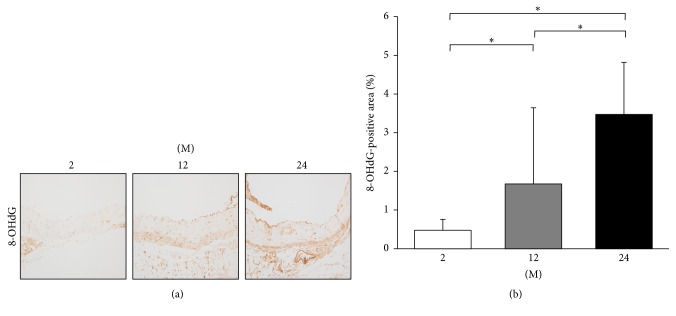
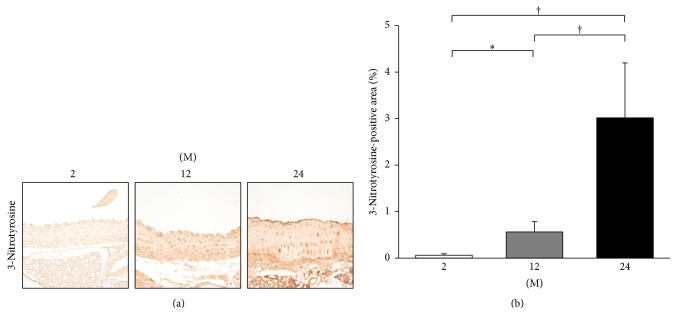
Background. This study evaluated whether the change in the renin-angiotensin system (RAS) is associated with arterial aging in mice. Methods. Histologic changes and expressions of transforming growth factor-β (TGF-β), collagen IV, fibronectin, angiotensin II (Ang II), angiotensin-converting enzyme (ACE), angiotensin-converting enzyme 2 (ACE2), angiotensin II type 1 receptor (AT1R), angiotensin II type 2 receptor (AT2R), prorenin receptor (PRR), Mas receptor (MasR), endothelial nitric oxide synthase (eNOS), NADPH oxidase 2 and oxidase 4 (Nox2 and Nox4), 8-hydroxy-2'-deoxyguanosine (8-OHdG), 3-nitrotyrosine, and superoxide dismutase 1 and dismutase 2 (SOD1 and SOD2) were measured in the thoracic aortas from 2-month-old, 12-month-old, and 24-month-old C57/BL6 mice. Results. Twenty-four-month-old mice showed significantly increased aortic media thickness and expressions of TGF-β, collagen IV, and fibronectin, compared to 2-month-old and 12-month-old mice. The expressions of PRR, ACE, and Ang II, and AT1R-positive area significantly increased, whereas expressions of ACE2 and MasR and AT2R-positive area decreased with age. The expressions of phosphorylated serine(1177)-eNOS, SOD1, and SOD2 decreased, and the 8-OHdG-positive area and the 3-nitrotyrosine-positive area increased with age. The expression of Nox2 significantly increased with age, but that of Nox4 did not change. Conclusions. The enhanced PRR-ACE-Ang II-AT1R axis and reduced ACE2-MasR axis were associated with arterial aging in mice.


Figures

Figure 1
Figure 1
Thoracic aorta media thickness. (a) Representative images of HE stain of thoracic aorta tissues (original magnification, 400x). (b) The 24 M group (91.47 ± 16.41 μm) showed significantly increased aortic media thickness compared to 2 M (56.74 ± 8.51 μm) and 12 M groups (63.19 ± 14.67 μm). P < 0.001. Values are shown as mean ± SD.
Figure 2
Figure 2
Expressions of TGF-β, collagen IV, and fibronectin. (a) Representative western blots of TGF-β, collagen IV, and fibronectin. (b) The expression of TGF-β significantly increased in the 24 M group compared with the 2 M and 12 M groups. (c) The expression of collagen IV gradually increased with age. (d) The expression of fibronectin significantly increased with age. P < 0.05, P < 0.01, and P < 0.001. Values are shown as mean ± SD.
Figure 3
Figure 3
Western blot of PRR. (a) Representative western blots of PRR. (b) There was a marked increase in the expression of PRR in the 24 M group compared with the 2 M group. P < 0.05. Values are shown as mean ± SD.
Figure 4
Figure 4
Western blots of ACE and ACE2. (a) Representative western blots of ACE and ACE2. (b) There was a marked increase in the expression of ACE in the 24 M group compared with the 2 M group. (c) The expression of ACE2 markedly decreased in the 24 M group compared with the 2 M group and 12 M group. P < 0.05; P < 0.001. Values are shown as mean ± SD.
Figure 5
Figure 5
Western blot of Ang II. (a) Representative western blots of Ang II. (b) The expression of Ang II gradually increased in the 12 M group and 24 M group compared with the 2 M group. P < 0.01; P < 0.001. Values are shown as mean ± SD.
Figure 6
Figure 6
ELISA for serum levels of renin and Ang II. Serum levels of renin (a) and Ang II (b) significantly increased in the 24 M group compared to those of 2 M and 12 M groups. P < 0.05, P < 0.01, and P < 0.001. Values are shown as mean ± SD.
Figure 7
Figure 7
Immunohistochemistry for AT1R and AT2R. (a) Representative images of immunohistochemistry for AT1R (original magnification, 400x). (b) There was marked increase in the AT1R-positive area in the 24 M group (1.09 ± 0.35%) compared with 2 M group (0.19 ± 0.11%) and 12 M group (0.53 ± 0.37%). (c) Representative images of immunohistochemistry for AT2R (original magnification, 400x). (d) There was marked decrease in the AT2R-positive area in the 24 M group (2.34 ± 0.66%) compared with 2 M group (5.72 ± 2.47%) and 12 M group (3.47 ± 1.66%). P < 0.01; P < 0.001. Values are shown as mean ± SD.
Figure 8
Figure 8
Western blots of AT1R and AT2R. (a) Representative western blots of AT1R and AT2R. (b) The expression of AT1R gradually increased in the 12 M group and 24 M group compared with the 2 M group. (c) The expression of AT2R showed a tendency of decrease in the 24 M group compared with the 2 M group, but it was not statistically significant. (d) The ratio of AT1R to AT2R significantly increased in the 24 M group compared to 2 M and 12 M groups. P < 0.01; P < 0.001. Values are shown as mean ± SD.
Figure 9
Figure 9
Western blot and immunohistochemistry for MasR. (a) Representative western blots of MasR. (b) The expression of MasR markedly decreased in the 12 M group and 24 M group compared with the 2 M group. (c) Representative images of immunohistochemistry for MasR (original magnification, 400x). (d) There was marked decrease in the MasR-positive area in the 24 M group (1.56 ± 0.97%) compared with 2 M group (2.50 ± 1.48%) and 12 M group (1.78 ± 0.88%). P < 0.05; P < 0.01. Values are shown as mean ± SD.
Figure 10
Figure 10
Western blots of phospho-Ser1177eNOS and eNOS. (a) Representative western blots of phospho-Ser1177eNOS and eNOS. (b) The ratio of phospho-Ser1177eNOS to eNOS decreased in the 24 M group compared with the 2 M and 12 M groups. P < 0.05. Values are shown as mean ± SD.
Figure 11
Figure 11
Western blots of Nox2 and Nox4. (a) Representative western blots of Nox2 and Nox4. (b) The expression of Nox2 markedly increased in the 12 M group and 24 M group compared with the 2 M group. (c) There was no significant difference in the expression of Nox4 between groups. P < 0.001. Values are shown as mean ± SD.
Figure 12
Figure 12
Western blots of SOD1 and SOD2. (a) Representative western blots of SOD1 and SOD2. (b) The expression of SOD1 markedly decreased in the 24 M group compared with the 2 M group. (c) The expression of SOD2 decreased in the 24 M group compared with the 2 M and 12 M groups. P < 0.01; P < 0.001. Values are shown as mean ± SD.
Figure 13
Figure 13
Immunohistochemistry for 8-OHdG. (a) Representative images of immunohistochemistry for 8-OHdG (original magnification, 400x). (b) There was marked increase in the 8-OHdG-positive area in the 24 M group (3.47 ± 1.34%) compared with 2 M group (0.48 ± 0.28%) and 12 M group (1.67 ± 1.97%). P < 0.001. Values are shown as mean ± SD.
Figure 14
Figure 14
Immunohistochemistry for 3-nitrotyrosine. (a) Representative images of immunohistochemistry for 3-nitrotyrosine (original magnification, 400x). (b) There was marked increase in the 3-nitrotyrosine-positive area in the 24 M group (3.02 ± 1.18%) compared with 2 M group (0.06 ± 0.03%) and 12 M group (0.56 ± 0.22%). P < 0.05; P < 0.001. Values are shown as mean ± SD.

References

    1. Lakatta E. G., Levy D. Arterial and cardiac aging: major shareholders in cardiovascular disease enterprises: Part I: aging arteries: a “set up” for vascular disease. Circulation. 2003;107(1):139–146. doi: 10.1161/01.cir.0000048892.83521.58. - DOI - PubMed
    1. Lakatta E. G. Arterial and cardiac aging: Major shareholders in cardiovascular disease enterprises. Part III: cellular and molecular clues to heart and arterial aging. Circulation. 2003;107(3):490–497. doi: 10.1161/01.cir.0000048894.99865.02. - DOI - PubMed
    1. Kovacic J. C., Moreno P., Nabel E. G., Hachinski V., Fuster V. Cellular senescence, vascular disease, and aging: part 2 of a 2-part review: clinical vascular disease in the elderly. Circulation. 2011;123(17):1900–1910. doi: 10.1161/circulationaha.110.009118. - DOI - PubMed
    1. Yoon H. E., Choi B. S. The renin-angiotensin system and aging in the kidney. Korean Journal of Internal Medicine. 2014;29(3):291–295. doi: 10.3904/kjim.2014.29.3.291. - DOI - PMC - PubMed
    1. Conti S., Cassis P., Benigni A. Aging and the renin-angiotensin system. Hypertension. 2012;60(4):878–883. doi: 10.1161/HYPERTENSIONAHA.110.155895. - DOI - PubMed

MeSH terms

LinkOut - more resources