

Estimating Active Transportation Behaviors to Support Health Impact Assessment in the United States
- PMID: 27200327
- PMCID: PMC4852202
- DOI: 10.3389/fpubh.2016.00063
Estimating Active Transportation Behaviors to Support Health Impact Assessment in the United States
Abstract
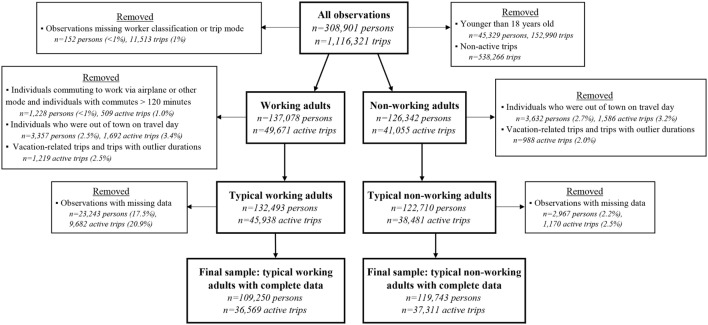
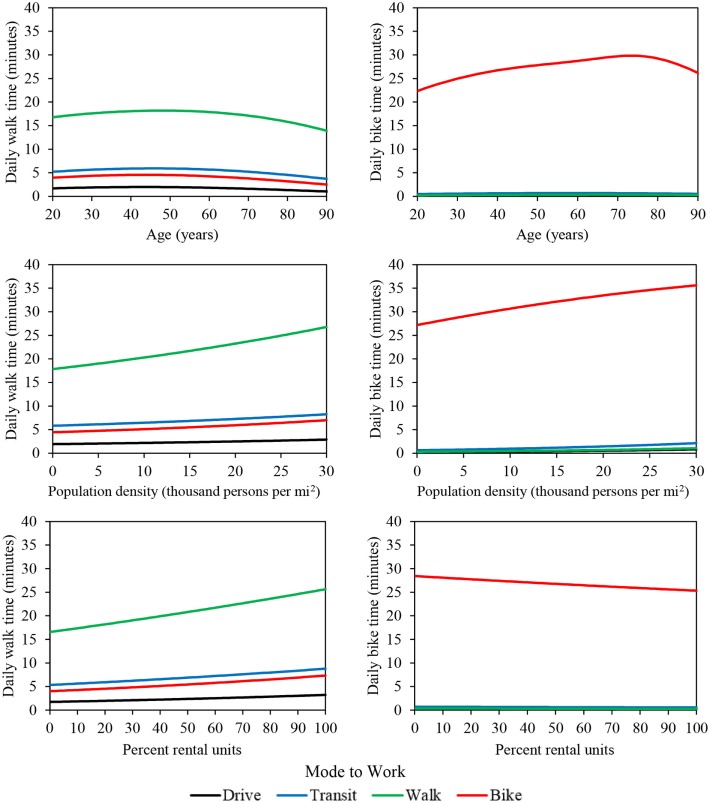
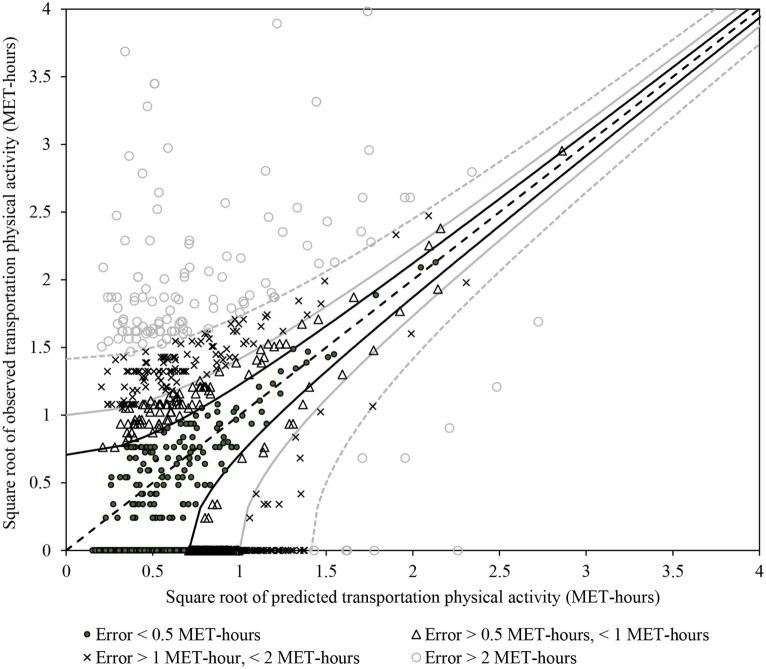
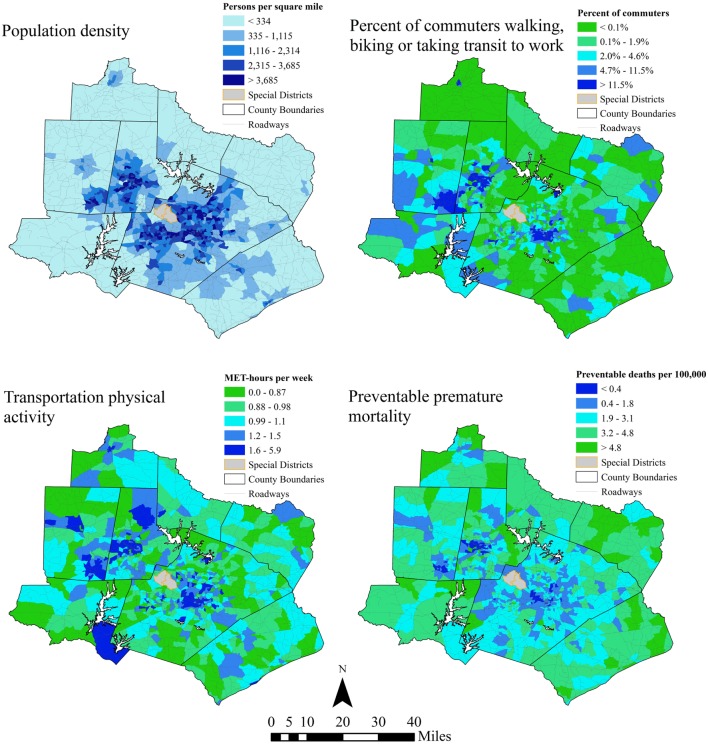
Health impact assessment (HIA) has been promoted as a means to encourage transportation and city planners to incorporate health considerations into their decision-making. Ideally, HIAs would include quantitative estimates of the population health effects of alternative planning scenarios, such as scenarios with and without infrastructure to support walking and cycling. However, the lack of baseline estimates of time spent walking or biking for transportation (together known as "active transportation"), which are critically related to health, often prevents planners from developing such quantitative estimates. To address this gap, we use data from the 2009 US National Household Travel Survey to develop a statistical model that estimates baseline time spent walking and biking as a function of the type of transportation used to commute to work along with demographic and built environment variables. We validate the model using survey data from the Raleigh-Durham-Chapel Hill, NC, USA, metropolitan area. We illustrate how the validated model could be used to support transportation-related HIAs by estimating the potential health benefits of built environment modifications that support walking and cycling. Our statistical model estimates that on average, individuals who commute on foot spend an additional 19.8 (95% CI 16.9-23.2) minutes per day walking compared to automobile commuters. Public transit riders walk an additional 5.0 (95% CI 3.5-6.4) minutes per day compared to automobile commuters. Bicycle commuters cycle for an additional 28.0 (95% CI 17.5-38.1) minutes per day compared to automobile commuters. The statistical model was able to predict observed transportation physical activity in the Raleigh-Durham-Chapel Hill region to within 0.5 MET-hours per day (equivalent to about 9 min of daily walking time) for 83% of observations. Across the Raleigh-Durham-Chapel Hill region, an estimated 38 (95% CI 15-59) premature deaths potentially could be avoided if the entire population walked 37.4 min per week for transportation (the amount of transportation walking observed in previous US studies of walkable neighborhoods). The approach developed here is useful both for estimating baseline behaviors in transportation HIAs and for comparing the magnitude of risks associated with physical inactivity to other competing health risks in urban areas.
Keywords: environment and public health; environment design; health impact assessment; transportation; walking.
Figures

References
-
- US Centers for Disease Control and Prevention. Physical Activity Guidelines for Americans. (2008). Available from: http://www.cdc.gov/physicalactivity/everyone/guidelines/index.html
LinkOut - more resources
Full Text Sources
Other Literature Sources
Miscellaneous