. 2016 May 5;1(6):e86574.
doi: 10.1172/jci.insight.86574.

Insulin decreases atherosclerosis by inducing endothelin receptor B expression

Affiliations

Insulin decreases atherosclerosis by inducing endothelin receptor B expression

Kyoungmin Park et al. JCI Insight. .

Abstract

Endothelial cell (EC) insulin resistance and dysfunction, caused by diabetes, accelerates atherosclerosis. It is unknown whether specifically enhancing EC-targeted insulin action can decrease atherosclerosis in diabetes. Accordingly, overexpressing insulin receptor substrate-1 (IRS1) in the endothelia of Apoe-/- mice (Irs1/Apoe-/-) increased insulin signaling and function in the aorta. Atherosclerosis was significantly reduced in Irs1/ApoE-/- mice on diet-induced hyperinsulinemia and hyperglycemia. The mechanism of insulin's enhanced antiatherogenic actions in EC was related to remarkable induction of NO action, which increases endothelin receptor B (EDNRB) expression and intracellular [Ca2+]. Using the mice with knockin mutation of eNOS, which had Ser1176 mutated to alanine (AKI), deleting the only known mechanism for insulin to activate eNOS/NO pathway, we observed that IRS1 overexpression in the endothelia of Aki/ApoE-/- mice significantly decreased atherosclerosis. Interestingly, endothelial EDNRB expression was selectively reduced in intima of arteries from diabetic patients and rodents. However, endothelial EDNRB expression was upregulated by insulin via P13K/Akt pathway. Finally EDNRB deletion in EC of Ldlr-/- and Irs1/Ldlr-/- mice decreased NO production and accelerated atherosclerosis, compared with Ldlr-/- mice. Accelerated atherosclerosis in diabetes may be reduced by improving insulin signaling selectively via IRS1/Akt in the EC by inducing EDNRB expression and NO production.


Figures

Figure 1
Figure 1. Effect of endothelial overexpression of IRS1 on vascular insulin sensitivity.
(A) Schematic representation of IRS1 Tg. IB of IRS1 expression levels in aorta and lung. (B) IRS1 mRNA levels in muscle and aorta. (C) IB and densitometry of p-Akt protein levels in EC after insulin stimulation. (D) IB of p-Akt levels in VSMC. (E and F) IB and densitometry of p-Akt and p-eNOS levels in EC. The IBs are representative of 3 separate experiments that gave similar results. (G and H) IB and densitometry of p-Akt and p-eNOS protein levels in aortas from Apoe–/– and Irs1/Apoe–/– mice treated with insulin. IBs are representative of 3 separate experiments that gave similar results. Data are represented as mean ± SEM of at least 3 separate experiments. **P < 0.01 (2-way ANOVA for multiple comparisons involving 2 factorial variables and 2-tailed Student’s t test for pairwise comparisons).
Figure 2
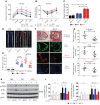
Figure 2. Analysis of the extent of atherosclerosis and its complexity in Irs1/Apoe–/– mice fed RD, WD, or HFD.
(A) i.p. GTTs were performed in Apoe–/– (n = 8) and Irs1/Apoe–/– mice (n = 8). Time-course measurements of blood glucose and insulin from the same experiment are shown. This experiment was repeated 3 times in 2 different cohorts of mice. (B) i.p. ITTs were performed in Apoe–/– (n = 8) and Irs1/Apoe–/– mice (n = 8). (C) Fasting insulin in mice fed RD, WD, or HFD (n = 8 per group). P < 0.01 for main effect of diet. (D and E) En face staining and quantification of aortas from mice with the indicated genotypes as a percentage of the lesion area in Apoe–/– (n = 10) and Irs1/Apoe–/– mice fed HFD (n = 10). Original magnification, ×2. (F and G) Representative examples and quantification of cross sections from the aortic sinus stained with trichrome, α actin, and MAC2. Original magnification, ×4; scale bar: 100 μm. (H and I) IB and quantification of insulin signaling and p-eNOS in aortas isolated after intravenous insulin injection from mice fed RD, WD, or HFD for 12 weeks (n = 5 per group). All data are represented as mean ± SEM of at least 5 mouse replicates. *P < 0.05, **P < 0.01 (mixed effects model for repeated measurement; 2-way/3-way ANOVA for multiple comparisons involving 2/3 factorial variables and 2-tailed Student’s t test for pairwise comparisons).
Figure 3
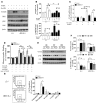
Figure 3. Characterization of VCAM1 expression, leukocyte-endothelial adhesion, and macrophage accumulation in the atherosclerotic lesions.
(A and B) IB and densitometry of VCAM1 and p-Akt levels in EC isolated from E–/– and IRS1/E–/– mice after exposure to ox-LDL for 6 hours in the absence of or presence of insulin treatment. The data are the mean ± SEM of triplicate samples from 3 separate experiments. Under same condition as (A), (C) VCAM1 mRNA expression was measured in ox-LDL-treated EC. (D) Specific binding of fluorescent-labeled monocytes to EC isolated from E–/– and IRS1/E–/– mice after exposure to ox-LDL for 6 hours. (E and F) IB and densitometry of VCAM1 and p-Akt in aortas from Apoe–/– and Irs1/Apoe–/– mice fed WD or HFD for 12 weeks. Results from 3 representative mice are shown for each genotype. (G) Leukocyte levels in whole aortas and thoracic and abdominal aortic lesions of Apoe–/– (n = 6) and Irs1/Apoe–/– mice (n = 6), as assessed by flow cytometry. Data are represented as mean ± SEM of at least 5 mouse replicates or cellular replicates for VCAM1 expression and leukocyte-endothelial binding experiments. *P < 0.05, **P < 0.01 (2-way/3-way ANOVA for multiple comparisons involving 2/3 factorial variables and 2-tailed Student’s t test for pairwise comparisons).
Figure 4
Figure 4. Differential regulation and expression of EDNRB in EC versus VSMC from diabetic patients and rodents.
(A) IB of EDNRB in aortas from Apoe–/– and Irs1/Apoe–/– mice fed WD or HFD for 12 weeks. (B) EDNRB mRNA expression in aortic endothelia and in VSMC from Irs1/Apoe–/– (n = 5 per group) and Apoe–/– mice (n = 5 per group) on WD or HFD. Basal (RD) mRNA expression in Apoe–/– mice was set to 1. (C) Quantitative EDNRB mRNA expression in media and intima of human mammary arteries from obese patients with (n = 5) or without diabetes (n = 5). (DF) IB and quantification of EDNRB in EC after insulin stimulation with (E) dose- or (F) time-dependent manner. Data are represented as mean ± SEM of at least 5 mouse replicates or cellular replicates for EDNRB expression experiments. *P < 0.05, **P < 0.01 (2-way ANOVA for multiple comparisons involving 2 factorial variables and 2-tailed Student’s t test for pairwise comparisons).
Figure 5
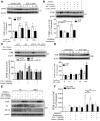
Figure 5. Differential contribution of the PI3K or Erk pathway to EDNRB expression in EC versus VSMC.
(A) IB and quantification of EDNRB protein levels in EC from Apoe–/– and Irs1/Apoe–/– mice with increasing doses of insulin or IGF1. (B) IB and quantification of EDNRB protein levels in EC with the addition of PI3K inhibitor (wortmannin) and MEK inhibitor (PD98059) either alone or in combination. (C) IB and quantification of EDNRB protein levels in EC following insulin or IGF1 treatment after knockdown of IR, IGF1R, or IR plus IGF1R. (D) IB and quantification of EDNRB protein levels in IGF1-treated VSMC. (E and F) IB of EDNRB protein levels in IGF1-treated VSMC with the combination of wortmannin and PD98059. Data are represented as mean ± SEM of at least 4 cellular replicates for EDNRB expression experiments in EC or VSMC. *P < 0.05, **P < 0.01 (2-way/3-way ANOVA for multiple comparisons involving 2/3 factorial variables and 2-tailed Student’s t test for pairwise comparisons).
Figure 6
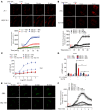
Figure 6. NO production in EC from Irs1/Apoe–/– mice and its relationship to EDN1 and EDNRB.
(A) EDN1-induced NO production in the aortic EC from Irs1/Apoe–/– and Apoe–/– mice. NO production was visualized by DAF-2DA fluorescence intensity (FI) and quantified. Original magnification, ×15; scale bar: 5 μm. (B) EDN1-induced NO production in insulin-stimulated aortic EC from Apoe–/– and Irs1/Apoe–/– mice pretreated with BQ-788 (0.1 mM) or L-NAME (0.5 mM). NO production was visualized by DAF-2DA and quantified. Original magnification, ×20; scale bar: 5 μm. (C) Nω-nitro-L-arginine–sensitive accumulation of cGMP in VSMC from Apoe–/– and Irs1/Apoe–/– mice stimulated with EDN1 pretreated with BQ-788 or L-NAME. (D) Accumulation of cGMP in aortas from WD- or HFD-fed Apoe–/– and Irs1/Apoe–/– mice. (E and F) Ca2+ accumulation was visualized and quantified by Fluor-4 in EC. Original magnification, ×15; scale scale bar: 5 μm. Data are represented as mean ± SEM of at least 5 cellular replicates for NO production experiments in EC and cGMP experiments in VSMC. **P < 0.01 (3-way ANOVA for multiple comparisons involving 3 factorial variables and 2-tailed Student’s t test for pairwise comparisons).
Figure 7
Figure 7. Characterization of NO production in EC from Irs1/Aki/Apoe–/– mice with mutated eNOS Ser to Ala at 1176 (AKI).
(A) IB and densitometry of p-eNOS in aortas of Apoe–/–, Aki/Apoe–/–, and Irs1/Aki/Apoe–/– mice. (B and C) En face staining and quantification of aortas from Apoe–/– (n = 5), Aki/Apoe–/– (n = 7), and Irs1/Aki/Apoe–/– (n = 8) mice fed on HFD. (D) Representative example (upper) and quantification (lower) of cross-sections from the aortic sinus stained with GALECTIN-3. A higher magnification (×4) and scale bar: 100 μm. Data are represented as mean ± SEM of at least 5 mouse replicates or least 5 cellular replicates for NO production experiments. P < 0.05, P < 0.01 (1-way/2-way ANOVA for multiple comparisons involving 1 or 2 factorial variables and 2-tailed Student’s t-test for pairwise comparisons).
Figure 8
Figure 8. Effect of mutated eNOS (AKI) on HFD-induced oxidative stress in the aorta.
(A) IB and (B) densitometry of NT levels in aortas of Apoe–/– (n = 3), Aki/Apoe–/– (n = 6), and Irs1/Aki/Apoe–/– (n = 6) mice fed HFD. (C) Staining and (D) fluorescent density of DHE in aortas under the same conditions as in A. Original magnification, ×10; scale bar: 100 μm. Results are mean ± SEM of at least 5 mouse replicates. P < 0.05, P < 0.01 (1-way ANOVA for multiple comparisons involving 1 factorial variable and 2-tailed Student’s t test for pairwise comparisons).
Figure 9
Figure 9. Effect of endothelial EDNRB signaling on atherosclerosis in Ldlr–/– mice.
(A) IB of EDNRB protein levels in EC from Ldlr–/– (n = 6), Ednrb–/–/Ldlr–/– (n = 6), and Irs1/Ednrb–/–/Ldlr–/– mice (n = 6). EDNRB and p-Akt expression were separately blotted in different gels. (B) Representative en face staining and (C) quantification of lesion area in aortas in Ldlr–/– (n = 6), Ednrb–/–/Ldlr–/– (n = 6), and Irs1/Ednrb–/–/Ldlr–/– (n = 6) mice 16 weeks after HFD (n = 6). Original magnification, ×2. (D) Histological analysis and (E) quantification of cross sections from the aortic sinus stained with trichrome and immunostained with anti-MAC2. Original magnification, ×4; scale bar: 100 μm. (F) IB of EDNRB in aortas from Ldlr–/– (n = 6), Ednrb–/–/Ldlr–/– (n = 6), and Irs1/Ednrb–/–/Ldlr–/– (n = 6) mice fed HFD for 16 weeks. (G) Schematic mechanism of increased NO production in EC from Irs1/Apoe–/– mice. Data are represented as mean ± SEM of at least 6 mouse replicates. P < 0.05, P < 0.01 (1-way ANOVA for multiple comparisons involving 1 factorial variable and 2-tailed Student’s t test for pairwise comparisons).

Similar articles

Cited by

References

    1. Bornfeldt KE, Tabas I. Insulin resistance, hyperglycemia, and atherosclerosis. Cell Metab. 2011;14(5):575–585. doi: 10.1016/j.cmet.2011.07.015. - DOI - PMC - PubMed
    1. Rask-Madsen C, King GL. Vascular complications of diabetes: mechanisms of injury and protective factors. Cell Metab. 2013;17(1):20–33. doi: 10.1016/j.cmet.2012.11.012. - DOI - PMC - PubMed
    1. Steinberg HO, Chaker H, Leaming R, Johnson A, Brechtel G, Baron AD. Obesity/insulin resistance is associated with endothelial dysfunction. J Clin Invest. 1996;97(11):2601–2610. doi: 10.1172/JCI118709. - DOI - PMC - PubMed
    1. Rask-Madsen C, et al. Loss of insulin signaling in vascular endothelial cells accelerates atherosclerosis in apolipoprotein E null mice. Cell Metab. 2010;11(5):379–389. doi: 10.1016/j.cmet.2010.03.013. - DOI - PMC - PubMed
    1. Tsuchiya K, et al. FoxOs integrate pleiotropic actions of insulin in vascular endothelium to protect mice from atherosclerosis. Cell Metab. 2012;15(3):372–381. doi: 10.1016/j.cmet.2012.01.018. - DOI - PMC - PubMed