. 2016 Oct;40(10):1582-1590.
doi: 10.1038/ijo.2016.96. Epub 2016 May 20.

Obesity but not high-fat diet impairs lymphatic function

Affiliations

Obesity but not high-fat diet impairs lymphatic function

G D García Nores et al. Int J Obes (Lond). 2016 Oct.

Abstract

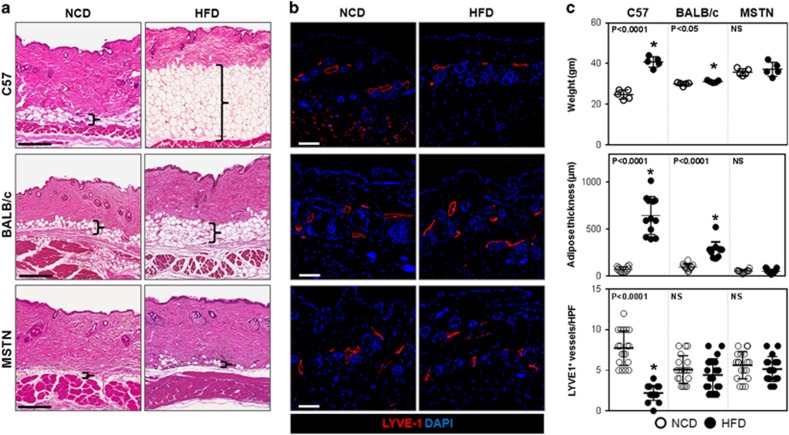
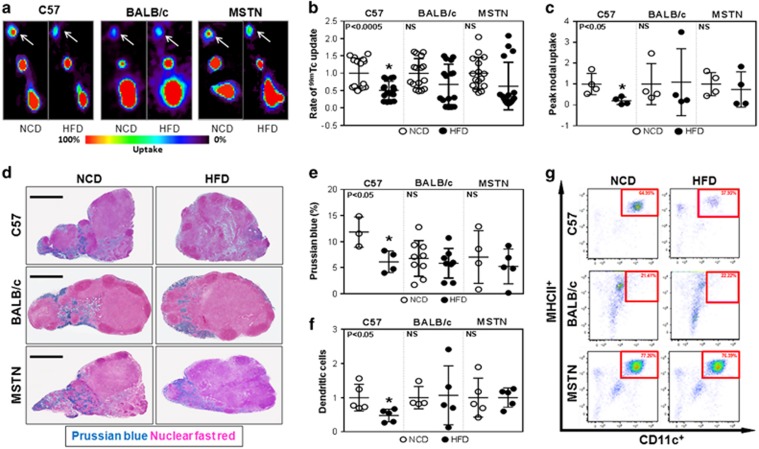
Background/objectives: High-fat diet (HFD)-induced obesity has significant negative effects on lymphatic function, but it remains unclear whether this is a direct effect of HFD or secondary to adipose tissue deposition.

Methods: We compared the effects of HFD on obesity-prone and obesity-resistant mice and analyzed lymphatic function in vivo and in vitro.

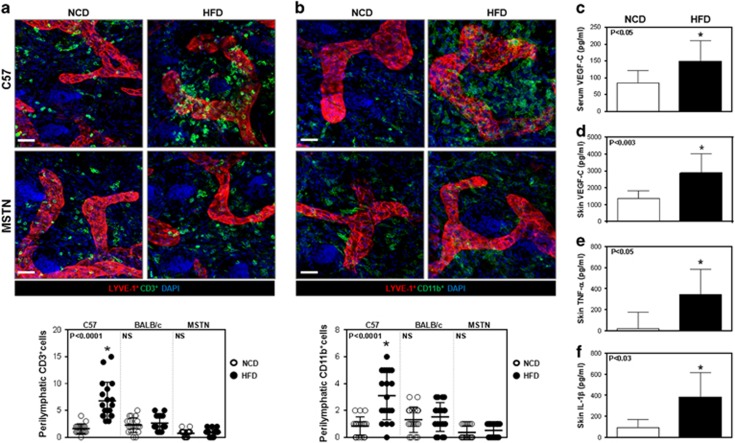
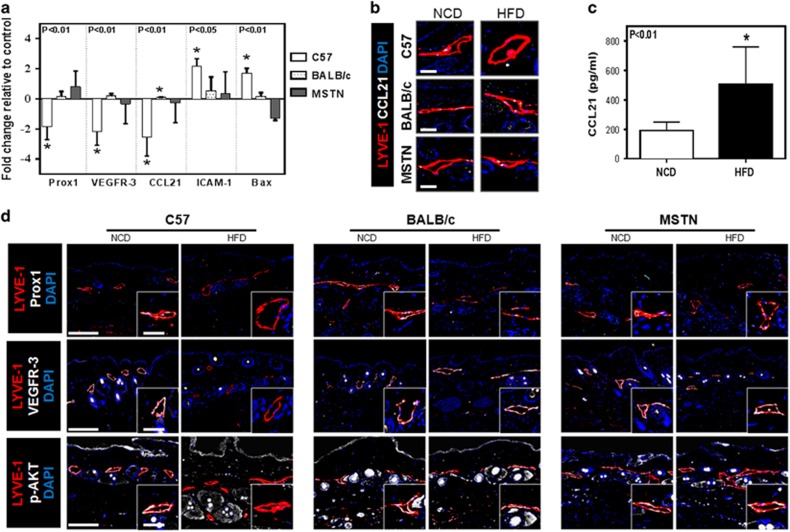
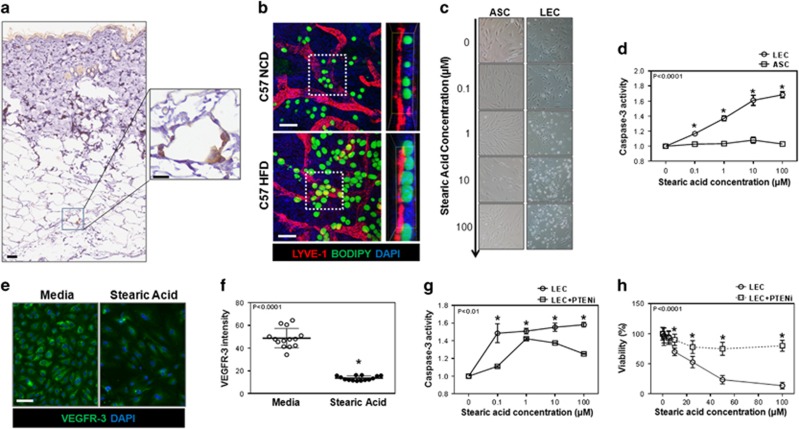
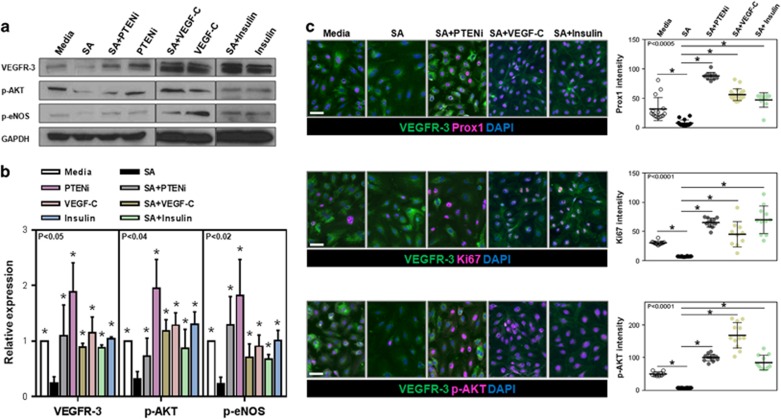
Results: Only obesity-prone mice had impaired lymphatic function, increased perilymphatic inflammation and accumulation of lipid droplets surrounding their lymphatic endothelial cells (LECs). LECs isolated from obesity-prone mice, in contrast to obesity-resistant animals, had decreased expression of VEGFR-3 and Prox1. Exposure of LECs to a long-chain free fatty acid increased cellular apoptosis and decreased VEGFR-3 expression, while inhibition of intracellular inhibitors of VEGFR-3 signaling pathways increased cellular viability.

Conclusions: Collectively, our studies suggest that HFD-induced obesity decreases lymphatic function by increasing perilymphatic inflammation and altering LEC gene expression. Reversal of diminished VEGFR-3 signaling may rescue this phenotype and improve lymphatic function.


Conflict of interest statement

Competing Financial Interests: The authors declare no competing financial interests.

Figures

Figure 1
Figure 1
HFD results in decreased lymphatic vascular density in obesity-prone mice. (a) Representative H&E-stained sections of back skin from NCD- or HFD-fed C57BL/6J, BALB/cJ and MSTNln mice (scale bar=200 μm; bracket surrounds subcutaneous adipose tissues). (b) Representative immunofluorescent localization of LYVE-1+ vessels in upper limb tissues of NCD- or HFD-fed mice in all groups (scale bar=100 μm). (c) Upper panel: Body weights of mice on NCD (open circles) and HFD (filled circles) in all groups (n=5/group). C57BL/6J HFD vs NCD (*P<0.0001). BALB/cJ HFD vs NCD (*P<0.05), MSTNln mice had no significant difference. Middle panel: Quantification of subcutaneous soft tissue thickness in NCD- and HFD-fed mice in all groups (n=5–10/group). C57BL/6J HFD vs NCD (*P<0.0001). MSTNln and BALB/cJ mice show no significant difference between NCD and HFD groups. Lower panel: Quantification of upper limb LYVE-1+ lymphatic vessel density per high powered field (HPF) and quadrant in NCD- and HFD-fed mice in all groups (n=5 animals × 4HPF/group). C57BL/6J HFD vs NCD (*P<0.0001). MSTNln and BALB/cJ mice show no significant difference between NCD and HFD groups.
Figure 2
Figure 2
Obesity impairs lymphatic transport of macromolecules to draining lymph nodes. (a) Representative hindlimb 99mTc heat maps for NCD- and HFD-fed C57BL/6J, BALB/cJ and MSTNln mice. White arrows indicate the uptake in the inguinal lymph nodes (n=4/group). (b) Quantification of the rate of 99mTc uptake in inguinal lymph nodes following hindlimb injection. Data are presented as fold change relative to their NCD controls in each group (n=16/group). C57BL/6J HFD vs NCD (*P<0.0005). MSTNln and BALB/cJ had no significant difference between NCD and HFD groups. (c) Quantification of peak nodal uptake of 99mTc in inguinal lymph nodes following hindlimb injection. Data are presented as fold change relative to their NCD controls in each group (n=4/group). C57BL/6J HFD vs NCD (*P<0.05). MSTNln and BALB/cJ had no significant difference between NCD and HFD groups. (d) Representative Prussian blue-stained histological cross-sections of axillary lymph nodes harvested from NCD- or HFD-fed mice in all groups (scale bar=500 μm). (e) Quantification of Prussian blue staining as a percentage of the total lymph-node area in NCD- and HFD-fed mice (n=3–9/group). C57BL/6J HFD vs NCD (*P<0.05). MSTNln and BALB/cJ had no significant difference between NCD and HFD groups. (f) Quantification of migrating CD45.1+ DCs (MHCII+/CD11C+) in inguinal and popliteal lymph nodes of NCD- (open circles) and HFD- (filled circles) fed mice in all groups (n=5/group). Data are presented as fold change from respective NCD-fed controls. C57BL/6J HFD vs NCD (*P<0.05). MSTNln and BALB/cJ had no significant difference between NCD and HFD groups. (g) Representative dot plot graphs of inguinal/popliteal lymph node flow cytometry analyzing migrating CD45.1+ DCs in all groups. Red square surrounds DC population.
Figure 3
Figure 3
Obesity results in local tissue and perilymphatic inflammation. (a) Representative immunofluorescence co-localization (upper panel) of CD3+ cells (green) and LYVE-1+ vessels (red) in ear skin whole mounts harvested from NCD- and HFD-fed C57BL/6J and MSTNln mice. Blue stain is DAPI (scale bar=30 μm). Quantification of perilymphatic CD3+ cells in skin ear cross-sections of NCD- (open circles) and HFD- (filled circles) fed mice in all groups (lower panel). C57BL/6J HFD vs NCD (*P<0.0001, n=4 quadrants × 4–5 animals/group). MSTNln and BALB/cJ mice showed no significant difference between NCD and HFD groups. (b) Representative immunofluorescence co-localization (upper panel) of CD11b+ cells (green) and LYVE-1+ vessels (red) in ear skin whole mounts harvested from NCD- and HFD-fed C57BL/6J and MSTNln mice. Blue stain is DAPI (scale bar=30 μm). Quantification of perilymphatic CD11b+ cells in skin ear cross-sections of mice fed NCD (open circles) or HFD (filled circles) in all groups (lower panel). C57BL/6J HFD vs NCD (*P<0.0001, n=4 quadrants × 5 animals/group). MSTNln and BALB/cJ mice showed no significant difference between NCD and HFD groups. (c) Quantification of VEGF-C protein levels in serum harvested from lean and obese C57BL/6J mice (n=10/group, *P<0.05). (d) Quantification of VEGF-C protein levels in back skin tissues harvested from lean and obese C57BL/6J mice (n=6–10/group, *P<0.003). (e) Quantification of TNF-α protein levels in back skin tissues harvested from lean and obese C57BL/6J mice (n=4–6/group, *P<0.05). (f) Quantification of IL-1β protein levels in back skin tissues harvested from lean and obese C57BL/6J mice (n=5/group, *P<0.03).
Figure 4
Figure 4
Obesity downregulates expression of lymphatic markers in LECs. (a) Quantification of mRNA expression in LECs sorted from NCD- and HFD-fed mice skin tissues for all groups, demonstrating relative expression of Prox1, VEGFR-3, CCL21, ICAM-1 and Bax (n=4–6/group). Data are presented as fold change relative to the NCD-fed controls in all groups. Note the downregulation of Prox1, VEGFR-3 and CCL21 (*P<0.01 for all) and the upregulation of ICAM-1 (*P<0.05) and Bax (*P<0.01) in obese C57BL/6J when compared with their lean controls. (b) Representative immunofluorescent localization of LYVE-1+(red) and CCL21+(white) in NCD- and HFD-fed mice in all groups (DAPI is blue; scale bar=25 μm). (c) Quantification of CCL21 protein levels in hindlimb tissues harvested from lean and obese C57BL/6J mice (n=6–8/group, *P<0.01). (d) Representative low and high power (dashed box shown in lower right inset) immunofluorescent localization of LYVE-1+ cells (red) and Prox1 (top, white), VEGFR-3 (middle, white) and p-AKT (bottom, white) (DAPI nuclear stain is blue; scale bars=50 and 25 μm).
Figure 5
Figure 5
Obesity results in accumulation of large lipid droplets around lymphatic vessels. (a) Representative low (left) and high power (right) immunohistological localization of CD45+ cells (brown) surrounding adipocytes (white) in back skin of obese C57BL/6J mice (scale bars=100 and 25 μm, respectively). (b) Representative immunofluorescent localization (left) and orthoslice (right) from daughter region (white dotted square) of LYVE+ cells (red), BODIPY+ lipids (green) and nuclear DAPI stain (blue), in whole mount ear tissues of NCD- or HFD-fed C57BL/6J mice (scale bar=20 μm). (c) Representative bright-field images showing LECs (top) and ASCs (bottom) cultured in media containing increasing concentrations of SA for 12 h. (d) Quantification of caspase-3 activity in LECs (circles) and ASCs (squares) after treatment with SA for 12 h (n=3–5/group, *P<0.0001). (e) Representative immunofluorescent localization of VEGFR-3 expression (green) in LECs cultured with 10 μm of SA for 12 h (DAPI nuclear stain is shown in blue, scale bar=25 μm). (f) Quantification of VEGFR-3 expression intensity in LECs cultured in media (open circle) or media with 10 μm SA (closed circle) for 12 h (n=14/group, *P<0.0001). (g) Quantification of caspase-3 activity in LECs cultured with media containing SA (circle) or SA with 0.3 nm PTENi (square) for 12 h (n=3/group, *P<0.01). (h) Quantification of LEC viability treated with media containing SA or SA with 0.3 nm PTENi for 12 h (n=12/group, *P<0.0001).
Figure 6
Figure 6
Exposure of LECs to SA in vitro downregulates expression of VEGFR-3 and its downstream mediators. (a, b) Representative western blot images (a) for VEGFR-3, p-AKT, p-eNOS and quantification (b) normalized to GAPDH expression of total cellular protein harvested from LECs treated with 1 μm SA, 10 μm SA+0.3 nm PTENi, PTENi (0.3 nm), SA+100 ng ml−1 VEGF-C, VEGF-C (100 ng ml−1), SA+100 nm insulin or insulin (100 nm) (n=4–5/group, *P<0.05 for all antibodies). (c) Left panels: Representative immunofluorescent co-localization of VEGFR-3 (green) and Prox1, Ki67 and p-AKT (all shown in pink) in LECs cultured in control media, media containing 10 μm SA, media containing 10 μm SA with PTENi (0.3 nm), 10 μm SA with VEGF-C (100 ng ml−1) or 10 μm SA with insulin (100 nm) for 12 h (scale bar=25 μm). Right panels: Quantification of expression of Prox1, Ki67 and p-AKT in groups shown in the left panels (n=10–15/group, *P<0.0005).

References

    1. Ogden CL, Carroll MD, Kit BK, Flegal KM. Prevalence of childhood and adult obesity in the United States, 2011-2012. JAMA 2014; 311: 806–814. - PMC - PubMed
    1. Cawley J, Meyerhoefer C. The medical care costs of obesity: an instrumental variables approach. J Health Econ 2012; 31: 219–230. - PubMed
    1. Ross R. Atherosclerosis—an inflammatory disease. N Engl J Med 1999; 340: 115–126. - PubMed
    1. Lumeng CN, Bodzin JL, Saltiel AR. Obesity induces a phenotypic switch in adipose tissue macrophage polarization. J Clin Invest 2007; 117: 175–184. - PMC - PubMed
    1. Hajer GR, van Haeften TW, Visseren FL. Adipose tissue dysfunction in obesity, diabetes, and vascular diseases. Eur Heart J 2008; 29: 2959–2971. - PubMed

Publication types

MeSH terms

Substances