. 2016 Jun 21;7(25):38164-38179.
doi: 10.18632/oncotarget.9416.

Quantitation of TGF-β proteins in mouse tissues shows reciprocal changes in TGF-β1 and TGF-β3 in normal vs neoplastic mammary epithelium

Affiliations

Quantitation of TGF-β proteins in mouse tissues shows reciprocal changes in TGF-β1 and TGF-β3 in normal vs neoplastic mammary epithelium

Kathleen C Flanders et al. Oncotarget. .

Abstract

Transforming growth factor-βs (TGF-βs) regulate tissue homeostasis, and their expression is perturbed in many diseases. The three isoforms (TGF-β1, -β2, and -β3) have similar bioactivities in vitro but show distinct activities in vivo. Little quantitative information exists for expression of TGF-β isoform proteins in physiology or disease. We developed an optimized method to quantitate protein levels of the three isoforms, using a Luminex® xMAP®-based multianalyte assay following acid-ethanol extraction of tissues. Analysis of multiple tissues and plasma from four strains of adult mice showed that TGF-β1 is the predominant isoform with TGF-β2 being ~10-fold lower. There were no sex-specific differences in isoform expression, but some tissues showed inter-strain variation, particularly for TGF-β2. The only adult tissue expressing appreciable TGF-β3 was the mammary gland, where its levels were comparable to TGF-β1. In situ hybridization showed the luminal epithelium as the major source of all TGF-β isoforms in the normal mammary gland. TGF-β1 protein was 3-8-fold higher in three murine mammary tumor models than in normal mammary gland, while TGF-β3 protein was 2-3-fold lower in tumors than normal tissue, suggesting reciprocal regulation of these isoforms in mammary tumorigenesis.

Keywords: TGF-β isoforms; mammary gland; mouse tissues; protein; quantitation.


Conflict of interest statement

The authors declare that they have no potential conflicts of interest.

Figures
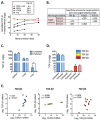
Figure 1
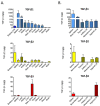
Figure 1. Optimization and characterization of TGF-β 1, 2, and 3 multiplex assay for tissue extracts
A. Frozen mouse kidney was lysed in RIPA, T-PER or Tris buffer and a portion of the RIPA extract was further treated with acid-ethanol (AE), dialyzed and lyophilized as described in Methods. TGF-β1 levels were measured in extracts prepared by the different methods at 4 different sample dilutions. The calculated TGF-β1 concentration in the original tissue sample is plotted for each dilution. Ideally, results should be independent of sample dilution. CV (%) represents the coefficient of variation across the dilutions for each extraction method. B. Estimation of assay specificity using a high concentration (50 ng/ml TGF-β1, 25 ng/ml TGF-β2 and 92 ng/ml TGF-β3) of the purified non-target TGF-β isoforms to assess cross-reactivity. C. TGF-β1 levels in tissues isolated from untreated or transcardially-perfused BALB/c mice. Values are mean ± standard deviation (n=4/tissue) *p<0.05. D. TGF-β isoform levels in 4T1 mammary tumors harvested from mice that underwent cardiac perfusion or mice that were not perfused. Values are mean ± standard deviation (n=5). E. Correlation of TGF-β isoform protein levels with TGF-β mRNA levels for 12 different murine tumor models. Results are plotted as the median value of each parameter for each model. The Pearson correlation coefficient (r) and p-value for the correlation are given.
Figure 2
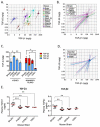
Figure 2. TGF-β isoforms in tissues from BALB/c mice
A. TGF-β1, 2, and 3 were quantitated by multiplex assay from acid-ethanol extracts of tissues from 9 wk old female BALB/c mice, or from 15 d gestation BALB/c embryos. Values are mean ± standard deviation (n=4/tissue). B. In an independent experiment, select immune/hematopoietic tissues were assessed as in (A). The dotted lines indicate the assay detection limit.
Figure 3
Figure 3. Comparison of TGF-β isoform levels in 4 mouse strains
A. Visualization of differences in TGF-β1 and TGF-β2 expression in nine individual tissues and plasma. Values for the day 15 gestation BALB/c embryo and adult BALB/c ovary are shown for comparison. Circles represent the centroids for each tissue, and rays connect to individual data points for replicate tissue samples (n=4) from all four strains. Centroids for ovary and mammary gland are overlapping. Please note the differences in the scale of the x and y axes. B. Visualization of overall differences in TGF-β1 and -β2 between 4 strains of mice. Circles represent the centroids for each strain and rays connect to data points for individual tissue samples for each strain. Data from all nine tissues and plasma (n=4 replicates/tissue/strain) were used to calculate the strain centroids. Please note the differences in the scale of the x and y axes. C. Stackplots showing levels of TGF-β1 (blue), TGF-β2 (yellow), and TGF-β3 (red) in kidney and mammary gland (n=4 per tissue) in 9 wk old female mice from 4 different strains. Values are mean ± standard deviation. p-values are for differences in total TGF-β levels between strains. *p<0.05,** p<0.01; one-way ANOVA with Tukey's multiple comparison test. D. Visualization of overall differences in TGF-β1 and -β2 levels between male and female FVB/N mice. Circles represent the centroids for each sex, and rays connect to data points for individual tissue samples for each sex. Data from seven tissues and plasma (n=4 replicates/tissue/sex) were used to calculate the centroids. Please note the differences in the scale of the x and y axes. E. Levels of TGF-β1 and -β2 in plasma from 4 mouse strains (n=6). Values are mean ± standard deviation. ** p<0.01, ***p<0.001; one-way ANOVA with Tukey's multiple comparison test.
Figure 4
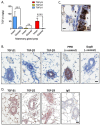
Figure 4. TGF-β isoform expression in the normal mammary gland of BALB/c mice
A. Levels of TGF-β1 (blue), TGF-β2 (yellow), and TGF-β3 (red) in intact (solid bars) or cleared (cross-hatched bars) mammary glands from BALB/c mice (n=4 for intact and n=7 for cleared). Values are mean ± standard deviation. **p<0.01, ***p<0.001, ****p<0.0001; unpaired t-test. B. In situ hybridization using probes for the indicated molecules in a virgin mammary gland from an adult BALB/c mouse. Brown dots indicate positive signal. Cyclophilin B/PPIB and DapB (bacterial dihydropicolinate reductase) were used as positive and negative controls. Bar = 25 μm. C. Higher magnification view of in situ hybridization for TGF-β3 in a virgin mammary gland from an adult BALB/c mouse. “L” is the luminal side of the gland and “B” is the basal side. Arrow points to a myoepithelial cell. Bar = 10μm. D. Immunohistochemistry using antibodies for the indicated molecules in a virgin mammary gland from an adult BALB/c mouse. Brown staining indicates positive signal. Normal rabbit IgG (IgG) was used as a negative control. Bar = 25 μm.
Figure 5
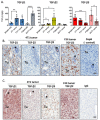
Figure 5. TGF-β isoform expression in mouse mammary tumors
A. Quantitation of TGF-β1, 2, and 3 protein in mouse mammary tumors compared with the normal mammary gland of the appropriate strain. Values are mean ± standard deviation. *p<0.05, **p<0.01, ****p<0.0001; unpaired t-test vs normal mammary gland. B. In situ hybridization using probes for the indicated molecules in 4T1 and F311 mammary tumors. “Tu” marks area of tumor while * marks an engulfed mammary duct. Cyclophilin B/PPIB and DapB (bacterial dihydropicolinate reductase) were used as positive and negative controls. Bar = 25 μm C. Immunohistochemistry using antibodies for the indicated molecules in 4T1 and F311 mammary tumors. “Tu” marks area of tumor while * marks an engulfed mammary duct. IgG indicates the negative control. Bar = 25 μm.

References

    1. Massague J. TGFbeta signalling in context. Nat Rev Mol Cell Biol. 2012;13:616–30. - PMC - PubMed
    1. Gordon KJ, Blobe GC. Role of transforming growth factor-beta superfamily signaling pathways in human disease. Biochim Biophys Acta. 2008;1782:197–228. - PubMed
    1. Akhurst RJ, Hata A. Targeting the TGFbeta signalling pathway in disease. Nat Rev Drug Discov. 2012;11:790–811. - PMC - PubMed
    1. Robertson IB, Rifkin DB. Unchaining the beast; insights from structural and evolutionary studies on TGFbeta secretion, sequestration, and activation. Cytokine Growth Factor Rev. 2013;24:355–72. - PMC - PubMed
    1. Hinck AP, O'Connor-McCourt MD. Structures of TGF-beta receptor complexes: implications for function and therapeutic intervention using ligand traps. Curr Pharm Biotechnol. 2011;12:2081–98. - PubMed

MeSH terms

Substances

LinkOut - more resources