. 2016 May 20;11(5):e0155868.
doi: 10.1371/journal.pone.0155868. eCollection 2016.

Fluctuations in Blood Marginal Zone B-Cell Frequencies May Reflect Migratory Patterns Associated with HIV-1 Disease Progression Status

Affiliations

Fluctuations in Blood Marginal Zone B-Cell Frequencies May Reflect Migratory Patterns Associated with HIV-1 Disease Progression Status

Julie Gauvin et al. PLoS One. .

Abstract

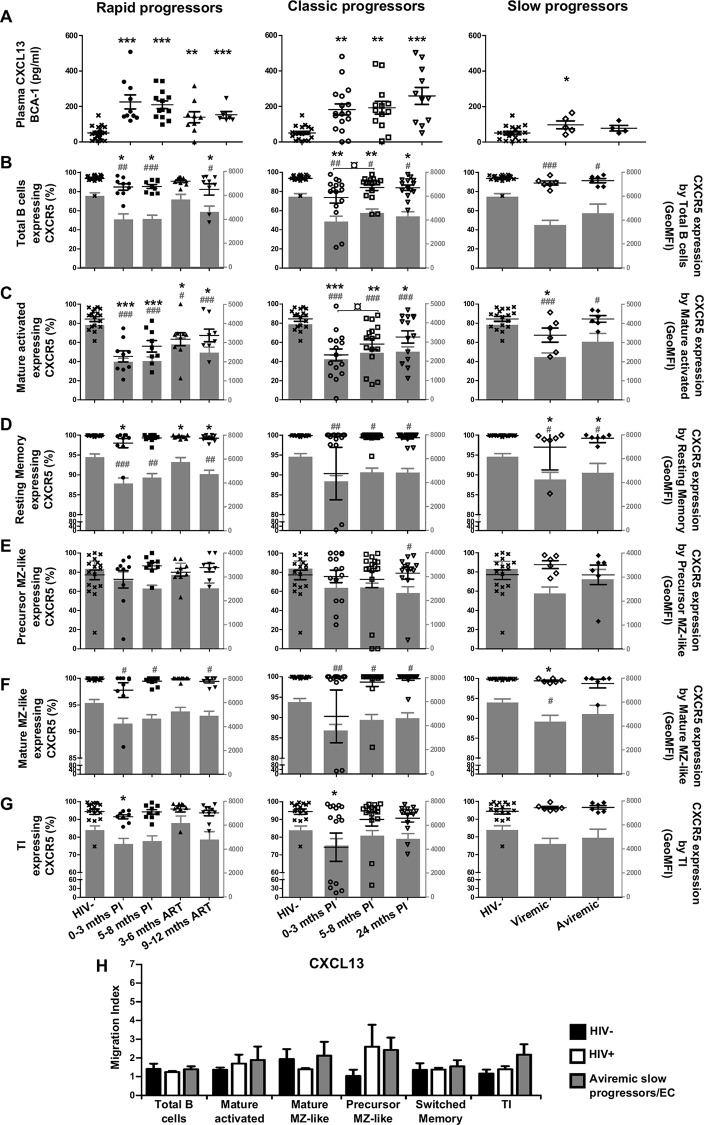
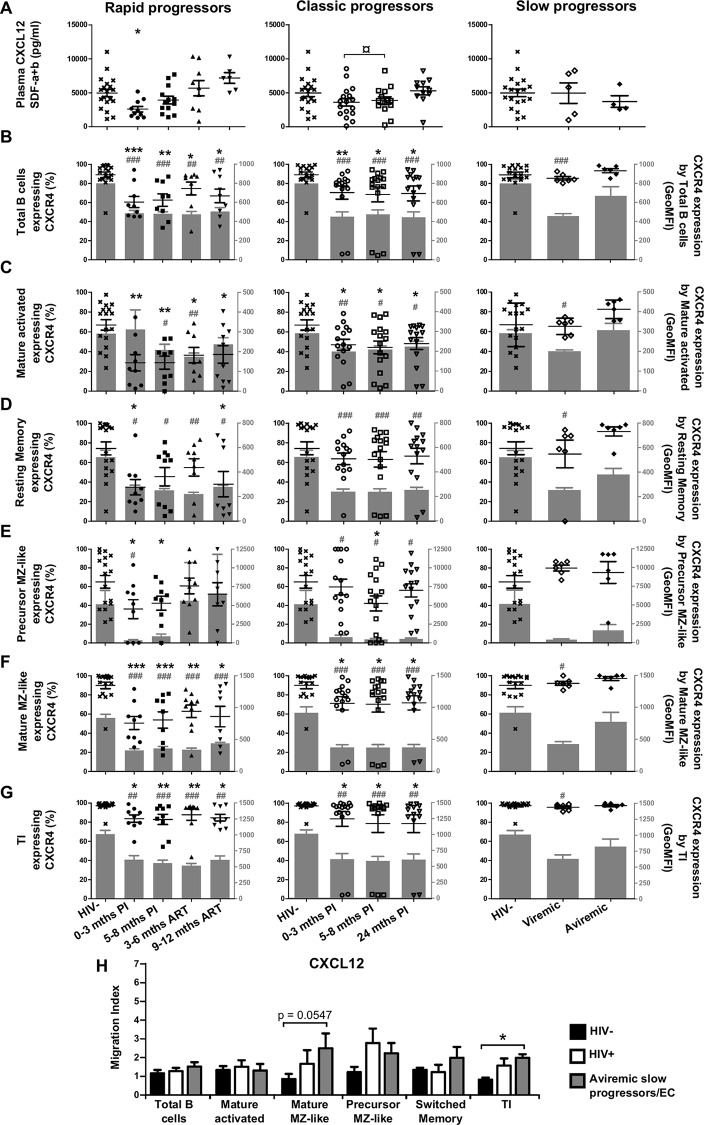
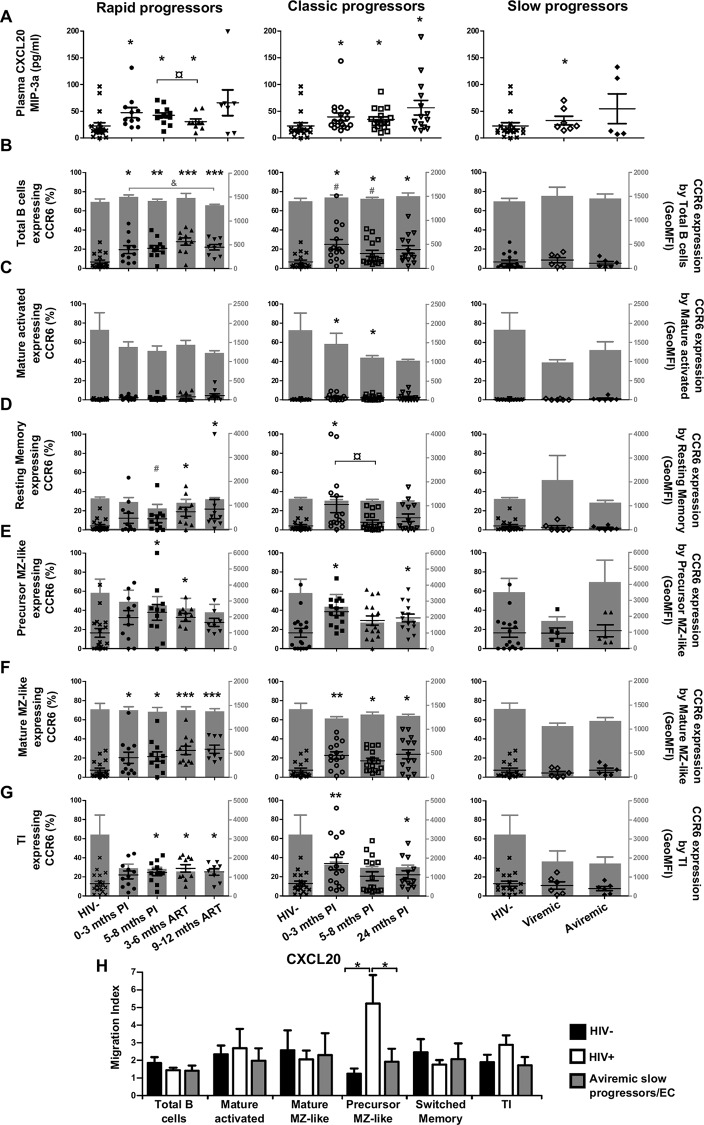
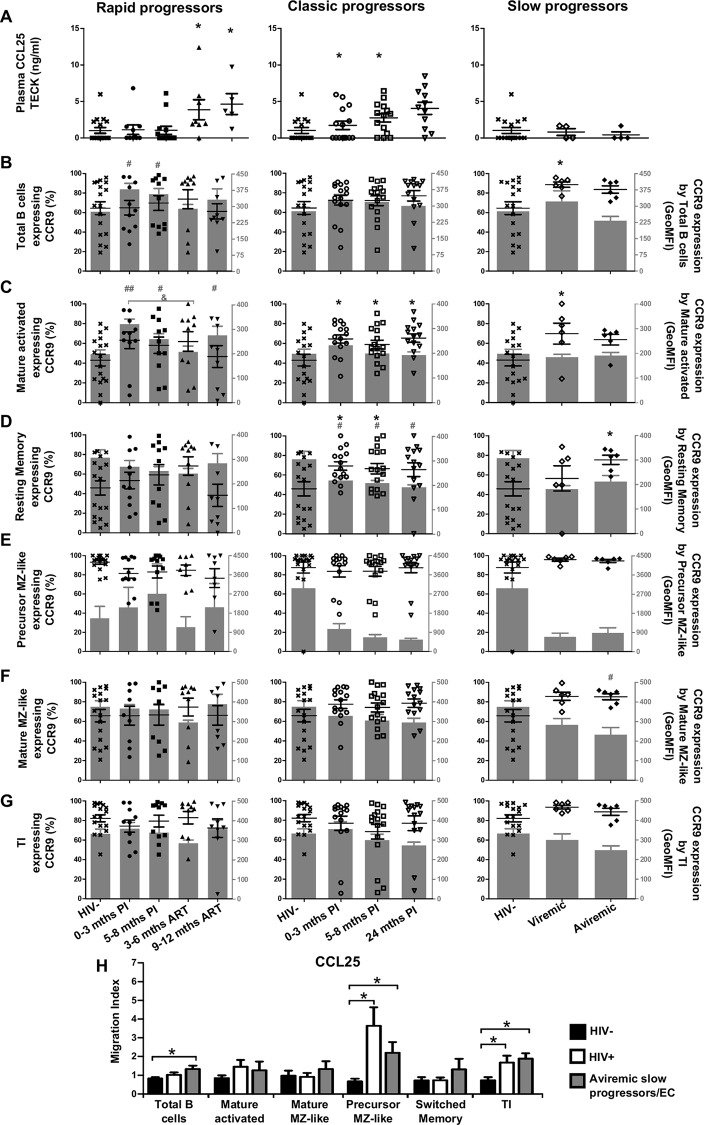
We have previously shown that overexpression of BLyS/BAFF was associated with increased relative frequencies of innate "precursor" marginal zone (MZ)-like B-cells in the blood of HIV-1-infected rapid and classic progressors. However, along with relatively normal BLyS/BAFF expression levels, these cells remain unaltered in elite-controllers (EC), rather, percentages of more mature MZ-like B-cells are decreased in the blood of these individuals. Fluctuations in frequencies of blood MZ-like B-cell populations may reflect migratory patterns associated with disease progression status, suggesting an important role for these cells in HIV-1 pathogenesis. We have therefore longitudinally measured plasma levels of B-tropic chemokines by ELISA-based technology as well as their ligands by flow-cytometry on blood B-cell populations of HIV-1-infected individuals with different rates of disease progression and uninfected controls. Migration potential of B-cell populations from these individuals were determined by chemotaxis assays. We found important modulations of CXCL13-CXCR5, CXCL12-CXCR4/CXCR7, CCL20-CCR6 and CCL25-CCR9 chemokine-axes and increased cell migration patterns in HIV progressors. Interestingly, frequencies of CCR6 expressing cells were significantly elevated within the precursor MZ-like population, consistent with increased migration in response to CCL20. Although we found little modulation of chemokine-axes in EC, cell migration was greater than that observed for uninfected controls, especially for MZ-like B-cells. Overall the immune response against HIV-1 may involve recruitment of MZ-like B-cells to peripheral sites. Moreover, our findings suggest that "regulated" attraction of these cells in a preserved BLyS/BAFF non-inflammatory environment, such as encountered in EC could be beneficial to the battle and even control of HIV.


Conflict of interest statement

Competing Interests: The authors have declared that no competing interests exist.

Figures

Fig 1
Fig 1. Longitudinal variations of blood CD4+ T-cell counts and viral loads in HIV-1 infected individuals.
(A) Blood CD4+ T-cell counts (cell/mm3) were determined by flow-cytometry in rapid progressors (left panel; 0–3 months PI (n = 13), 5–8 months PI (n = 14), 3–6 months ART (n = 8), 9–12 months ART (n = 4)), classic progressors (middle panel; 0–3 months PI (n = 16), 5–8 months PI (n = 18), 24 months PI (n = 11)), and slow progressors (right panel; viremic (n = 6), aviremic (n = 5)). (B) Viral loads (log copies/ml) were quantified by in vitro signal amplification nucleic acid probe assay of HIV-1 RNA (bDNA) in the plasma of rapid progressors (left panel; 0–3 months PI (n = 12), 5–8 months PI (n = 13), 3–6 months ART (n = 8), 9–12 months ART (n = 4)), classic progressors (middle panel; 0–3 months PI (n = 17), 5–8 months PI (n = 19), 24 months PI (n = 12)), and slow progressors (right panel; viremic (n = 4), aviremic (n = 3)). The same values for HIV-negative donors (n = 18) in the left, middle and right panels are used as a control group. Cell populations and viral loads were compared using the Wilcoxon signed-rank test and Mann-Whitney U test for pairwise comparisons of different phases of infection within each group and between the study groups, respectively. Data shown are mean ±SEM. Significance levels are shown as ** p<0.001; ¤ p<0.05 for pairwise comparisons. PI, post-infection; ART, antiretroviral therapy.
Fig 2
Fig 2. Analysis of plasma CXCL13 levels, CXCR5 expression and migratory potential by blood B-cells of HIV-infected individuals.
(A) Plasma concentrations (pg/ml) of CXCL13 in rapid (left panel), classic (middle panel) and slow progressors (right panel). The same HIV-negative values are used as a control for all three panels. Frequencies of B-cells expressing CXCR5 (left y axis) and levels of CXCR5 surface expression (geometric mean fluorescence intensity—geoMFI) (right y axis) by (B) total, (C) mature activated, (D) resting switched memory, (E) ‘precursor’ marginal zone (MZ)-like, (F) ‘mature’ MZ-like and (G) transitional immature (TI) B-cells of rapid (left panel), classic (middle panel) and slow progressors (right panel). The same HIV-negative values are used as a control for all three panels. Data are expressed as percentages of CXCR5 expressing-cells and intensity of surface expression within each B-cell population. (H) In vitro migration index of total, mature activated, mature MZ-like, precursor MZ-like, switched resting memory and TI B-cells from the blood of classic progressors (5–8 months PI) (n = 6), aviremic slow progressors/elite controllers (EC) (n = 6) and HIV-negative individuals (n = 6) in response to 500 ng/ml CXCL13. The in vitro migration index is defined by the number of cells that have migrated in response to a given chemokine divided by the number of cells that have spontaneously migrated. Data were compared using the Wilcoxon signed rank test and the Mann-Whitney U test for pairwise comparisons of different phases of infection within each group and between the study groups, respectively. Data shown are mean ± SEM. Significance for percentages are expressed by * p < 0.05; ** p < 0.001; *** p < 0.0001 and intensity of surface expression by # p < 0.05; ## p < 0.001; ### p < 0.0001 when compared to HIV-negative individuals. ¤ p < 0.05 for pairwise comparisons of percentages. PI, post-infection; ART, antiretroviral therapy.
Fig 3
Fig 3. Flow-Cytometry gating strategy for analysis of blood B-cell populations of HIV-1 infected individuals.
Representative plot showing gating strategy on 105 live PBMCs. Total CD19+ B-cells were selected based on expression of CD27 and/or IgM, and levels of CD21. CD1c and CD10 expression were used for further characterization of blood MZ and TI B-cell populations. Quadrants were set based on the expression values obtained with fluorescence minus one (FMO) and isotype controls. Mature activated B-cells were defined as CD19+CD27+IgM-CD21loCD1c-CD10-, resting switched memory B-cells were CD19+CD27+IgM-CD21hiCD10-, precursor marginal-zone (MZ)-like B-cells were CD19+CD27+IgM+CD21loCD1c+CD10+, mature MZ-like B-cells were CD19+CD27+IgM+CD21hiCD1c+CD10- and transitional immature (TI) B-cells were CD19+CD27-IgM+CD21hiCD1c-CD10+. The mean events gated were: total B-cells (9320 ± 1750), mature activated (360 ± 67), resting switched memory (632 ± 301), precursor MZ-like (145 ± 36) mature MZ-like (327 ± 233) and TI (944 ± 174).
Fig 4
Fig 4. Analysis of plasma CXCL12 levels, CXCR4 expression and migratory potential of by blood B-cells of HIV-infected individuals.
(A) Plasma concentrations (pg/ml) of CXCL12 in rapid (left panel), classic (middle panel) and slow progressors (right panel). The same HIV-negative values are used as a control for all three panels. Frequencies of B-cells expressing CXCR4 (left y axis) and levels of CXCR4 surface expression (geometric mean fluorescence intensity -geoMFI) (right y axis) by (B) total, (C) mature activated, (D) resting switched memory, (E) ‘precursor’ marginal zone (MZ)-like, (F) ‘mature’ MZ-like and (G) transitional immature (TI) B-cells of rapid (left panel), classic (middle panel) and slow progressors (right panel). The same HIV-negative values are used as a control for all three panels. Data are expressed as percentages of CXCR4 expressing-cells and intensity of surface expression within each B-cell population. (H) In vitro migration index of total, mature activated, mature MZ-like, precursor MZ-like, switched resting memory and TI B-cells from the blood of classic progressors (5–8 months PI) (n = 6), aviremic slow progressors/elite controllers (EC) (n = 6) and HIV-negative individuals (n = 6) in response to 250 ng/ml CXCL12. The in vitro migration index is defined by the number of cells that have migrated in response to a given chemokine divided by the number of cells that have spontaneously migrated. Data were compared using the Wilcoxon signed rank test and the Mann-Whitney U test for pairwise comparisons of different phases of infection within each group and between the study groups, respectively. Data shown are mean ± SEM. Significance for percentages are expressed by * p < 0.05; ** p < 0.001; *** p < 0.0001 and intensity of surface expression by # p < 0.05; ## p < 0.001; ### p < 0.0001 when compared to HIV-negative individuals. ¤ p < 0.05 for pairwise comparisons of percentages. PI, post-infection; ART, antiretroviral therapy.
Fig 5
Fig 5. Longitudinal analysis of plasma CXCL11 levels and CXCR7 expression by blood B-cells of HIV-infected individuals.
(A) Plasma concentrations (pg/ml) of CXCL11 in rapid (left panel), classic (middle panel) and slow progressors (right panel). The same HIV-negative values are used as a control for all three panels. Frequencies of B-cells expressing CXCR7 (left y axis) and levels of CXCR7 surface expression (geometric mean fluorescence intensity -geoMFI) (right y axis) by (B) total, (C) mature activated, (D) resting switched memory, (E) ‘precursor’ marginal zone (MZ)-like, (F) ‘mature’ MZ-like and (G) transitional immature (TI) B-cells of rapid (left panel), classic (middle panel) and slow progressors (right panel). The same HIV-negative values are used as a control for all three panels. Data are expressed as percentages of CXCR7 expressing-cells and intensity of surface expression within each B-cell population. Plasma concentrations and receptor frequencies were compared using the Wilcoxon signed rank test and the Mann-Whitney U test for pairwise comparison of different phases of infection within each groups and between study groups, respectively. Data shown are mean ± SEM. Significance for percentages are expressed by * p < 0.05; ** p < 0.001; *** p < 0.0001 and intensity of surface expression by # p < 0.05; ## p < 0.001; ### p < 0.0001 when compared to HIV-negative individuals. ¤ p < 0.05 for pairwise comparisons of percentages. PI, postinfection; ART, antiretroviral therapy.
Fig 6
Fig 6. Analysis of plasma CCL20 levels, CCR6 expression and migratory potential by blood B-cells of HIV-infected individuals.
(A) Plasma concentrations (pg/ml) of CCL20 in rapid (left panel), classic (middle panel) and slow progressors (right panel). The same HIV-negative values are used as a control for all three panels. Frequencies of B-cells expressing CCR6 (left y axis) and levels of CCR6 surface expression (geometric mean fluorescence intensity -geoMFI) (right y axis) by (B) total, (C) mature activated, (D) resting switched memory, (E) ‘precursor’ marginal zone (MZ)-like, (F) ‘mature’ MZ-like and (G) transitional immature (TI) B-cells by rapid (left panel), classic (middle panel) and slow progressors (right panel). The same HIV-negative values are used as a control for all three panels. Data are expressed as percentages of CCR6 expressing-cells and intensity of surface expression within each B-cell population. (H) In vitro migration index of total, mature activated, mature MZ-like, precursor MZ-like, switched resting memory and TI B-cells from the blood of classic progressors (5–8 months PI) (n = 6), aviremic slow progressors/elite controllers (EC) (n = 6) and HIV-negative individuals (n = 6) in response to 100 ng/ml CCL20. The in vitro migration index is defined by the number of cells that have migrated in response to a given chemokine divided by the number of cells that have spontaneously migrated. Data were compared using the Wilcoxon signed rank test and the Mann-Whitney U test for pairwise comparisons of different phases of infection within each group and between the study groups, respectively. Data shown are mean ± SEM. Significance for percentages are expressed by * p < 0.05; ** p < 0.001; *** p < 0.0001 and intensity of surface expression by # p < 0.05; ## p < 0.001; ### p < 0.0001 when compared to HIV-negative individuals. ¤ p < 0.05 and & p < 0.05 for pairwise comparisons of percentages and intensity of surface expression, respectively. PI, postinfection; ART, antiretroviral therapy.
Fig 7
Fig 7. Analysis of plasma CCL25 levels, CCR9 expression and migratory potential by blood B-cells of HIV-infected individuals.
(A) Plasma concentrations (pg/ml) of CCL25 in rapid (left panel), classic (middle panel) and slow progressors (right panel). The same HIV-negative values are used as a control for all three panels. Frequencies of B-cells expressing CCR9 (left y axis) and levels of CCR9 surface expression (geometric mean fluorescence intensity -geoMFI) (right y axis) by (B) total, (C) mature activated, (D) resting switched memory, (E) ‘precursor’ marginal zone (MZ)-like, (F) ‘mature’ MZ-like and (G) transitional immature (TI) B-cells by rapid (left panel), classic (middle panel) and slow progressors (right panel). The same HIV-negative values are used as a control for all three panels. Data are expressed as percentages of CCR9 expressing-cells and surface expression within each B-cell population. (H) In vitro migration index of total, mature activated, mature MZ-like, precursor MZ-like, switched resting memory and TI B-cells from the blood of classic progressors (5–8 months PI) (n = 6), aviremic slow progressors/elite controllers (EC) (n = 6) and HIV-negative individuals (n = 6) in response to 100 ng/ml CCL25. The in vitro migration index is defined by the number of cells that have migrated in response to a given chemokine divided by the number of cells that have spontaneously migrated. Data were compared using the Wilcoxon signed rank test and the Mann-Whitney U test for pairwise comparisons of different phases of infection within each group and between the study groups, respectively. Data shown are mean ± SEM. Significance for percentages are expressed by * p < 0.05; ** p < 0.001; *** p < 0.0001 and intensity of surface expression by # p < 0.05; ## p < 0.001; ### p < 0.0001 when compared to HIV-negative individuals. & p < 0.05 for pairwise comparisons of intensity of surface expression. PI, postinfection; ART, antiretroviral therapy.

Similar articles

Cited by

References

    1. Poudrier J, Thibodeau V, Roger M. Natural Immunity to HIV: a delicate balance between strength and control. Clin Dev Immunol. 2012;2012: 875821 10.1155/2012/875821 - DOI - PMC - PubMed
    1. Macpherson AJ, McCoy KD. Stratification and compartmentalisation of immunoglobulin responses to commensal intestinal microbes. Semin Immunol. 2013;25: 358–63. 10.1016/j.smim.2013.09.004 - DOI - PubMed
    1. Hooper LV, Littman DR, Macpherson AJ. Interactions between the microbiota and the immune system. Science. 2012;336: 1268–73. 10.1126/science.1223490 - DOI - PMC - PubMed
    1. Moir S, Fauci AS. B cells in HIV infection and disease. Nat Rev Immunol. 2009;9: 235–45. 10.1038/nri2524 - DOI - PMC - PubMed
    1. Poudrier J, Chagnon-Choquet J, Roger M. Influence of dendritic cells on B-cell responses during HIV infection. Clin Dev Immunol. 2012;2012: 592187 10.1155/2012/592187 - DOI - PMC - PubMed

Publication types