. 2016 May 20;12(5):e1004929.
doi: 10.1371/journal.pcbi.1004929. eCollection 2016 May.

Biophysical Network Modelling of the dLGN Circuit: Different Effects of Triadic and Axonal Inhibition on Visual Responses of Relay Cells

Affiliations

Biophysical Network Modelling of the dLGN Circuit: Different Effects of Triadic and Axonal Inhibition on Visual Responses of Relay Cells

Thomas Heiberg et al. PLoS Comput Biol. .

Abstract

Despite its prominent placement between the retina and primary visual cortex in the early visual pathway, the role of the dorsal lateral geniculate nucleus (dLGN) in molding and regulating the visual signals entering the brain is still poorly understood. A striking feature of the dLGN circuit is that relay cells (RCs) and interneurons (INs) form so-called triadic synapses, where an IN dendritic terminal can be simultaneously postsynaptic to a retinal ganglion cell (GC) input and presynaptic to an RC dendrite, allowing for so-called triadic inhibition. Taking advantage of a recently developed biophysically detailed multicompartmental model for an IN, we here investigate putative effects of these different inhibitory actions of INs, i.e., triadic inhibition and standard axonal inhibition, on the response properties of RCs. We compute and investigate so-called area-response curves, that is, trial-averaged visual spike responses vs. spot size, for circular flashing spots in a network of RCs and INs. The model parameters are grossly tuned to give results in qualitative accordance with previous in vivo data of responses to such stimuli for cat GCs and RCs. We particularly investigate how the model ingredients affect salient response properties such as the receptive-field center size of RCs and INs, maximal responses and center-surround antagonisms. For example, while triadic inhibition not involving firing of IN action potentials was found to provide only a non-linear gain control of the conversion of input spikes to output spikes by RCs, axonal inhibition was in contrast found to substantially affect the receptive-field center size: the larger the inhibition, the more the RC center size shrinks compared to the GC providing the feedforward excitation. Thus, a possible role of the different inhibitory actions from INs to RCs in the dLGN circuit is to provide separate mechanisms for overall gain control (direct triadic inhibition) and regulation of spatial resolution (axonal inhibition) of visual signals sent to cortex.


Conflict of interest statement

The authors have declared that no competing interests exist.

Figures
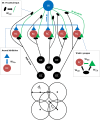
Fig 1
Fig 1. Schematic of the dLGN circuit model.
(Top) Five relay cells (RCs) receive input from one retinal ganglion (GC) cell each. All inputs to RCs arrive in triadic synapses, involving the one and same IN. In addition, the IN receives proximal input from all five GCs. The boxes highlight the synaptic connections in the networks and the associated connection weights w. Note that in the present model application, only responses for the central RC cell is considered so that the only effect of the four peripheral GCs comes from the proximal inputs to the IN. (Bottom) The GCs are organized with four peripheral GCs all located at distance ra from the center GC.
Fig 2
Fig 2. Spiking patterns of model neurons following somatic current injection.
(A) Somatic membrane potentials of the IN model following injection of depolarizing and hyperpolarizing (positive and negative values, respectively, of first of two numbers in parenthesis) step currents lasting 900 ms. Results illustrate the overall tonic-firing response to depolarizing input currents. For the case with a strong hyperpolarizing current (−150 pA), a rebound spike is observed at offset (top trace). In the case where the offset of the strong hyperpolarizing step current (−150 pA) is combined with a constant but weak depolarizing current (+20 pA), a rebound burst is observed instead (bottom trace). (B) Similar to the IN cell, the RC cell generates spikes in a tonic pattern when the soma receives depolarizing currents. However, compared to the IN, the RC cells respond with more spikes for similar-amplitude depolarizing soma currents (and also more rebound spikes after offset of hyperpolarizing currents).
Fig 3
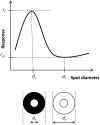
Fig 3. Illustration of area-response curves and metrics used to quantify key properties.
Center diameter dc, surround diameter ds, peak response rate rc, center-surround minimum rate rcs. Illustration adapted from Fig 1 in [26].
Fig 4
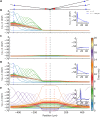
Fig 4. Synaptic integration properties of interneuron (IN) model.
(A) Ball-and-sticks IN model consisting of a point-like soma (black square) with five dendritic sticks protruding out from it. Distal (triadic; blue dots) and proximal (red dots) synapse locations are illustrated. Panels B–E shows spatiotemporal spread of IN membrane potential along two (of five) dendritic sticks following activation by single RC spiking on inputs distal (triadic) and/or proximal synapses. Each colored line represents a snapshot of the membrane potential taken each half millisecond from 0 to 20 milliseconds with the GC spike(s) arriving at tsyn = 1 ms. The synapse position(s) are denoted by vertical, red or blue dashed lines, while the black dashed line marks the location of the soma compartment. The small inset axes show the membrane potential in the soma (Vi(0, t)) and in the distal dendrite (Vi(−450 μm, t)), respectively, as a function of time. (B) GC spike onto distal synapse on lower left dendritic stick. (C) GC spike onto proximal synapse on lower left dendritic stick. (D) GC spike arriving simultaneously on distal and proximal synapses on lower left dendritic stick. (E) GC spikes arriving simultaneously at all five proximal synapses, including those on the two depicted dendritic sticks.
Fig 5
Fig 5. Illustration of two pathways for triadic inhibition of relay cells (RCs).
Curves show membrane potentials of the IN dendrite (panels B,D) at the distal synapse position (blue dot in panel A) and in RC soma (panels C,E), respectively. (A) Illustration of interneuron (IN) with triadic connection with RC shown as open circle. (B) Single incoming GC spike input to distal (triadic) synapse (time stamp tsyn = 1 ms denoted as red bar in small display on top) triggers a large postsynaptic response in distal IN dendrite, effectively resulting in a dendritic action potential. (C) Same GC input spike as in (B) now also projecting to the RC partner of the triadic circuit with a short time delay resulting in direct triadic inhibition of the RC (starting at time shown as blue time-stamp bar above): without inhibition the GC input to the RC cell gives an immediate RC action potential (red curve), while no action potential occurs if the excitatory input is accompanied by direct triadic inhibition (black curve). (D) Back-propagating action potential in IN dendrite(s) triggered by a strong synapse input to the IN soma (activation time tsyn = –8 ms, gmax = 300 nS, Esyn = 10 mV, τ = 1 ms, Isyn(t) = gmax ⋅ exp(−(ttsyn)/τ) ⋅ (VmEsyn) for ttsyn). For illustration purposes, the distal activation of the IN dendrite by the GC input is here absent, i.e., wGIt = 0. (E) Same GC input spike as in panels B and C now also projecting to an RC cell, gives an RC action potential both without (red curve) and with soma-driven triadic inhibition (black curve) as the inhibition occurs too late (blue time-stamp bar above) to prevent action-potential firing in the RC.
Fig 6
Fig 6. Illustration of temporal response in dLGN model circuit.
A stimulus spot of diameter d = 1 deg is turned on at 500 ms. (A) Example of (single-trial) IN membrane-potential dynamics (soma: blue line; distal part of dendritic segment receiving synaptic input from central GC cell: green line). Also shown are GC input spikes driving the circuit, both from the center GC cell (top row of tiny triangles) and from the four peripheral GC cells (bottom row of triangles). (B) Corresponding RC membrane-potential dynamics. Also shown are input spikes from the central GC input (top row of tiny black triangles), IN dendritic (triadic) action potentials (middle row of green triangles), and IN somatic action potentials (bottom row of blue triangles). See text for explanation of arrows. Default model parameters are used, cf. Tables 2–4.
Fig 7
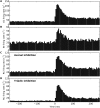
Fig 7. Example post-stimulus time histograms (PSTS) for cells in dLGN model circuit.
Stimulus spot of diameter d = 1 deg is turned on at 500 ms. (A) PSTH for central GC cell. (B) PSTH for IN cell. (C) PSTH for RC cell with axonal inhibition only (wIRa = 4 nS, wIRt = 0). (D) PSTH for RC cell with triadic inhibition only (wIRa = 0, wIRt = 4 nS). Results correspond to 1000 trials, bin size: 5 ms. Default model parameters are used, cf. Tables 2–4.
Fig 8
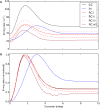
Fig 8. Example area-summation curves illustrating effects of various types of inhibition on relay-cell (RC) response.
(A) Trial-averaged spike-count firing rate vs. spot diameter, for central retinal ganglion cell (GC, solid black), interneuron (IN, solid blue), and relay cell (RC, red lines). Red solid line: RC response for direct triadic inhibition (RC-i) with wIRt = 4 nS, wGIp = 0, wIRa = 0. Red dashed line: RC response for direct & soma-driven triadic inhibition (RC-ii) with wIRt = 4 nS, wGIp = 0.6 nS, wIRa = 0. Red dotted line: RC response for axonal inhibition (RC-iii) with wIRt = 0, wGIp = 0.6 nS, wIRa = 4 nS. Dark red line (RC-all) corresponds to results from all three types of inhibition combined, i.e., wIRt = 4 nS, wGIp = 0.6 nS, wIRa = 4 nS. wGR = 15.6 nS is used in all cases. Other parameters correspond to default values. Note that the depicted IN response does not apply to case (RC-i) as the IN is only synaptically activated at the triads in this case as wGIp = 0. (B) Area-response curves in A normalised to have maximal values of unity. The receptive-field center diameters dc corresponds to the spot diameter giving the largest response. The spike-count firing rates are found by averaging PSTHs of the type in Fig 7 over the entire 500-ms time window the stimulus is on.
Fig 9
Fig 9. Area-response curves with triadic inhibition.
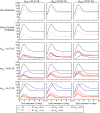
Row 1: no inhibition. Row 2: direct triadic inhibition only (case (RC-i)). Rows 3–5: triadic or triadic+axonal inhibition for different values of weight proximal ganglion-cell input to the interneuron wGIp. Black curves correspond to central retinal ganglion cell (GC), blue curves to interneuron (IN), and red/orange curves to relay cell (RC). The four RC curves in the panels in rows 3–5 correspond to wIRa = 0/2/4/8 nS with wIRa = 0 (no axonal inhibition) and wIRa = 8 nS (maximal axonal inhibition) corresponding to the top and bottom of the four curves, respectively.
Fig 10
Fig 10. Summary of response measures from area-response curves with triadic inhibition present.
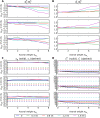
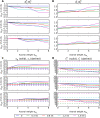
(A) Ratio of receptive-field center diameter of relay cell (RC) and (central) retinal ganglion cell (GC), dcR/dcG; receptive-field center diameter measured as the spot diameter corresponding to the largest firing rate in the area-summation curves in Fig 9. (B) Ratio of receptive-field center diameter of interneuron (IN) and relay cell (RC), dcI/dcR. (C) Relay-cell αR (solid) and interneuron αI (dashed) center-surround antagonisms, cf. Eq 7. (D) Maximal firing rate rc, i.e., firing rate for spot exactly covering receptive-field center, for relay cell (rcR, solid) and interneuron (rcI, dashed). The colored lines correspond to different values of wGIp, see legend below panels. Note also that interneuron (IN) results are absent for the case with wGIp = 0 (blue lines) since in this case the IN only receives triadic input and does not fire any action potentials.
Fig 11
Fig 11. Area-response curves without triadic inhibition.
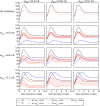
Row 1: no inhibition. Rows 2–4: axonal inhibition for different synaptic weight values of proximal ganglion-cell input to the interneuron wGIp. Black curves correspond to central retinal ganglion cell (GC), blue curves to interneuron (IN), and red/orange curves to relay cell (RC). The four RC curves in the panels in rows 2–4 correspond to wIRa = 0/2/4/8 nS with wIRa = 0 (no axonal inhibition) and wIRa = 8 nS (maximal axonal inhibition) corresponding to the top and bottom of the four curves, respectively.
Fig 12
Fig 12. Summary of response measures from area-response curves without triadic inhibition.
For explanation of panels, see caption of Fig 10.
Fig 13
Fig 13. Area-summation curves for transient response and sustained response for relay-cells (RCs).
(A–B) Trial-averaged spike-count firing rate vs. spot diameter, for central retinal ganglion cell (GC, solid black), interneuron (IN, solid blue), and relay cell (RC, red lines) for transient (A) and sustained responses (B). (C–D) Area-summation curves in A and B normalized to the maximum firing rate for each cell. The transient response corresponds to the trial-averaged spike-count firing rate for the first 100 ms after stimulus onset, while the sustained response corresponds to the averaged rate in the time interval from 400 to 500 ms after stimulus onset, cf. Fig 7. The depicted models examples are the same as in Fig 8: Red solid line: RC response for direct triadic inhibition (case (RC-i)) with wIRt = 4 nS, wGIp = 0, wIRa = 0. Red dashed line: RC response for direct & soma-driven triadic inhibition (case (RC-ii)) with wIRt = 4 nS, wGIp = 0.6 nS, wIRa = 0. Red dotted line: RC response for axonal inhibition (case (RC-iii)) with wIRt = 0, wGIp = 0.6 nS, wIRa = 4 nS. Dark red line (RC-all) corresponds to results from all three types of inhibition combined, i.e., wIRt = 4 nS, wGIp = 0.6 nS, wIRa = 4 nS. wGR = 15.6 nS is used in all cases. Other parameters correspond to default values. Note that the depicted IN response does not apply to case (RC-i) as the IN is only synaptically activated at the triads in this case as wGIp = 0. Note also that 500 trials, not the default value of 10 trials, were used to compute each depicted trial-averaged spike-count rate, and that no seven-point filtering was employed to smooth the area-summation curves.
Fig 14
Fig 14. Summary of key results on different effects of triadic and axonal inhibition on relay-cell (RC) response.
(A) Dependence of diameter of RC receptive-field center dcR on two key model parameters (wGIp, weight of proximal excitation of the interneuron (IN); wIRa, weight of axonal inhibition) for the case of axonal inhibition only (i.e., wIRt = 0). For this example the diameter of the ganglion-cell receptive-field center dcG is fixed to 1.8 deg, and the retinogeniculate excitation is set to wGR = 11.6 nS. (B) Transient and sustained RC responses for center-filling spots, corresponding to maximal responses in the area-response curves, for the cases of only triadic or only axonal inhibition. Dependence of maximal response on retinogeniculate excitation weight wGR is depicted. Other parameters: wIRa = 4 nS, wGIp = 0.6 nS. (C) Dependence of center-surround antagonism, quantified by the coefficient αRC (Eq 7), on wGIp, the weight of the GC excitation of INs on the proximal dendrites. Dark-blue line: No inhibition, wIRa = wIRt = 0. Red line: Axonal inhibition only, wIRt = 0, wIRa = 8 nS. Green line: Triadic inhibition only, wIRa = 0. Light-blue line: Both triadic and axonal inhibition, wIRa = 8 nS. Retinogeniculate excitation is set to wGR = 15.6 nS. In B and C simulation data points are marked with dots, and lines are added as a guide for the eye. Note that 500 trials, not the default value of 10 trials, were used to compute the depicted trial-averaged spike-count rate in panel B.

Similar articles

Cited by

References

    1. Sherman S, Guillery R. Exploring the Thalamus. New York: Academic; 2001.
    1. Cleland BG, Dubin MW, Levick WR. Sustained and transient neurones in cat’s retina and lateral geniculate nucleus. Journal of Physiology. 1971;217:473–496. 10.1113/jphysiol.1971.sp009581 - DOI - PMC - PubMed
    1. Coenen AML, Vendrik AJH. Determination of the transfer ratio of cat’s geniculate neurons through quasi-intracellular recordings and the relation with the level of alertness. Experimental Brain Research. 1972;14:227–242. 10.1007/BF00816160 - DOI - PubMed
    1. Cleland BG, Lee BB. A comparison of visual responses of cat lateral geniculate nucleus neurones with those of ganglion cells afferent to them. Journal of Physiology. 1985;369:249–268. 10.1113/jphysiol.1985.sp015899 - DOI - PMC - PubMed
    1. Mastronarde DN. Two classes of single-input X-cells in cat lateral geniculate nucleus. I. Receptive-field properties and classification of cells. Journal of Neurophysiology. 1987;57:357–380. - PubMed

Publication types

LinkOut - more resources