. 2016 May 20:5:e15312.
doi: 10.7554/eLife.15312.

Detection and manipulation of live antigen-expressing cells using conditionally stable nanobodies

Affiliations

Detection and manipulation of live antigen-expressing cells using conditionally stable nanobodies

Jonathan Cy Tang et al. Elife. .

Abstract

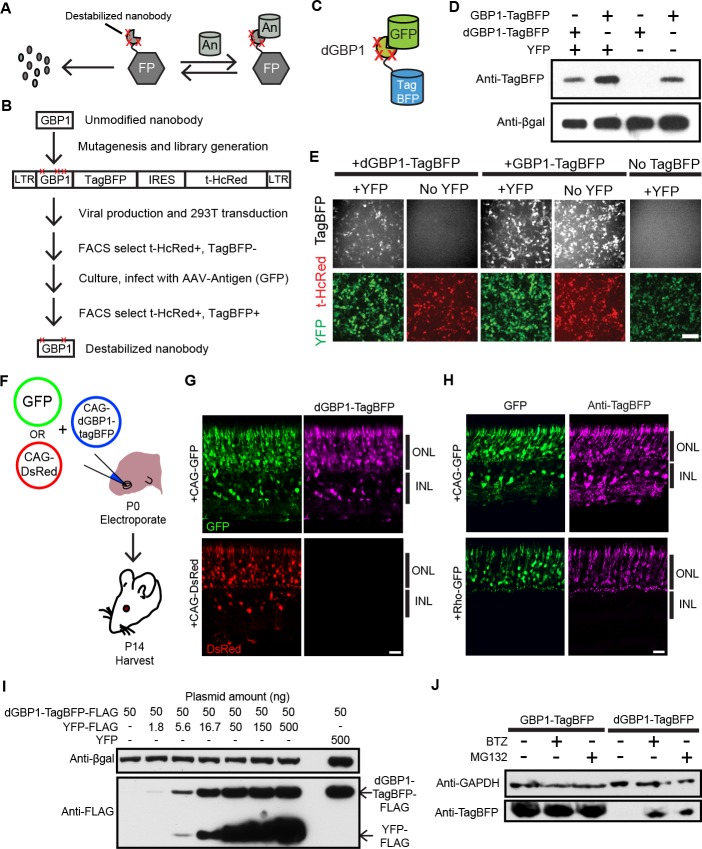
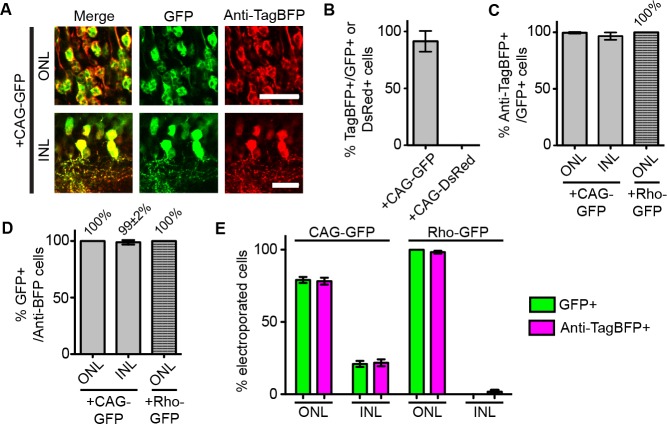
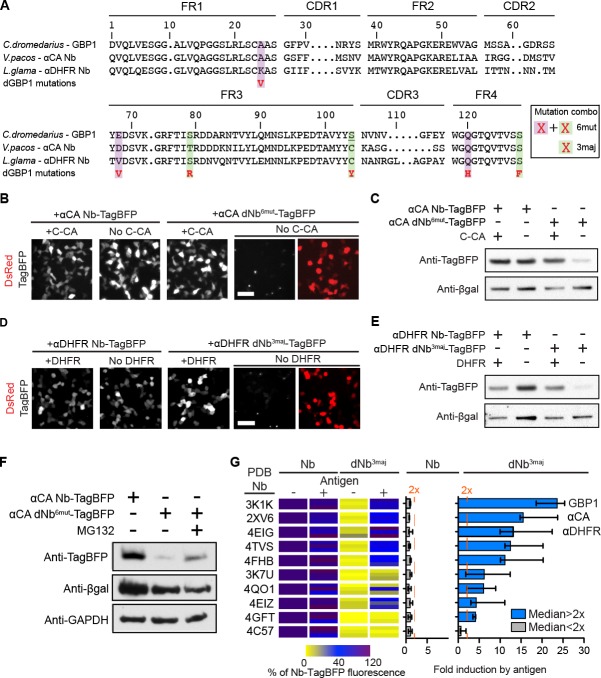
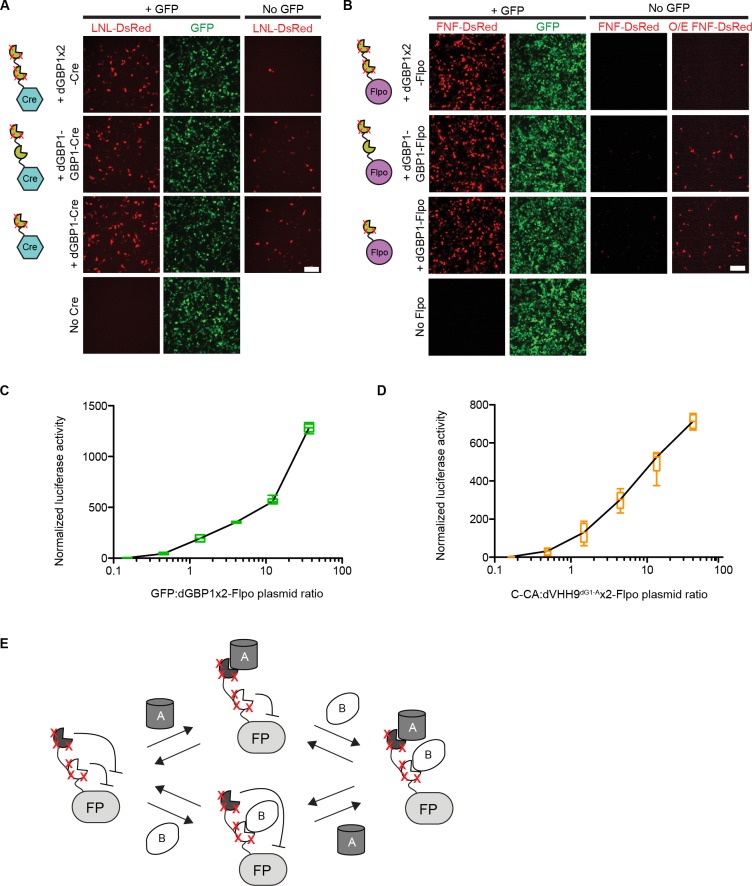
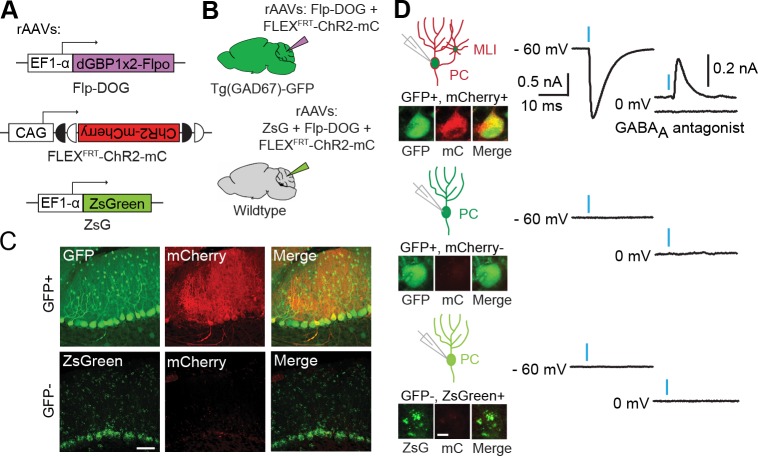
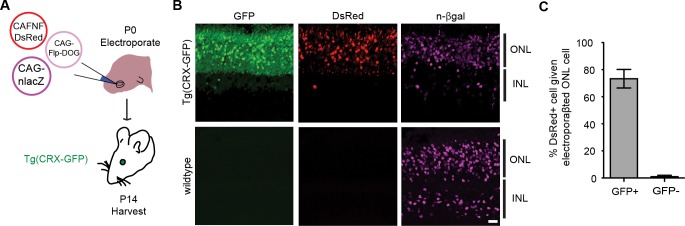
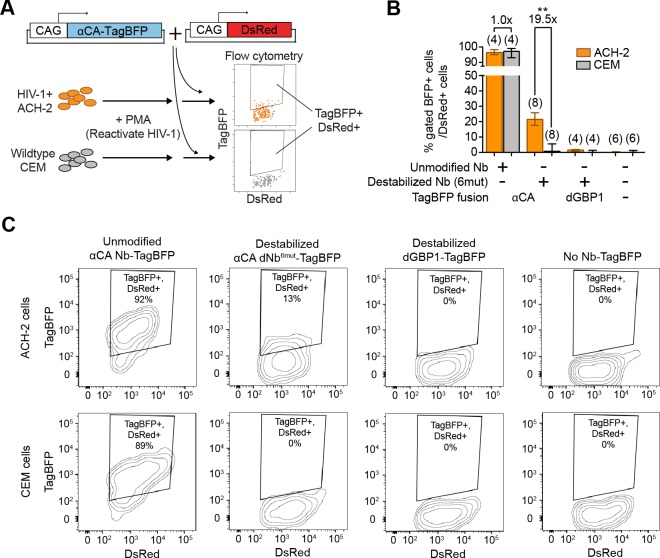
The ability to detect and/or manipulate specific cell populations based upon the presence of intracellular protein epitopes would enable many types of studies and applications. Protein binders such as nanobodies (Nbs) can target untagged proteins (antigens) in the intracellular environment. However, genetically expressed protein binders are stable regardless of antigen expression, complicating their use for applications that require cell-specificity. Here, we created a conditional system in which the stability of an Nb depends upon an antigen of interest. We identified Nb framework mutations that can be used to rapidly create destabilized Nbs. Fusion of destabilized Nbs to various proteins enabled applications in living cells, such as optogenetic control of neural activity in specific cell types in the mouse brain, and detection of HIV-infected human cells by flow cytometry. These approaches are generalizable to other protein binders, and enable the rapid generation of single-polypeptide sensors and effectors active in cells expressing specific intracellular epitopes.

Keywords: GFP; HIV-1; antibody engineering; developmental biology; human; mouse; nanobodies; neuroscience; stem cells.


Conflict of interest statement

JCYT, ED, SW and CLC: Submitted a patent application regarding destabilized nanobodies. International Application No. PCT/US2016/027749 Priority: US Prov. Appl. No. 62/148,595.

The other authors declare that no competing interests exist.

Figures

Figure 1.
Figure 1.. Isolation of a destabilized Nb whose protein level depends upon antigen co-expression.
(A) Concept of antigen-controlled protein stabilization. FP, fusion protein; An, antigen. (B) Strategy for isolating dNbs. LTR, long terminal repeat. (C) GFP-dependent stabilization of dGBP1 tagged with TagBFP. (D) Western blot of transfected 293T cell lysate for TagBFP and βgal (a transfection control) shows that the level of dGBP1-TagBFP is dependent upon YFP co-expression. YFP is a derivative of GFP. (E) YFP (green)-dependent dGBP1-TagBFP fluorescence in transfected 293T cells. t-HcRed (red) is a transfection marker for cells with TagBFP (gray) fusion constructs. Scale bar, 100 μm. All results from (D, E) are representative of three independent experiments, for 3 biological replicates. (F) Schematic of electroporation experiment. (G) GFP (green), but not DsRed (red), promotes dGBP1-TagBFP fluorescence (magenta) in the mouse retina. ONL, outer nuclear layer; INL, inner nuclear layer. (H) The expression pattern of TagBFP protein, as detected by Anti-TagBFP (magenta), can be altered by changing the GFP expression pattern with broadly active (CAG) or rod photoreceptor-specific (Rho) promoters. TagBFP immunodetection was not carried out in (B) as the TagBFP antibody cross-reacts with DsRed. Scale bar is 20 μm. Biological replicates (retinas): n = 3 for all conditions. (I) Dependence of dGBP1-TagBFP protein level on YFP dose in transfected 293T cells. (J) The ubiquitin proteasome pathway is involved in degradation of dGBP1. Transfected 293T cells were treated with drugs for 20 hr. BTZ, Bortezomib. All results from (I, J) are representative of three independent experiments, for 3 biological replicates. Additional data related to characterizations of dGBP1-TagBFP in vitro and in vivo are shown in Figure 1—figure supplements 1–2. DOI: http://dx.doi.org/10.7554/eLife.15312.003
Figure 1—figure supplement 1.
Figure 1—figure supplement 1.. YFP-dependent dGBP1-TagBFP stabilization in cells.
(A) Comparison of background fluorescence between two GBP1 variants. Constructs were expressed using MMLV-based vectors, which were transfected into 293T cells. Images were acquired 2 days post-transfection. TagBFP fused to dGBP1 had no detectable background fluorescence in the absence of YFP, whereas TagBFP fused to GBP1 variant S19L, K67N had occasional fluorescent aggregates in the absence of YFP. Images are representative of at least 2 independent experiments. Scale bar is 50 μm. (B) Quantification of results from Figure 1E. Transfected cells were identified by expression of either YFP or t-HcRed. Plot shows median and maximum-to-minimum range. Data are from 3 independent experiments, for 3 biological replicates. (C) YFP stabilizes wildtype GBP1 protein in cells. 293T cells transfected with MMLV-GBP1-TagBFP, CAG-nlacZ and filler plasmid or pCAG-YFP were harvested 2 days post-transfection and whole cell lysates were blotted for anti-TagBFP as well as anti-βgal. Densitometry measurements of western blot bands were plotted as the relative density of anti-TagBFP bands compared to that of anti-βgal bands in the same lane. a.u. is arbitrary unit. n = 3. Comparison of the two conditions gave P value 0.026. *indicates p<0.05, Student’s t-test. Plot shows median and range. Results are representative of at least 3 independent experiments. DOI: http://dx.doi.org/10.7554/eLife.15312.004
Figure 1—figure supplement 2.
Figure 1—figure supplement 2.. Detection of antigen-expressing cells with dNb in vivo.
Quantification of results from Figure 1G,H. (A) Tight coupling of GFP expression (green) and Anti-TagBFP staining (red) from ONL cells in the +CAG-GFP condition. Scale bar is 20 μm. (B–E). Quantification of electroporation results. (B) GFP-dependency of TagBFP expression. Counted cells from ONL. Plotted % TagBFP+ cells given GFP+ (from +CAG-GFP) or DsRed+ cells (from +CAG-DsRed). (C) Efficiency of GFP-dependent protein stabilization. Efficiency is % Anti-TagBFP+ cells given GFP+ cells. (D) GFP-specificity of system, as determined by% GFP+ cells given Anti-TagBFP+ cells. (E) dGBP1-TagBFP expression pattern closely matches that of GFP. All electroporated cells, as defined by GFP or TagBFP expression, were quantified across a 20 μm retinal section and represented as % of total number of cells counted. Graphs and values shown are as mean ± standard deviation. Biological replicates (retinas): n = 3 for all conditions. DOI: http://dx.doi.org/10.7554/eLife.15312.005
Figure 2.
Figure 2.. dGBP1 destabilizing mutations can be transferred to Nbs derived from different species to create antigen-dependent stability.
(A) Protein alignment of Nbs against GFP (GBP1), HIV-1 CA (αCA) and E.coli DHFR (αDHFR). Amino acid positions numbered according to the ImMunoGeneTics information system (IMGT). FR, framework; CDR, complementarity determining region. Purple- and green-highlighted residues indicate dGBP1 mutation position. Green-highlighted residues (3maj) are most destabilizing when mutated. The underlined serine was a cysteine in the original GBP1. (BE). Transfer of dGBP1 mutations to other Nbs. Destabilized, but not unmodified αCA and αDHFR showed antigen-dependent fluorescence (B,D) as well as protein level (C,E). DsRed (red) indicates transfected cells in (B,D) and is only shown when TagBFP (gray) results are negative. Scale bar, 50 μm. (F) A dNb generated by mutation transfer was degraded by the UPS. αCA-dNb6mut-TagBFP showed an increase in protein level when transfected 293T cells were treated with MG132 for 6 hr. Results representative of 3 independent experiments. (G) Heat map showing median TagBFP fluorescence intensity of Nb-TagBFP fusions. All Nbs shown recognize epitopes of intracellular origin. Fluorescent readings were normalized to that of unmodified Nb (no antigen) condition, which was set to 100. n = 3 biological replicates pooled from 3 independent experiments per Nb. Each biological replicate result is shown as a horizontal bar in the heat map. Bar graphs indicate median and maximum-to-minimum range. Additional data related to mutation transfer of destabilizing mutations are shown in Figure 2—figure supplements 1–3. Source data for % Nb-TagBFP fluorescence values are shown in Figure 2—source data 1. DOI: http://dx.doi.org/10.7554/eLife.15312.006
Figure 2—figure supplement 1.
Figure 2—figure supplement 1.. Mapping of mutations necessary for dGBP1 destabilization.
(A) Representative images showing expression of GBP1 variants tagged with mCherry in 293T cells. Images taken 17 hr post-transfection. Scale bar, 50 μm. (B) Semi-quantitative summary of mCherry fluorescence intensity as well as cellular solubility phenotype. Sol, soluble. Agg, aggregate. Plot is mean ± standard deviation. Asterisk indicates mutations that showed clear increase in fluorescence compared to dGBP1-mCherry. n = 4–5 per condition. Consistent results were obtained in at least 3 biological replicates (transfected wells) in at least 3 independent experiments. DOI: http://dx.doi.org/10.7554/eLife.15312.008
Figure 2—figure supplement 2.
Figure 2—figure supplement 2.. Mapping mutations sufficient for dGBP1 destabilization.
(A) Representative images showing expression of GBP1 variants tagged with mCherry in 293T cells. Images taken 17 hr post-transfection. Scale bar, 50 μm. (B) Semi-quantitative summary of mCherry fluorescence intensity as well as cellular solubility phenotype. Sol, soluble. Agg, aggregate. Plot is mean ± standard deviation. Asterisk indicates clearly destabilized mutations compared to GBP1-mCherry. n = 6 per condition except GBP1 control (n = 3). Consistent results were obtained in at least 3 biological replicates (transfected wells) in at least 3 independent experiments. DOI: http://dx.doi.org/10.7554/eLife.15312.009
Figure 2—figure supplement 3.
Figure 2—figure supplement 3.. Generation of dNbs by mutation transfer.
(A) Conservation of dGBP1 mutations across 76 Nbs derived from Camelus dromedarius, Llama glama and Vicugna pacos. (B) Mapping of Nb destabilizing positions in relation to binding interfaces across Nb-Antigen complexes. (C) dGBP1-TagBFP expression does not have a clear effect on YFP protein level. Transfected 293T cells were harvested 1 day post-transfection. Whole cell lysates were blotted for anti-YFP as well as anti-βgal. Densitometry measurements of western blot bands were plotted as the relative density of anti-TagBFP bands compared to that of anti-βgal bands in the same lane. a.u. is arbitrary unit. n = 3. Plot shows median and range. Results are representative of at least 3 independent experiments. DOI: http://dx.doi.org/10.7554/eLife.15312.010
Figure 3.
Figure 3.. Generation and optimization of antigen-specific effectors based on dNbs.
(A) Reporter assay of transfected 293T cells testing dGBP1-Cre fusion constructs for activation of a Cre-dependent luciferase construct. (B) Reporter assay of transfected 293T cells testing dGBP1-Flpo fusion constructs for activation of a Flpo-dependent luciferase construct. Cells were harvested at 15 hr (A) or 36 hr (B) post-transfection. All results are representative of 3 independent experiments. Sample size per condition, n = 12 (A) and n = 18 (B). (C) Rapid generation of a C-CA-dependent Flpo by transfer of dGBP1 mutations to αCA Nb. Schematic of C-CA-dependent Flpo (left). C-CA can promote Flpo recombination in the mouse retina (right). n-βgal was an electroporation marker. Scale bar, 20 μm. (D) Quantification of C-CA-dependent Flpo activity. In (C,D), 4 and 3 electroporated retinas were analyzed for +C-CA and +GFP conditions, respectively. (E,F) Reporter assay in 293T cells using Flp-dependent luc2 construct, CAFNF-luc2. Results show dependence of Flpo activity on the presence of both GFP and C-CA (E) or GFP and DHFR (F). n = 6 per condition in (E) and n = 9 per condition in (F). Consistent results were obtained in 3 independent experiments. All plots indicate mean and standard deviation. Additional characterization of dNb-based effectors is shown in Figure 3—figure supplement 1. DOI: http://dx.doi.org/10.7554/eLife.15312.012
Figure 3—figure supplement 1.
Figure 3—figure supplement 1.. Additional information on antigen-specific effectors.
(AB) Plasmids encoding unmodified or destabilized GBP1 fusion to Cre or Flpo were transfected into 293T cells along with CAG-driven, loxP-Neo-loxP- (LNL-) or FRT-Neo-FRT- (FNF-) DsRed. Cre and Flpo were each individually fused to either GBP1, dGBP1-GBP1, or dGBP1x2, respectively (see cartoon). Compared to dGBP1-GBP1 fusion, dGBP1x2 gave increased suppression of background recombinase activity. O/E: overexposed. Cells imaged at 22 hr (A) or 50 hr (B) post-transfection. Images representative of three independent experiments. Scale bar, 100 μm. (CD). Antigen-specific effectors depend on antigen dose. Transfected 293T cells were assayed for Flpo recombination by the CAG-driven FNF-luc2 reporter. (C) GFP dose dependency of GFP-dependent Flpo. n = 6. Data pooled from 3 independent experiments. (D) C-CA dose dependency of C-CA-dependent Flpo. n = 6. Data pooled from 3 independent experiments. In (CD), Boxplots indicate maximum-to-minimum range. Box boundaries range from 25th to 75th percentile. The line in box indicates median. (E) Schematic of double dNb-fusion system for coincidence detection of antigen. FP, fusion protein. DOI: http://dx.doi.org/10.7554/eLife.15312.013
Figure 4.
Figure 4.. Intracellular antigen can trigger genome editing via dNbs.
(A) Schematic of Cas9 fusion protein inducible by C-CA binding. (B) Fusion configuration of tandemly repeated C-CA Nb to Cas9, giving dCC-Cas9. (C) dCC-Cas9 activity was assayed for βgal expression in a human TE671 cell line engineered to contain a lacZ reporter inactive in expression due to a loxP-STOP-loxP transcriptional termination cassette. gRNA targets both loxP sequences for Cas9 cleavage and STOP removal. (D) dCC-Cas9 shows C-CA-dependent activity. Cas9 activity is represented as number of βgal+ cells induced as a percentage of unfused Cas9 activity (100%). AU1 is used as a negative control peptide, expressed in place of C-CA. Plots were mean ± standard deviation. n = 3 or 5 biological replicates (transfected wells) per condition. Consistent results were obtained in 3 independent experiments. DOI: http://dx.doi.org/10.7554/eLife.15312.014
Figure 5.
Figure 5.. Applying Flp-DOG for optogenetic manipulation of transgenic GFP-labeled cell types in the mouse cerebellum.
(A) rAAV reagents for (BD). (B) Schematic showing delivery of rAAVs to the mouse cerebellum for cell type-specific manipulation in Tg(GAD67-GFP) animals. (C) Representative image showing that rAAV-encoded, GFP-dependent Flpo activates ChR2-mCherry expression selectively in the cerebellar cortex of Tg(GAD67-GFP) (n = 4), but not wildtype (n = 2) animals. ZsGreen is unrelated to GFP and was used as an infection marker for GFP-negative animals. Scale bar, 50 μm. (D) Optogenetic manipulation of GFP+, ChR2-mCherry+ cells. A pulse of blue light (blue bar) evoked a photocurrent at -60 mV holding potential, and an inhibitory synaptic current at 0 mV that was blocked by 5 µM of the GABAA receptor antagonist SR 95531, indicating activation of mCherry-ChR2+ cells synapsing onto the recorded PC. No photocurrents or synaptic currents were detected in GFP+/mCherry- PCs (n = 12 cells) from Tg(GAD67-GFP) animals as well as ZsGreen+/mCherry- PCs (n = 9 cells) from wildtype animals. Two-photon images show cells identified live for optogenetic manipulation and physiology. Bright ZsGreen aggregates were sometimes detected as faint signals in the mCherry channel. Scale bar, 10 μm. ZsG, ZsGreen; mC, mCherry. Additional data related to evaluation of Flp-DOG specificity for GFP expression are shown in Figure 5—figure supplements 1 and 2. DOI: http://dx.doi.org/10.7554/eLife.15312.015
Figure 5—figure supplement 1.
Figure 5—figure supplement 1.. Retrofitting transgenic GFP line for cell-specific gene manipulation in the mouse retina.
(A) Schematic of electroporation experiment. CAG-nlacZ was an electroporation marker. (B) Electroporation of CAG-driven Flp-DOG into Tg(CRX-GFP) retinas resulted in strong activation of FNF-DsRed reporter. DsRed was not detected in electroporated wildtype retinas. Scale bar, 20 μm. (C) Quantification of GFP-dependent Flpo recombination in the outer nuclear layer (ONL) of Tg(CRX-GFP) or wildtype retinas. Sample size, n = 4 retinas for GFP+ condition, n = 3 retinas for GFP-negative condition. Plots were mean ± standard deviation. Consistent results were obtained in 2 independent experiments. DOI: http://dx.doi.org/10.7554/eLife.15312.016
Figure 5—figure supplement 2.
Figure 5—figure supplement 2.. Characterization of mouse cerebella infected with AAV-Flp-DOG.
(A) Reagents for (BD). (B) Schematic showing delivery of rAAVs and green fluorescent beads to the mouse cerebellum for cell type-specific manipulation in Tg(GAD67-GFP) animals. (C) rAAV-delivered, Flp-DOG activated ChR2-mCherry expression selectively in the cerebellar cortex of GFP+, but not GFP-negative animals. Green fluorescent beads mark the site of infection. Pictures representative of 2 injected animals per condition. Scale bar, 50 μm. (D) Quantification of Flpo activity with regards to (BC). Plots show number of mCherry+ (mC+) cells counted in whole brain slices labeled with beads. All mCherry+ cells were counted in 9 and 7 whole brain sections with highest bead density, for Tg(GAD67-GFP) and GFP-negative brains, respectively. n = 2 animals per condition. (E) Quantification of Flpo activity in Tg(GAD67-GFP) animals injected with rAAV-EF1a-Flp-DOG and rAAV-FLEXFRT-ChR2-mCherry, as well as in wildtype animals injected with rAAV-EF1a-ZsGreen, rAAV-EF1a-Flp-DOG and rAAV-FLEXFRT-ChR2-mCherry. Plot shows percentage of GFP+ PCs expressing ChR2-mCherry (335 cells counted, 15 sections, 4 Gad67-GFP+ animals), and percentage of mCherry+ PCs in ZsGreen+ PCs (108 cells counted, 8 sections, 2 wildtype animals). (F) Input resistance and spontaneous firing frequency measured in GFP+, mCherry+ PCs (39 ± 6 MΩ, n = 21; 62 ± 11 Hz, n = 10) and GFP+, mCherry- PCs (50 ± 10 MΩ, n = 12; 65 ± 12 Hz, n = 7) of rAAV-injected Tg(GAD67-GFP) animals, as well as in ZsGreen+/mCherry- PCs of rAAV-injected wildtype animals (51 ± 5 MΩ, n = 9; 81 ± 13 Hz, n = 8), were not significantly different (p = 0.433 for comparisons of input resistance, p = 0.522 for comparisons of spontaneous frequency, one-way ANOVA). Values are listed as mean ± SEM. All plots show median and interquartile range. DOI: http://dx.doi.org/10.7554/eLife.15312.017
Figure 6.
Figure 6.. Detection of HIV-1 reactivated cells with a CA-specific sensor.
(A) Schematic showing isolation of HIV-1 cells via flow cytometry using αCA-specific, dNb sensor. Both ACH-2 (HIV+) and CEM (HIV-) cells were treated with 10 nM PMA prior to transfection of sensors. CAG-DsRed was a transfection marker. (B) Destabilized, but not unmodified αCA Nb enabled selective isolation of reactivated HIV-1 cells using flow cytometry (P = 0.0009 for comparison between destabilized αCA, ACH-2 vs. CEM). Plot shows median and maximum-to-minimum range. The number of biological replicates (equal to number of independent experiments) for each condition is shown in parentheses. **p<10–3, Mann-Whitney test. (C) Example of flow cytometry gating to isolate HIV-1 cells based on expression of CA. Cell populations are represented as log contour maps. Percentages of DsRed+ cells that were TagBFP+ are indicated for each condition. All cell populations were gated for DsRed expression. Results shown are representative of the number of biological replicates indicated in (B). Additional data related to HIV-1 sensors are shown in Figure 6—figure supplement 1. DOI: http://dx.doi.org/10.7554/eLife.15312.018
Figure 6—figure supplement 1.
Figure 6—figure supplement 1.. dNb sensor against HIV-1 CA enables detection and isolation of reactivated HIV-1+ cells with flow cytometry.
(A) Schematic showing isolation of HIV-1 cells via flow cytometry using HIV-1 CA-specific, red fluorescent sensor. (B) Destabilized, but not unmodified αCA Nb enabled selective isolation of reactivated HIV-1 cells using red fluorescence in flow cytometry. Plot shows median and maximum-to-minimum range. 3 independent experiments were performed for each condition, yielding 3 biological replicate values. (C) Confirmation of CA immunoreactivity in PMA-stimulated ACH-2, but not CEM cells. KC57-RD1 is a RD1 dye-conjugated, mouse monoclonal antibody that recognizes CA protein. Cell populations are represented as log contour maps. Unlike αCA-Nb6mut TagBFP, immunostaining for KC57-RD1 requires cell fixation and membrane permeabilization. DOI: http://dx.doi.org/10.7554/eLife.15312.019

Comment in

  • Falling apart.
    Marvin JS, Looger LL. Marvin JS, et al. Elife. 2016 Jun 27;5:e18203. doi: 10.7554/eLife.18203. Elife. 2016. PMID: 27345573 Free PMC article.

References

    1. Ausländer S, Stücheli P, Rehm C, Ausländer D, Hartig JS, Fussenegger M. A general design strategy for protein-responsive riboswitches in mammalian cells. Nature Methods. 2014;11:1154–1160. doi: 10.1038/nmeth.3136. - DOI - PubMed
    1. Banaszynski LA, Chen LC, Maynard-Smith LA, Ooi AG, Wandless TJ. A rapid, reversible, and tunable method to regulate protein function in living cells using synthetic small molecules. Cell. 2006;126:995–1004. doi: 10.1016/j.cell.2006.07.025. - DOI - PMC - PubMed
    1. Beier KT, Saunders A, Oldenburg IA, Miyamichi K, Akhtar N, Luo L, Whelan SP, Sabatini B, Cepko CL. Anterograde or retrograde transsynaptic labeling of CNS neurons with vesicular stomatitis virus vectors. Proceedings of the National Academy of Sciences of the United States of America. 2011;108:15414–15419. doi: 10.1073/pnas.1110854108. - DOI - PMC - PubMed
    1. Caussinus E, Kanca O, Affolter M. Fluorescent fusion protein knockout mediated by anti-GFP nanobody. Nature Structural & Molecular Biology. 2012;19:117–121. doi: 10.1038/nsmb.2180. - DOI - PubMed
    1. Chalfie M, Tu Y, Euskirchen G, Ward W, Prasher D. Green fluorescent protein as a marker for gene expression. Science. 1994;263:802–805. doi: 10.1126/science.8303295. - DOI - PubMed

Publication types