. 2016 May 20:17:373.
doi: 10.1186/s12864-016-2705-3.

Identification and functional characterization of the sulfate transporter gene GmSULTR1;2b in soybean

Affiliations

Identification and functional characterization of the sulfate transporter gene GmSULTR1;2b in soybean

Yiqiong Ding et al. BMC Genomics. .

Abstract

Background: Soybean is a major source of oil and protein in the human diet and in animal feed. However, as soybean is deficient in sulfur-containing amino acids, its nutritional value is limited. Increasing sulfate assimilation and utilization efficiency is a valuable approach to augment the concentration of sulfur-containing amino acids in soybean seeds, and sulfate transporters play important roles in both sulfate uptake and translocation within plants.

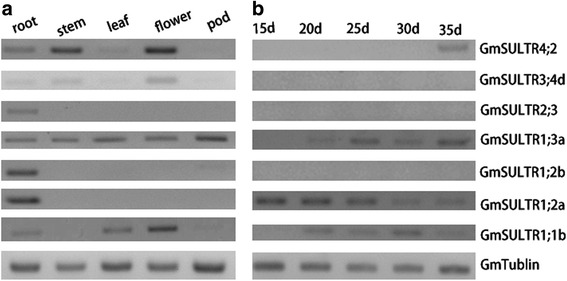
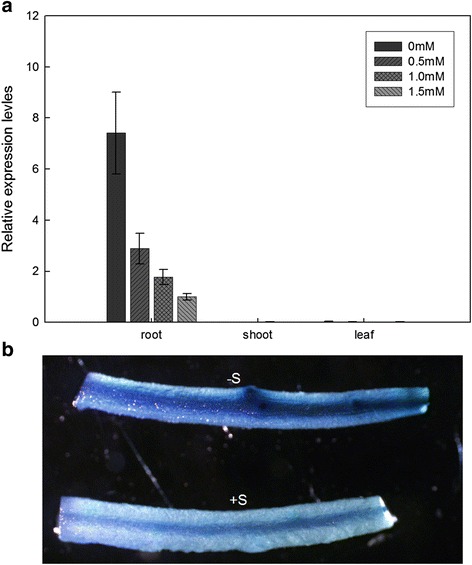
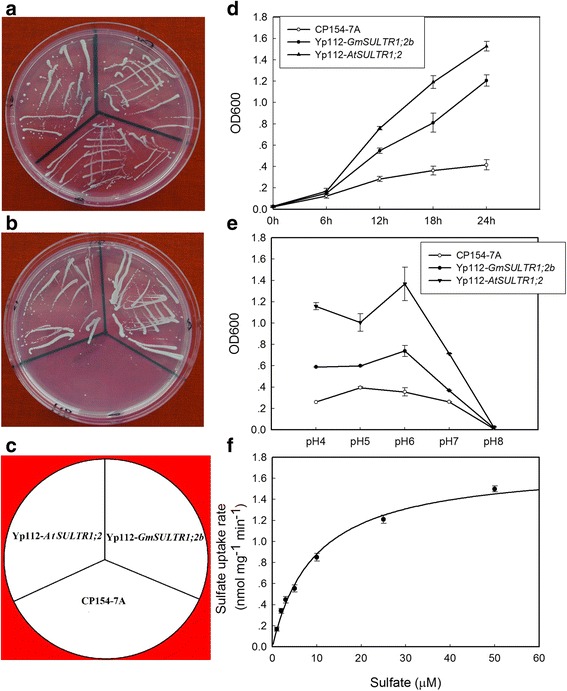
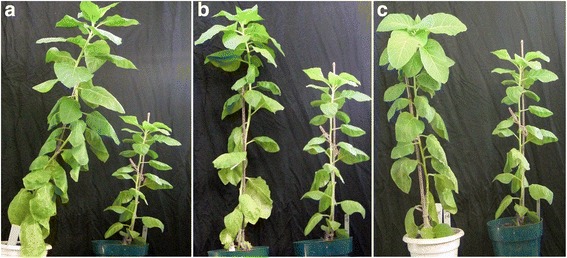
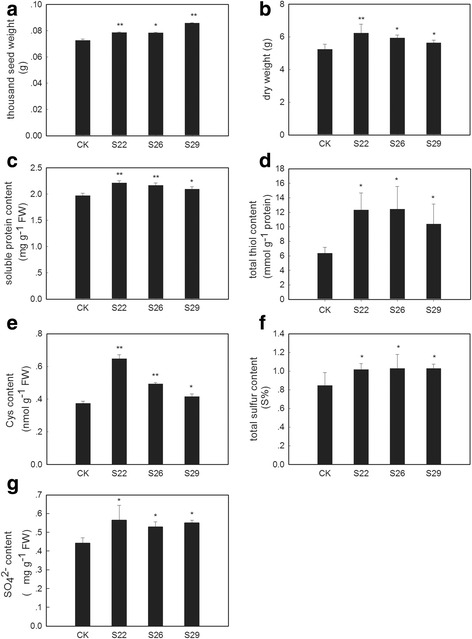
Results: In this study, we isolated and characterized a soybean sulfate transporter gene: GmSULTR1;2b. The gene was found to be specifically expressed in root tissues and induced by low-sulfur stress. In addition, GmSULTR1;2b expression in yeast could complement deficiency in the sulfate transporter genes SUL1 and SUL2. Under +S conditions, GmSULTR1;2b-overexpressing tobacco plants accumulated higher levels of organic matter and exhibited enhanced biomass and seed weight compared to control plants. Under -S conditions, acclimation of GmSULTR1;2b-overexpressing plants was much better than control plants. GmSULTR1;2b-overexpressing tobacco seedlings showed better tolerance to drought stress than the control plants, but no significant difference was observed under salt stress. Transcriptome analysis revealed 515 genes with at least a 2-fold change in expression in the leaves of tobacco plants overexpressing GmSULTR1;2b. Of these, 227 gene annotations were classified into 12 functional categories associated with 123 relevant pathways, including biosynthesis and metabolism-related proteins, stress-related proteins, and transporters.

Conclusions: The findings reported here indicate that the increased biomass and seed yield observed in transgenic tobacco plants could have resulted from greater nutrient uptake and transport capability as well as enhanced development and accumulation of organic matter. Taken together, our results indicate that GmSULTR1;2b plays an important role in sulfur uptake and could alter the sulfur status of plants. Our study suggests that overexpressing GmSULTR1;2b may enhance plant yield under +S conditions, reduce plant production loss under -S conditions, and improve plant tolerance to sulfur deficiency stress.

Keywords: GmSULTR1;2b; Low-sulfur stress; Soybean; Sulfate transporter; Sulfate uptake.


Figures

Fig. 1
Fig. 1
Phylogenetic analysis of predicted sulfate transporter amino acid sequences from soybean. A phylogenetic tree was generated using putative amino acid sequences with MEGA 5 and the neighbor-joining method. Bootstrap values support percentages from 1000 replicate trees. The scale bar indicates 0.1 substitutions per site in the amino acid sequence. The putative protein sequence accession numbers are provided in Additional file 1: Table S2
Fig. 2
Fig. 2
Expression profiling of 7 putative soybean SULTR genes. (a) Expression profiling of 7 putative soybean SULTR genes in different tissues using semi-quantitative RT-PCR. (b) Expression profiling of 7 putative soybean SULTR genes at different days after flowering using semi-quantitative RT-PCR
Fig. 3
Fig. 3
GmSULTR1;2b gene expression pattern in response to sulfur availability. (a) Real-time RT-PCR of the expression level of GmSULTR1;2b in different tissues of soybean plants treated for 10 days with 0 mM (−S) or 0.5, 1.0, and 1.5 mM MgSO4 (+S). (b) GUS staining of transgenic soybean hairy roots containing the GmSULTR1;2b promoter::GUS fusion protein, which was transformed into soybean cotyledons by A. rhizogenes. Error bars represent the standard deviation
Fig. 4
Fig. 4
Functional expression of GmSULTR1;2b in yeast. (a) YNB solid culture medium containing 0.1 mM homocysteine. (b) YNB solid culture medium containing 0.1 mM sodium sulfate. (c) The position of each yeast strain on the plates. (d) Growth curves generated from a 24 h culture grown in YNB liquid culture medium containing 0.1 mM sodium sulfate. (e) Effects of culture medium pH on the growth of the three yeast strains grown in YNB liquid culture medium containing 0.1 mM sodium sulfate. (f) Uptake of 35S-labeled sulfate by Yp112-GmSULTR1;2b yeast cells. Sulfate uptake rates were calculated after transferring the cells to media containing different external sulfate concentrations at pH 6.0. Error bars represent the standard deviation. CP154-7A, CP154-7A mutant strain transformed with the empty vector (as a negative control); Yp112-AtSULTR1;2, CP154-7A transformed with Yp112-AtSULTR1;2 (as a positive control); Yp112-GmSULTR1;2b, CP154-7A transformed with Yp112-GmSULTR1;2b
Fig. 5
Fig. 5
Phenotype of GmSULTR1;2b-overexpressing tobacco plants. (a) The GmSULTR1;2b-overexpressing S22 line plant grown under normal conditions in soil is shown on the left and the control plant (CK) on the right. (b) The S26 line plant is shown on the left and the CK plant on the right. (c) The S29 line plant is shown on the left and the CK plant on the right
Fig. 6
Fig. 6
Biomass, yield and content of sulfur-containing compounds in GmSULTR1;2b-overexpressing tobacco plants grown under +S conditions. (a) Thousand seed weight of seeds from GmSULTR1;2b-overexpressing tobacco plants and control plants grown in soil. (b) Dry weights of 2-month-old whole GmSULTR1;2b-overexpressing tobacco plants and whole control plants grown under +S (1.5 mM MgSO4) conditions. (c) Soluble protein content in the functional leaves of 2-month-old GmSULTR1;2b-overexpressing tobacco plants and control plants grown under +S conditions. (d) Total thiol content in the functional leaves of 2-month-old GmSULTR1;2b-overexpressing tobacco plants and control plants grown under +S conditions. (e) Cys content in the functional leaves of GmSULTR1;2b-overexpressing tobacco plants and control plants grown under +S conditions. (f) Total sulfur content in the functional leaves of 2-month-old GmSULTR1;2b-overexpressing tobacco plants and control plants grown under +S conditions. (g) Sulfate ion content in whole roots of 2-month-old GmSULTR1;2b-overexpressing tobacco plants and control plants grown under +S conditions. Three biological replicates were performed. Error bars represent the standard deviation. Asterisks (*) indicate significant differences at P < 0.05 (Student’s t-test), and double asterisks (**) indicate significant differences at P < 0.01 (Student’s t-test). CK, tobacco plant transformed with the pMDC83 empty vector as a control; S22, S26 and S29, tobacco plants transformed with GmSULTR1;2b, FW fresh weight
Fig. 7
Fig. 7
Phenotype of GmSULTR1;2b-overexpressing tobacco plants under +S and -S conditions. (a) Plants of the line S22 grown under +S conditions (1.5 mM MgSO4) for 2 weeks. (b) Plants of the line S26 grown under +S conditions for 2 weeks. (c) Plants of the line S29 grown under +S conditions for 2 weeks. (d) Control plants grown under +S conditions for 2 weeks. (e) Plants of the line S22 grown under -S conditions (0 mM MgSO4) for 2 weeks. (f) Plants of the line S26 grown under -S conditions for 2 weeks. (g) Plants of the line S29 grown under -S conditions for 2 weeks. (h) Control plants grown under -S conditions for 2 weeks
Fig. 8
Fig. 8
Biomass and content of sulfur-containing compounds in GmSULTR1;2b-overexpressing tobacco plants grown under -S conditions. (a) Dry weights of 2-month-old whole GmSULTR1;2b-overexpressing tobacco plants and whole control plants under -S (0 mM MgSO4) conditions. (b) Chlorophyll content of the leaves of GmSULTR1;2b-overexpressing tobacco plants and control plants grown under -S conditions for 2 weeks. (c) Soluble protein content in the functional leaves of 2-month-old GmSULTR1;2b-overexpressing tobacco plants and control plants grown under -S conditions. (d) Total thiol content in the functional leaves of 2-month-old GmSULTR1;2b-overexpressing tobacco plants and control plants grown under -S conditions. (e) Sulfate ion content in whole roots of 2-month-old GmSULTR1;2b-overexpressing tobacco plants and control plants grown under -S conditions. Three biological replicates were performed. Error bars represent the standard deviation. Asterisks (*) indicate significant differences at P < 0.05 (Student’s t-test), and double asterisks (**) indicate significant differences at P < 0.01 (Student’s t-test). CK, tobacco plant transformed with the pMDC83 empty vector as a control; S22, S26 and S29, tobacco plants transformed with GmSULTR1;2b, FW fresh weight
Fig. 9
Fig. 9
GmSULTR1;2b-overexpressing tobacco plants grown under 200 mM mannitol treatment. (a) Phenotypes of GmSULTR1;2b-overexpressing tobacco seedlings grown under 200 mM mannitol treatment for 4 weeks. (b) Fresh weight of GmSULTR1;2b-overexpressing tobacco seedlings grown under 200 mM mannitol treatment. (c) Root length of GmSULTR1;2b-overexpressing tobacco seedlings grown under 200 mM mannitol treatment. (d) Number of lateral roots of GmSULTR1;2b-overexpressing tobacco seedlings grown under 200 mM mannitol treatment. Ten biological replicates were performed. Error bars represent the standard deviation. Asterisks (*) indicate significant differences at P < 0.05 (Student’s t-test), and double asterisks (**) indicate significant differences at P < 0.01 (Student’s t-test). CK, tobacco plant transformed with the pMDC83 empty vector as a control; S22, S26 and S29, tobacco plants transformed with GmSULTR1;2b. Scale bar = 1 cm
Fig. 10
Fig. 10
GmSULTR1;2b-overexpressing tobacco plants grown under 200 mM NaCl treatment. (a) Phenotypes of GmSULTR1;2b-overexpressing tobacco seedlings grown under 200 mM NaCl treatment for 4 weeks. (b) Fresh weight of GmSULTR1;2b-overexpressing tobacco seedlings grown under 200 mM NaCl treatment. (c) Root length of GmSULTR1;2b-overexpressing tobacco seedlings grown under 200 mM NaCl treatment. (d) Number of lateral roots of GmSULTR1;2b-overexpressing tobacco seedlings grown under 200 mM NaCl treatment. Ten biological replicates were performed. Error bars represent the standard deviation. Asterisks (*) indicate significant differences at P < 0.05 (Student’s t-test), and double asterisks (**) indicate significant differences at P < 0.01 (Student’s t-test). CK, tobacco plant transformed with the pMDC83 empty vector as a control; S22, S26 and S29, tobacco plants transformed with GmSULTR1;2b. Scale bar = 1 cm
Fig. 11
Fig. 11
Overview of the microarray results for tobacco leaves showing ≥ 2.0-fold differences in expression. The number of genes in one of the 12 identified functional categories: cytoskeleton-related proteins; transcription factors; biosynthesis and metabolism-related proteins; cell wall-related proteins; plant defense response-related protein; stress-related proteins; development process-related proteins; redox-related proteins; hormone-related proteins; transporters; photosynthesis-related proteins; and unclassified functional proteins on the basis of gene ontology (http://bioinfo.capitalbio.com/mas3/) and gene annotations (NCBI and TIGR)

References

    1. Marsolaisa F, Pajaka A, Yin FQ, Taylora M, Gabriela M, Merino DM, et al. Proteomic analysis of common bean seed with storage protein deficiency reveals up-regulation of sulfur-rich proteins and starch and raffinose metabolic enzymes, and down-regulation of the secretory pathway. J Proteomics. 2010;73:1587–600. doi: 10.1016/j.jprot.2010.03.013. - DOI - PubMed
    1. Chandler PM, Spencer D, Randall PJ, Higgins TJV. Influence of sulfur nutrition on development of some major pea seed proteins and their mRNAs. Plant Physiol. 1984;75:651–7. doi: 10.1104/pp.75.3.651. - DOI - PMC - PubMed
    1. Scherer HW. Sulphur in crop production–invited paper. Europ J Agron. 2001;14:81–111. doi: 10.1016/S1161-0301(00)00082-4. - DOI
    1. Bao R, Zheng S. Progress on soil sulfur fertility and crop sulfur nutrition. J Heilongjiang Bayi Agricultural University. 2006;18:37–40.
    1. Buchner P, Parmar S, Kriegel A, Carpentier M, Hawkesford M. The sulfate transporter family in wheat: tissue-specific gene expression in relation to nutrition. Mol Plant. 2010;3:374–89. doi: 10.1093/mp/ssp119. - DOI - PubMed

Publication types