. 2016 Jul 1;129(13):2613-24.
doi: 10.1242/jcs.190124. Epub 2016 May 20.

TOR complex 2 localises to the cytokinetic actomyosin ring and controls the fidelity of cytokinesis

Affiliations

TOR complex 2 localises to the cytokinetic actomyosin ring and controls the fidelity of cytokinesis

Karen Baker et al. J Cell Sci. .

Abstract

The timing of cell division is controlled by the coupled regulation of growth and division. The target of rapamycin (TOR) signalling network synchronises these processes with the environmental setting. Here, we describe a novel interaction of the fission yeast TOR complex 2 (TORC2) with the cytokinetic actomyosin ring (CAR), and a novel role for TORC2 in regulating the timing and fidelity of cytokinesis. Disruption of TORC2 or its localisation results in defects in CAR morphology and constriction. We provide evidence that the myosin II protein Myp2 and the myosin V protein Myo51 play roles in recruiting TORC2 to the CAR. We show that Myp2 and TORC2 are co-dependent upon each other for their normal localisation to the cytokinetic machinery. We go on to show that TORC2-dependent phosphorylation of actin-capping protein 1 (Acp1, a known regulator of cytokinesis) controls CAR stability, modulates Acp1-Acp2 (the equivalent of the mammalian CAPZA-CAPZB) heterodimer formation and is essential for survival upon stress. Thus, TORC2 localisation to the CAR, and TORC2-dependent Acp1 phosphorylation contributes to timely control and the fidelity of cytokinesis and cell division.

Keywords: Acp1; CAPZA; Myosin II; Myosin V; Rictor; Schizosaccharomyces pombe; TOR; TORC2.


Conflict of interest statement

Competing interests

The authors declare no competing or financial interests.

Figures
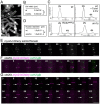
Fig. 1.
Fig. 1.
TORC2-deficient mutants display defects in cytokinesis and cell fission. (A) Early exponential wild-type (wt) and Rictorste20Δ (ste20Δ) prototroph cells were stained with Calcofluor to visualise the division septa. Scale bar: 10 µm. These cells, as well as sin1Δ cells and cells treated with Torin1, were (C) processed for flow cytometry analysis to measure DNA content. Mean cell width (B) and nuclear diameter (D) were each determined from counting 300 wild-type and Rictorste20Δ cells in mid-log culture. ***P<0.001, ns, not significant (Student's t-test). (E) A montage of time-lapse images showing red fluorescence from myo2–mCherry sid4–tdTomato cells undergoing cell division. Cells illustrating timing of CAR formation and constriction in relation to SPB segregation in wild-type cells are shown. (F,G) Equivalent montages of time-lapse images of mCherry (magenta) and GFP (green) fluorescene from myo2–mCherry cut12–gfp Rictorste20Δ cells. In a large proportion of anaphase Rictorste20Δ cells the CAR was seen to either collapse (arrowhead, F) or drift along the cortex towards one end of the cell (arrows, G). Scale bars: 5 µm.
Fig. 2.
Fig. 2.
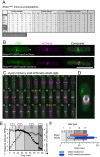
TORC2 interacts with and localises to the CAR during ring constriction. (A) Summary of mass spectrometry analysis of three independent experiments of control (Ctrl, no anti-Tor1 antibodies added) and Tor1 immunoprecipitations (Exp), each purified from 20-l cell cultures. (B) Micrographs of RICTORSte20 (green) and Myo2 or Myo51 (magenta) signal from mitotic RICTORSte203GFP myo2–mCherry cells or RICTORSte203GFP myo51–mCherry cells. (C,D) Maximum projections of 21-slice z-stacks from a timecourse of mitotic myo2–mCherry sid4–tdTomato RICTORSte203GFP cells reveals that RICTORSte20 foci (green) are recruited to the cell equator after SPB (magenta) separation and Myo2 ring (magenta) formation has occurred (frame 1–4 with non-separated SPBs represent interphase cells) (C) and coalesce to form a ring during CAR constriction. (D) Micrograph of mCherry and GFP signal from a RICTORSte203GFP myo2–mCherry cell illustrating TORC2 association with the CAR. In B and C, arrowheads highlight RICTORSte20 localisation at cell tips. (E) The timing of key events during CAR formation and constriction [(I) Myo2 foci (empty circles) recruit to the cell equator; (II) Myo2 foci coalesce to form a CAR (filled circles); (III) the CAR constricts until, (IV) it reaches a diameter of 0.5 µm or less] were determined in relation to nuclear division (crosses, distance between SPBs) in wild-type. (F) The timing of the appearance of Myp2 ring (red bar) and RICTORSte20 medial foci (light blue bar) or RICTORSte20 ring recruitment (dark blue) were determined in wild-type strains in relation to the events determined in E. Scale bars: 10 µm.
Fig. 3.
Fig. 3.
Myosin II and V interact with and regulate RICTORSte20 localisation at the CAR. (A) Extract and subsequent anti-GFP and anti-HA (control) immunoprecipitates from S. pombe cells expressing a GFP-tagged Myo51 cargo-binding-tail domain fusion protein were subject to anti-Tor1 (upper panels) and anti-GFP (lower panels) antibody western blot analysis. The asterisks denote background bands. (B–E) Micrographs of mCherry and GFP signals in cells with the indicated genotype. The asterisk highlights rings split in two. Arrowheads highlight RICTORSte20 localisation at cell tips. (F) The timing of the appearance of RICTORSte20 medial foci (light blue bars) or RICTORSte20 ring recruitment (dark blue) were determined in wild-type and myp2Δ strains in relation to the events determined in Fig. 2E. Scale bars: 5 µm.
Fig. 4.
Fig. 4.
Myp2 and TORC2 localisation to the actomyosin ring is co-dependent. (A) The timing of Myp2 ring recruitment (red bars) was determined in wild-type and Rictorste20Δ strains in relation to the events determined in Fig. 2E. (B) Composite micrographs of YFP and phase signal in yfp–myp2 Rictorste20+ and yfp–myp2 Rictorste20Δ cells. (C–E) Kymographs generated from 30 maximum projections of time-lapse images (3 min/frame) of (C) myo2–mCherry YFP–myp2 and (D) myo2–mCherry YFP–myp2 Rictorste20Δ cells illustrating that TORC2 is required for Myp2 to remain at the CAR. (E) Time-lapse kymographs of the perpendicular (upper panels) and longitudinal (lower panels) axes of a yfp–myp2 Rictorste20Δ cell in which Myp2 signal is lost from the cell equator and the Myo2-containing CAR slides along the cell cortex before constricting. In C–E, cartoons illustrate orientation and origin of kymograph axes. Scale bars: 5 µm (B); 1 µm (C–E).
Fig. 5.
Fig. 5.
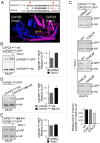
TORC2 regulates CAPZA Acp1–CAPZBAcp2 heterodimer formation. (A) Alignment of the phosphorylated region of S. pombe Acp1 and the human CAPZA homologues. Conserved residues are highlighted in bold and the two TOR-dependent phosphorylation sites are shown in red. The position of the conserved phosphorylated serine 208 (in yellow) is shown on the crystal structure of CAPZA and CAPZB (Yamashita et al., 2003). (B–D) Anti-GFP (upper panels) and anti-HA (lower panels) antibody western blots of CAPZAAcp1−HA immunoprecipitations (HA-IPs) from indicated strains in the absence or presence of the TOR inhibitor Torin1 (25 µM) (TORC1R=tor2.G2037D TORC2R=tor1.G2040D). (B–E) To ensure the measured relative levels of Acp1 and Acp2 within anti-HA immunoprecipitates were quantifiable, western blot membranes of immuno-precipitates were cut in half and the separate portions were subsequently probed with anti-GFP (upper panels) and anti-HA (lower panels) antibodies.
Fig. 6.
Fig. 6.
CAPZAacp1-AA mutants disrupt actin dynamics and cytokinesis. (A) The timing of the appearance of Myp2 ring (red bars), RICTORSte20 foci (light blue bars), Acp1 (yellow bars) medial recruitment and RICTORSte20 ring recruitment (dark blue) were determined in wild-type, myp2Δ, Rictorste20Δ (ste20Δ) and acp1Δ strains in relation to the events determined in Fig. 2E. Recruitment of these proteins to the CAR were observed in less than 40% (*) or 50% (**) of these deletion strains. CAR dynamics and composition were followed in >20 cells for each strain. Early exponential prototrophs were used in each experiment. (B) mCherry kymographs generated from 100 timeframe maximum projections from 13 z-plane images of CAPZAacp1+ Lifeact-mCherry (left panels) and CAPZAacp1-AA Lifeact-mCherry (right panels) cells (0.6 s/frame). (C) Graph showing lifetime kinetics of Lifeact signal from individual (faint lines) actin patches and overall averages (thick lines) of CAPZAacp1+ Lifeact-mCherry (black lines) and CAPZAacp1-AA Lifeact–mCherry (red lines) cells. (D) Maximum projections of a mixture of CAPZAacp1–GFP Lifeact–mCherry and CAPZAacp1–AA Lifeact–mCherry cells. Overlaying the GFP (green) and mCherry (magenta) signals demonstrate the increase in actin signal at cortical actin patches in the CAPZAacp1-AA mutant compared to GFP-labelled wild type (arrows) cells. (E) Histograms illustrating mean±s.d. relative Cdc8 at the CAR in wild-type (WT) and CAPZAacp1-AA cells (n>30 per strain).
Fig. 7.
Fig. 7.
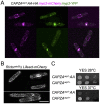
TORC2 and CAPZAacp1-AA mutants disrupt CAR and actin localisation. (A) Micrographs of Myo2 (magenta) and YFP (green) signal CAPZAacp1-AAHA myo2–mCherry YFP–myp2 cells. (B) Micrograph of mCherry signal from Rictorste20Δ Lifeact–mCherry cells illustrating the cytokinesis defect and lack of polarised actin signal. Scale bar: 10 μm. (C) The CAPZAAcp1 phosphorylation site mutant CAPZAacp1−AA is sensitive to heat stress at 37°C.

Similar articles

Cited by

References

    1. Alvarez B. and Moreno S. (2006). Fission yeast Tor2 promotes cell growth and represses cell differentiation. J. Cell Sci. 119, 4475-4485. 10.1242/jcs.03241 - DOI - PubMed
    1. Atkin J., Halova L., Ferguson J., Hitchin J. R., Lichawska-Cieslar A., Jordan A. M., Pines J., Wellbrock C. and Petersen J. (2014). Torin1-mediated TOR kinase inhibition reduces Wee1 levels and advances mitotic commitment in fission yeast and HeLa cells. J. Cell Sci. 127, 1346-1356. 10.1242/jcs.146373 - DOI - PMC - PubMed
    1. Bähler J., Wu J.-Q., Longtine M. S., Shah N. G., McKenzie A. III, Steever A. B., Wach A., Philippsen P. and Pringle J. R. (1998). Heterologous modules for efficient and versatile PCR-based gene targeting in Schizosaccharomyces pombe. Yeast 14, 943-951. 10.1002/(SICI)1097-0061(199807)14:10<943::AID-YEA292>3.0.CO;2-Y - DOI - PubMed
    1. Bezanilla M., Forsburg S. L. and Pollard T. D. (1997). Identification of a second myosin-II in Schizosaccharomyces pombe: Myp2p is conditionally required for cytokinesis. Mol. Biol. Cell 8, 2693-2705. 10.1091/mbc.8.12.2693 - DOI - PMC - PubMed
    1. Borchert N., Dieterich C., Krug K., Schutz W., Jung S., Nordheim A., Sommer R. J. and Macek B. (2010). Proteogenomics of Pristionchus pacificus reveals distinct proteome structure of nematode models. Genome Res. 20, 837-846. 10.1101/gr.103119.109 - DOI - PMC - PubMed

MeSH terms