

Host-induced aneuploidy and phenotypic diversification in the Sudden Oak Death pathogen Phytophthora ramorum
- PMID: 27206972
- PMCID: PMC4875591
- DOI: 10.1186/s12864-016-2717-z
Host-induced aneuploidy and phenotypic diversification in the Sudden Oak Death pathogen Phytophthora ramorum
Abstract
Background: Aneuploidy can result in significant phenotypic changes, which can sometimes be selectively advantageous. For example, aneuploidy confers resistance to antifungal drugs in human pathogenic fungi. Aneuploidy has also been observed in invasive fungal and oomycete plant pathogens in the field. Environments conducive to the generation of aneuploids, the underlying genetic mechanisms, and the contribution of aneuploidy to invasiveness are underexplored. We studied phenotypic diversification and associated genome changes in Phytophthora ramorum, a highly destructive oomycete pathogen with a wide host-range that causes Sudden Oak Death in western North America and Sudden Larch Death in the UK. Introduced populations of the pathogen are exclusively clonal. In California, oak (Quercus spp.) isolates obtained from trunk cankers frequently exhibit host-dependent, atypical phenotypes called non-wild type (nwt), apparently without any host-associated population differentiation. Based on a large survey of genotypes from different hosts, we previously hypothesized that the environment in oak cankers may be responsible for the observed phenotypic diversification in P. ramorum.
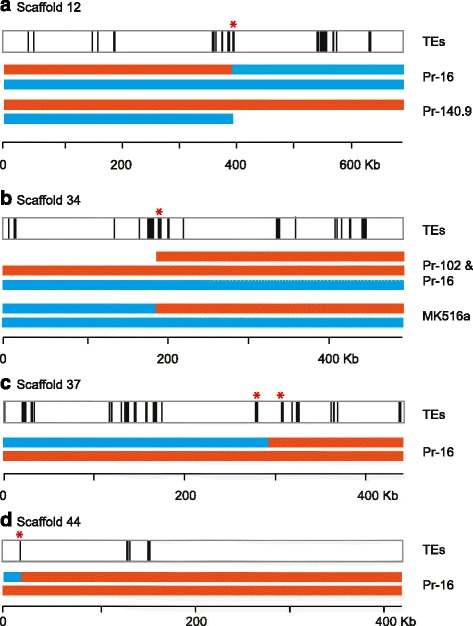
Results: We show that both normal wild type (wt) and nwt phenotypes were obtained when wt P. ramorum isolates from the foliar host California bay (Umbellularia californica) were re-isolated from cankers of artificially-inoculated canyon live oak (Q. chrysolepis). We also found comparable nwt phenotypes in P. ramorum isolates from a bark canker of Lawson cypress (Chamaecyparis lawsoniana) in the UK; previously nwt was not known to occur in this pathogen population. High-throughput sequencing-based analyses identified major genomic alterations including partial aneuploidy and copy-neutral loss of heterozygosity predominantly in nwt isolates. Chromosomal breakpoints were located at or near transposons.
Conclusion: This work demonstrates that major genome alterations of a pathogen can be induced by its host species. This is an undocumented type of plant-microbe interaction, and its contribution to pathogen evolution is yet to be investigated, but one of the potential collateral effects of nwt phenotypes may be host survival.
Keywords: Aneuploidy; Invasive pathogens; Loss of heterozygosity; Transposable elements.
Figures
Similar articles
-
Phenotypic diversification is associated with host-induced transposon derepression in the sudden oak death pathogen Phytophthora ramorum.PLoS One. 2012;7(4):e34728. doi: 10.1371/journal.pone.0034728. Epub 2012 Apr 18. PLoS One. 2012. PMID: 22529930 Free PMC article.
-
Characterization of phenotypic variation and genome aberrations observed among Phytophthora ramorum isolates from diverse hosts.BMC Genomics. 2018 May 2;19(1):320. doi: 10.1186/s12864-018-4709-7. BMC Genomics. 2018. PMID: 29720102 Free PMC article.
-
Phytophthora ramorum: a pathogen with a remarkably wide host range causing sudden oak death on oaks and ramorum blight on woody ornamentals.Mol Plant Pathol. 2008 Nov;9(6):729-40. doi: 10.1111/j.1364-3703.2008.00500.x. Mol Plant Pathol. 2008. PMID: 19019002 Free PMC article. Review.
-
Mitotic Recombination and Rapid Genome Evolution in the Invasive Forest Pathogen Phytophthora ramorum.mBio. 2019 Mar 12;10(2):e02452-18. doi: 10.1128/mBio.02452-18. mBio. 2019. PMID: 30862749 Free PMC article.
-
Emergence of the sudden oak death pathogen Phytophthora ramorum.Trends Microbiol. 2012 Mar;20(3):131-8. doi: 10.1016/j.tim.2011.12.006. Epub 2012 Feb 9. Trends Microbiol. 2012. PMID: 22326131 Review.
Cited by
-
Karyotype variation, spontaneous genome rearrangements affecting chemical insensitivity, and expression level polymorphisms in the plant pathogen Phytophthora infestans revealed using its first chromosome-scale assembly.PLoS Pathog. 2022 Oct 10;18(10):e1010869. doi: 10.1371/journal.ppat.1010869. eCollection 2022 Oct. PLoS Pathog. 2022. PMID: 36215336 Free PMC article.
-
Comparative genomics of downy mildews reveals potential adaptations to biotrophy.BMC Genomics. 2018 Nov 29;19(1):851. doi: 10.1186/s12864-018-5214-8. BMC Genomics. 2018. PMID: 30486780 Free PMC article.
-
Using genomics to understand the mechanisms of virulence and drug resistance in fungal pathogens.Biochem Soc Trans. 2022 Jun 30;50(3):1259-1268. doi: 10.1042/BST20211123. Biochem Soc Trans. 2022. PMID: 35713390 Free PMC article. Review.
-
Genomic biosurveillance of forest invasive alien enemies: A story written in code.Evol Appl. 2019 Sep 10;13(1):95-115. doi: 10.1111/eva.12853. eCollection 2020 Jan. Evol Appl. 2019. PMID: 31892946 Free PMC article. Review.
-
Phytophthora megakarya and P. palmivora, closely related causal agents of cacao black pod rot, underwent increases in genome sizes and gene numbers by different mechanisms.Genome Biol Evol. 2017 Feb 10;9(3):536-57. doi: 10.1093/gbe/evx021. Online ahead of print. Genome Biol Evol. 2017. PMID: 28186564 Free PMC article.
References
-
- Davis M. Invasion biology. New York: Oxford University Press; 2009.
-
- Brasier CM. Episodic selection as a force in fungal microevolution, with special reference to clonal speciation and hybrid introgression. Can J Bot. 1995;73:S1213–S1221. doi: 10.1139/b95-381. - DOI
-
- Goodwin SB, Sujkowski LS, Fry WE. Rapid evolution of pathogenicity within clonal lineages of the potato late blight disease fungus. Phytopathology. 1995;85(6):669–676. doi: 10.1094/Phyto-85-669. - DOI
-
- Hüberli D, Tommerup IC, Dobrowolski MP, Calver MC, Hardy GESJ. Phenotypic variation in a clonal lineage of two Phytophthora cinnamomi populations from Western Australia. Mycol Res. 2001;105:1053–1064. doi: 10.1016/S0953-7562(08)61967-X. - DOI
Publication types
MeSH terms
Substances
LinkOut - more resources
Full Text Sources
Other Literature Sources
Molecular Biology Databases
Miscellaneous
