. 2016 May 1;21(5):56004.
doi: 10.1117/1.JBO.21.5.056004.

In vivo photoacoustic microscopy of human cuticle microvasculature with single-cell resolution

In vivo photoacoustic microscopy of human cuticle microvasculature with single-cell resolution

Hsun-Chia Hsu et al. J Biomed Opt. .

Abstract

As a window on the microcirculation, human cuticle capillaries provide rich information about the microvasculature, such as its morphology, density, dimensions, or even blood flow speed. Many imaging technologies have been employed to image human cuticle microvasculature. However, almost none of these techniques can noninvasively observe the process of oxygen release from single red blood cells (RBCs), an observation which can be used to study healthy tissue functionalities or to diagnose, stage, or monitor diseases. For the first time, we adapted single-cell resolution photoacoustic (PA) microscopy (PA flowoxigraphy) to image cuticle capillaries and quantified multiple functional parameters. Our results show more oxygen release in the curved cuticle tip region than in other regions of a cuticle capillary loop, associated with a low of RBC flow speed in the tip region. Further analysis suggests that in addition to the RBC flow speed, other factors, such as the drop of the partial oxygen pressure in the tip region, drive RBCs to release more oxygen in the tip region.


Figures

Fig. 1
Fig. 1
Schematic of the single-cell OR-PAM system. BS, beam splitter; CG, coverglass; LSM, linear step motor; PD, photodiode; PH, pin hole; PM, plastic membrane; UG, ultrasound gel; UT, ultrasound transducer; VC, voice coil motor; and WT, water.
Fig. 2
Fig. 2
(a) Photograph of a finger with the imaged area boxed. (b) Wide-field PA image of cuticle capillaries shown with normalized PA amplitude. The insets show sO2 images of selected cuticles with different color bars. (c) B-scan image of cuticle capillary loops. (d) Curvature along the cuticles (fitting: sum of two Gaussians).
Fig. 3
Fig. 3
(a) Selected time-lapse images of single-RBC sO2 (Video 1, MPEG, 207 KB) [URL: http://dx.doi.org/10.1117/1.JBO.21.5.056004.1]. (b) Time-averaged images (10  s) of all time-lapse frames of sO2 imaging. (c) Time-averaged sO2 along the length of a cuticle capillary loop (i.e., a trace of the blood flow). (d) Time-averaged directional derivative of sO2 along the length of the loops. (e) Statistics of (d): paired Student’s t-test between the tip region (yellow) and the two side regions (green). NS: not significant (P=0.48), ***P<0.001, and n=21.
Fig. 4
Fig. 4
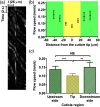
(a) Image for speed measurement. (b) Time-averaged RBC flow speeds along the length of a cuticle loop. (c) Statistics of (b): paired Student’s t-test between the tip region (yellow) and the two side regions (green). NS: not significant (P=0.45), ***P<0.001, **P<0.01, and n=18.
Fig. 5
Fig. 5
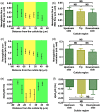
(a) Time-averaged relative flow rates along the length of cuticle capillary loops. (b) Statistics of (a): paired Student’s t-test between the tip region (yellow) and the two side regions (green). NS: not significant (up: P=0.24, left: P=0.10, right: P=0.40), n=13. (c) Time-averaging of hemoglobin concentration along the direction of the length of cuticles. (d) Statistics of (c): paired Student’s t-test between the tip region (yellow) and the two side regions (green). NS: not significant (up: P=0.33, left: P=0.45, right: P=0.21), n=18. (e) Time-averaged values of d(sO2)/dt along the length of cuticle capillary loops. (f) Statistics of (e): paired Student’s t-test between the tip region (yellow) and the two side regions (green). *P=0.03, NS: not significant (up: P=0.07, down: P=0.25), n=15.

References

    1. De Backer D., et al. , “Monitoring the microcirculation in the critically ill patient: current methods and future approaches,” Intensive Care Med. 36(11), 1813–1825 (2010).ICMED9ICMED910.1007/s00134-010-2005-3 - DOI - PubMed
    1. De Backer D., Donadello K., Cortes D. O., “Monitoring the microcirculation,” J. Clin. Monit. Comput. 26(5), 361–366 (2012).10.1007/s10877-012-9383-8 - DOI - PubMed
    1. Carwile Leroy E., Cannon P. J., “Skin capillary blood flow in scleroderma,” J. Clin. Invest. 50(4), 930–939 (1971).JCINAOJCINAO10.1172/JCI106565 - DOI - PMC - PubMed
    1. Murray A. K., et al. , “Preliminary clinical evaluation of semi-automated nailfold capillaroscopy in the assessment of patients with Raynaud’s phenomenon,” Microcirculation 18(6), 440–447 (2011).MCCRD8MCCRD810.1111/micc.2011.18.issue-6 - DOI - PubMed
    1. Rossi D., et al. , “The role of nail-videocapillaroscopy in early diagnosis of scleroderma,” Autoimmun. Rev. 12(8), 821–825 (2013).10.1016/j.autrev.2012.11.006 - DOI - PubMed

Publication types