. 2016 Aug;65(8):2187-200.
doi: 10.2337/db16-0213. Epub 2016 May 10.

Lipodystrophy Due to Adipose Tissue-Specific Insulin Receptor Knockout Results in Progressive NAFLD

Affiliations

Lipodystrophy Due to Adipose Tissue-Specific Insulin Receptor Knockout Results in Progressive NAFLD

Samir Softic et al. Diabetes. 2016 Aug.

Abstract

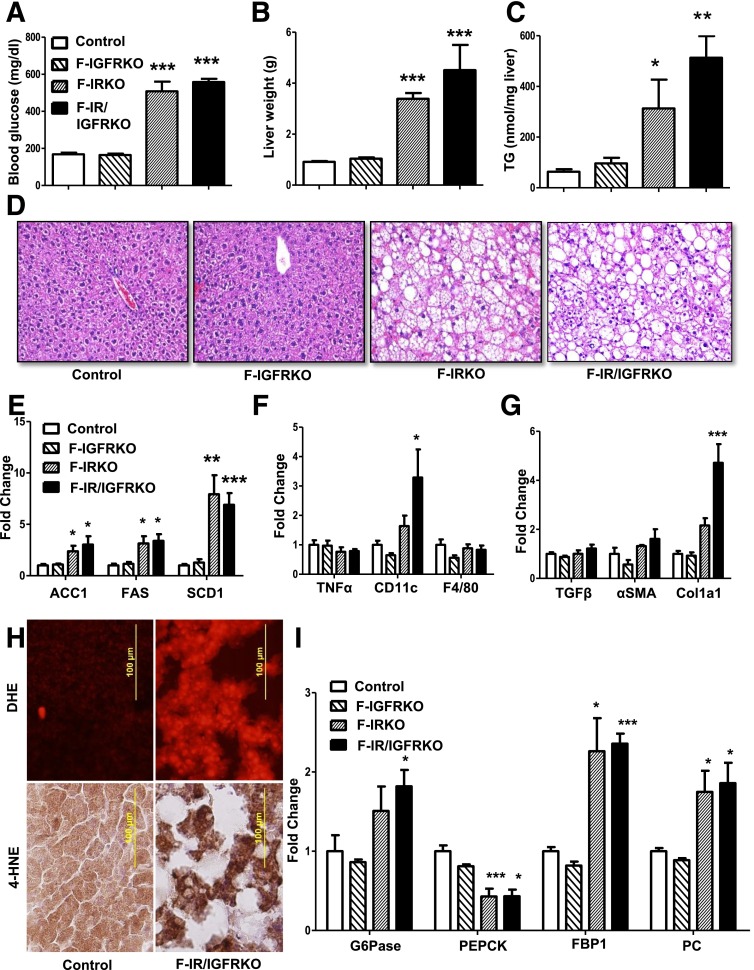
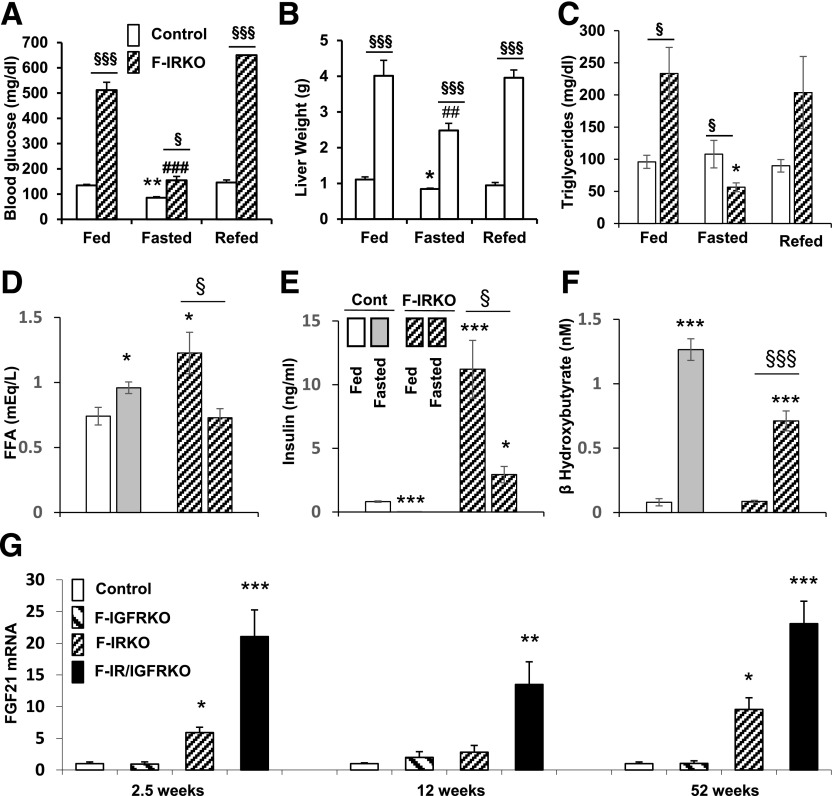
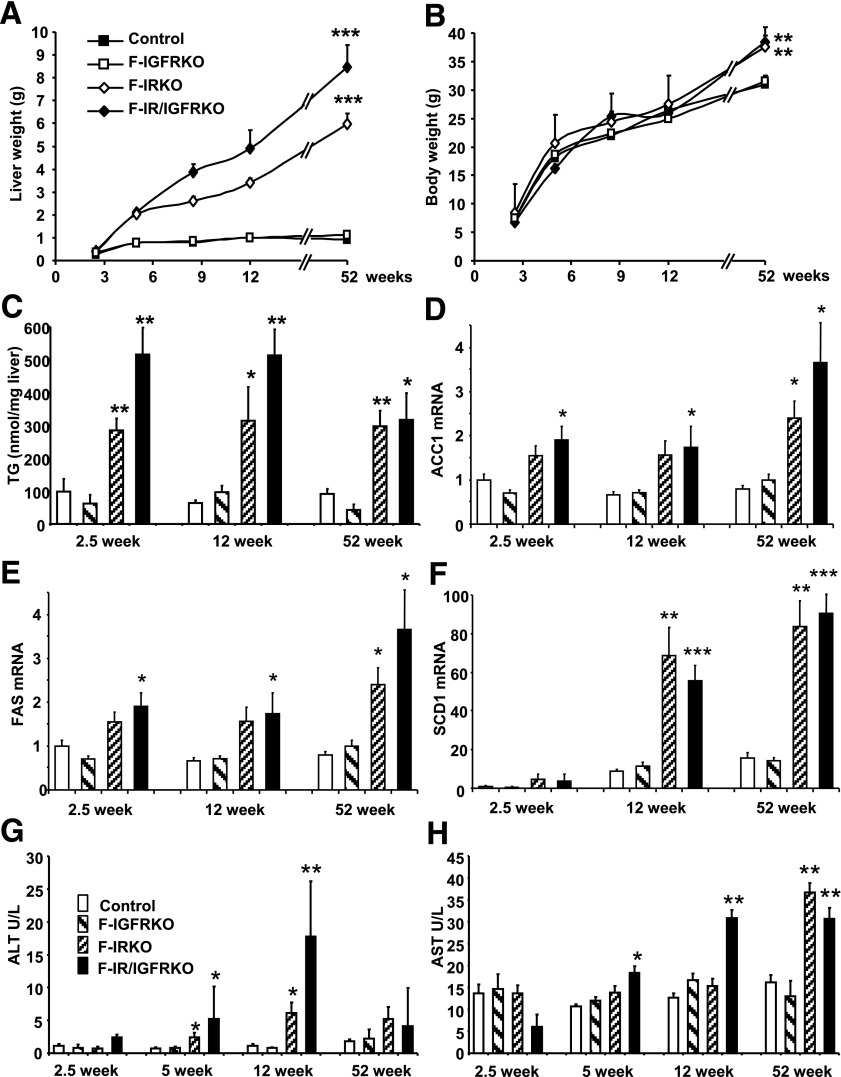
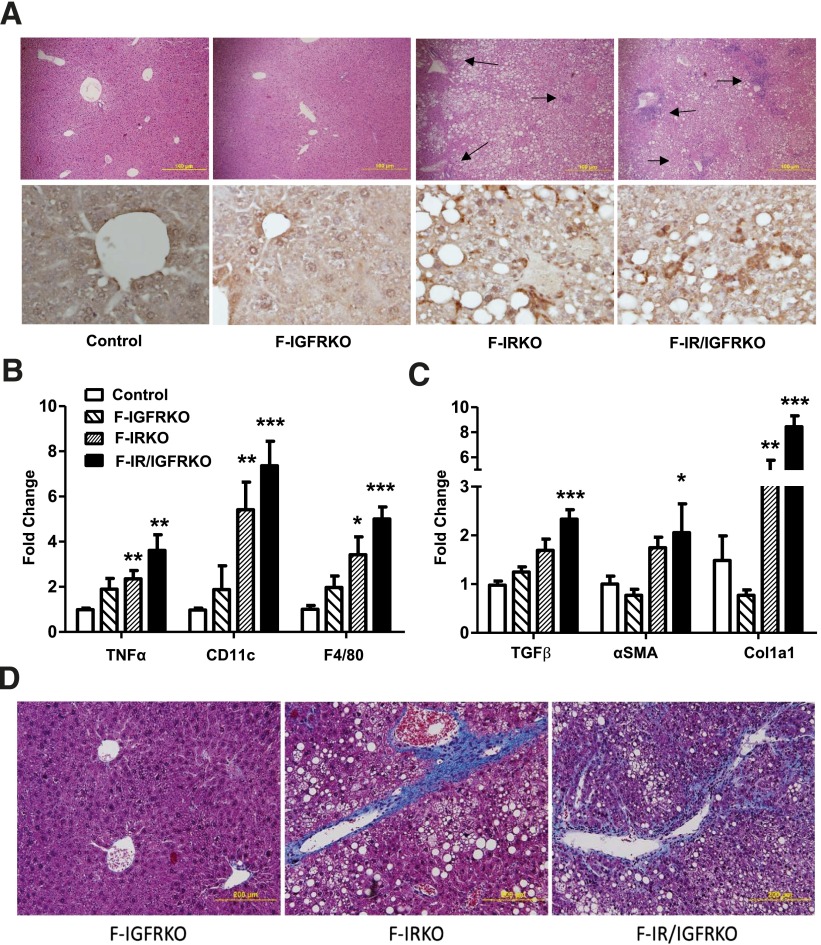
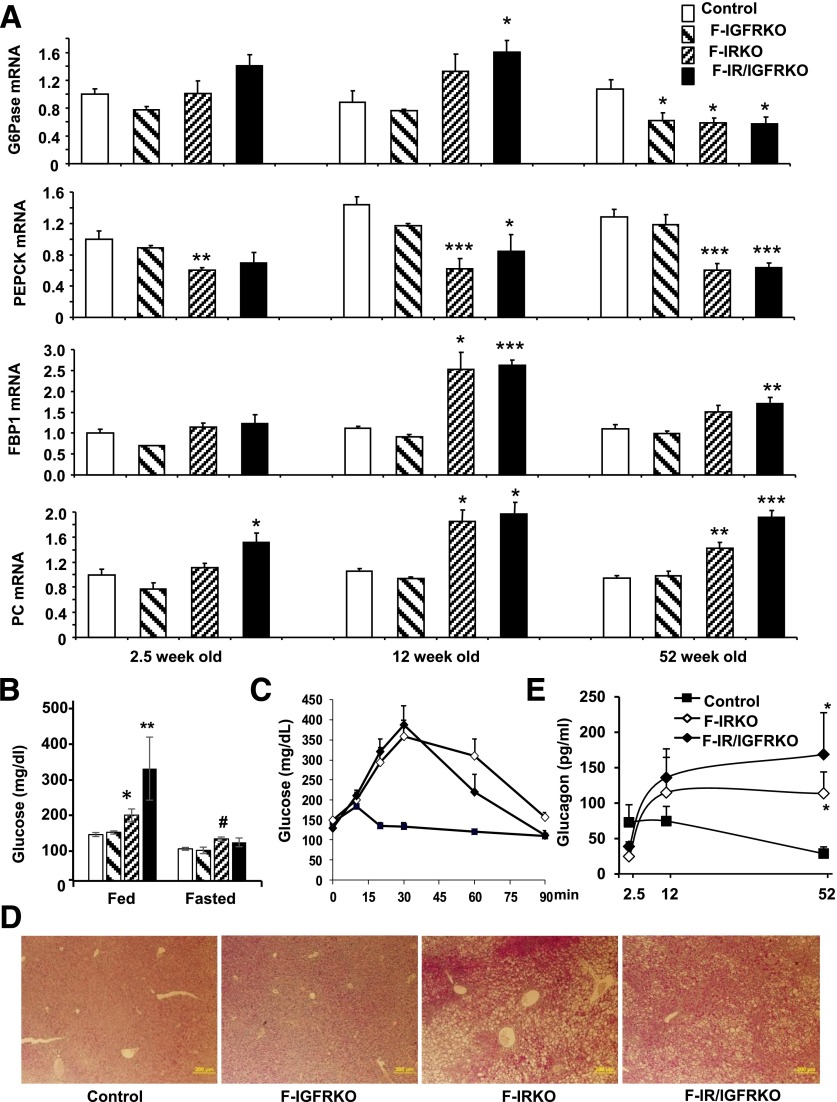
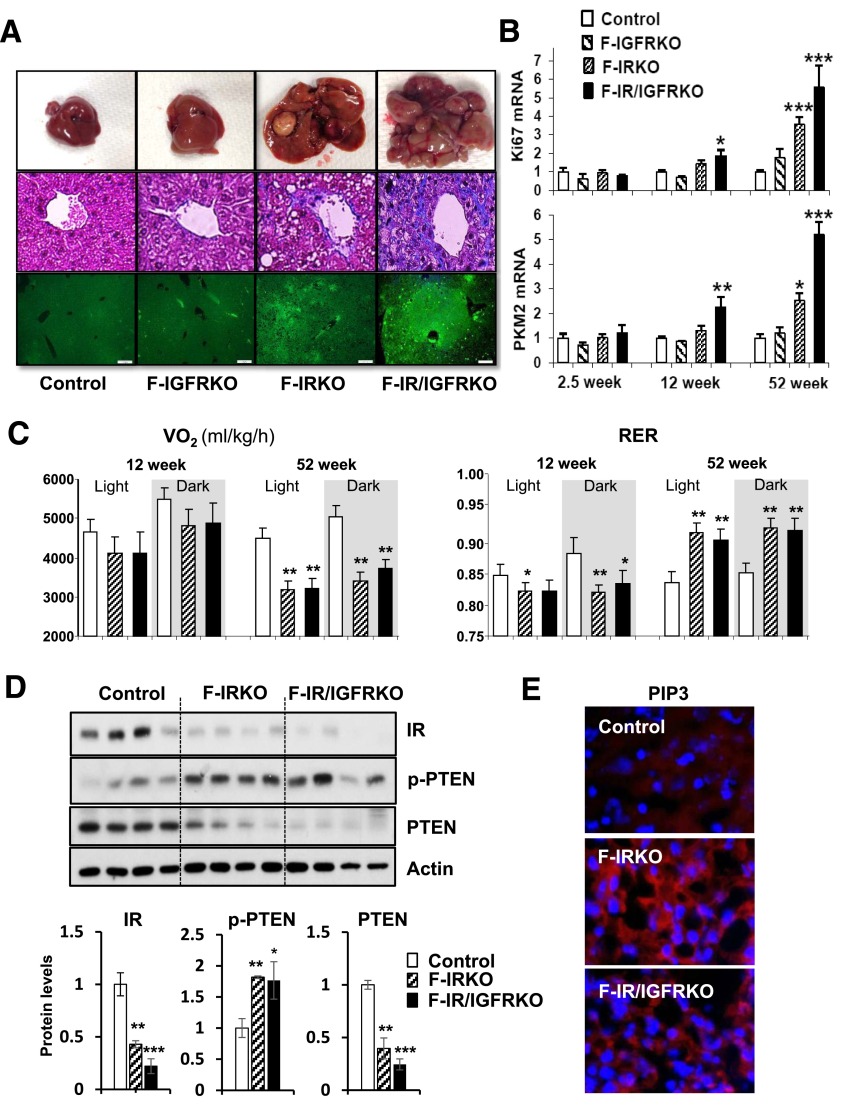
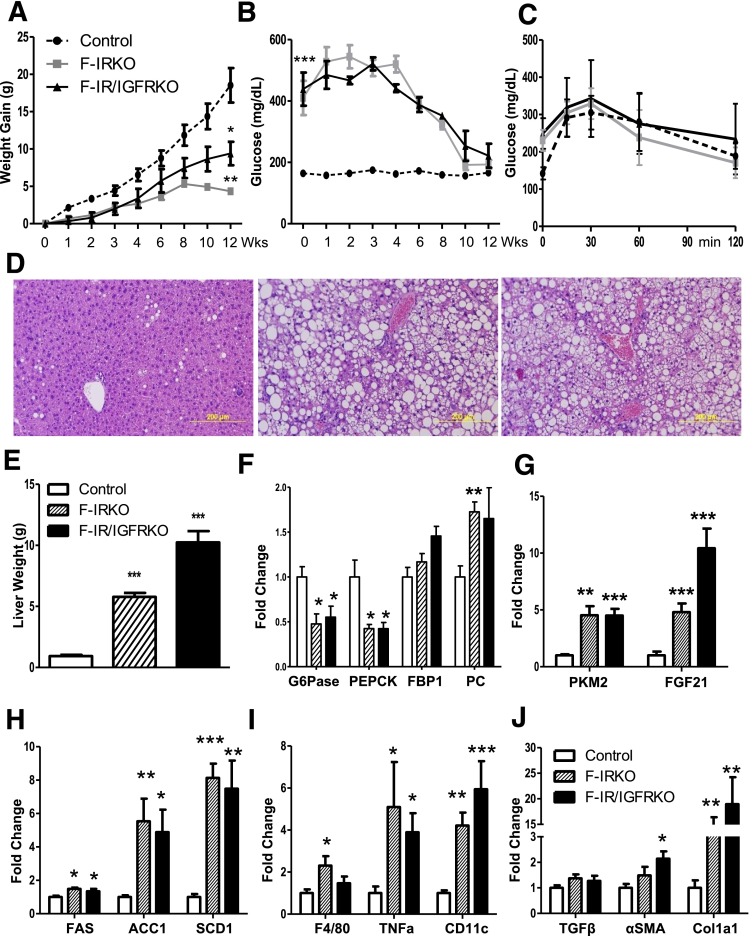
Ectopic lipid accumulation in the liver is an almost universal feature of human and rodent models of generalized lipodystrophy and is also a common feature of type 2 diabetes, obesity, and metabolic syndrome. Here we explore the progression of fatty liver disease using a mouse model of lipodystrophy created by a fat-specific knockout of the insulin receptor (F-IRKO) or both IR and insulin-like growth factor 1 receptor (F-IR/IGFRKO). These mice develop severe lipodystrophy, diabetes, hyperlipidemia, and fatty liver disease within the first weeks of life. By 12 weeks of age, liver demonstrated increased reactive oxygen species, lipid peroxidation, histological evidence of balloon degeneration, and elevated serum alanine aminotransferase and aspartate aminotransferase levels. In these lipodystrophic mice, stored liver lipids can be used for energy production, as indicated by a marked decrease in liver weight with fasting and increased liver fibroblast growth factor 21 expression and intact ketogenesis. By 52 weeks of age, liver accounted for 25% of body weight and showed continued balloon degeneration in addition to inflammation, fibrosis, and highly dysplastic liver nodules. Progression of liver disease was associated with improvement in blood glucose levels, with evidence of altered expression of gluconeogenic and glycolytic enzymes. However, these mice were able to mobilize stored glycogen in response to glucagon. Feeding F-IRKO and F-IR/IGFRKO mice a high-fat diet for 12 weeks accelerated the liver injury and normalization of blood glucose levels. Thus, severe fatty liver disease develops early in lipodystrophic mice and progresses to advanced nonalcoholic steatohepatitis with highly dysplastic liver nodules. The liver injury is propagated by lipotoxicity and is associated with improved blood glucose levels.


Figures

Figure 1
Figure 1
Fatty liver disease in 12-week-old lipodystrophic mice. Blood glucose (A), liver weight (B), and liver triglycerides (TG) (C) in 12-week-old, random-fed control, F-IGFRKO, F-IRKO, and F-IR/IGFRKO mice. Results are mean ± SEM of 12 to 30 animals per group. D: Liver sections from the same mice stained with H&E. mRNA expression of genes involved in de novo lipogenesis (E), inflammation (F), and fibrosis (G) in the livers of 12-week-old control, F-IGFRKO, and F-IRKO mice. H: Liver sections from control and F-IR/IGFRKO mice stained with DHE and 4-HNE. I: Expression of gluconeogenic/glycolytic enzymes in the livers of chow-fed control, F-IGFRKO, F-IRKO, and F-IR/IGFRKO mice at 12 weeks of age. Results are mean ± SEM of five to seven animals per group. *P < 0.05, **P < 0.01, and ***P < 0.001 compared with controls.
Figure 2
Figure 2
Lipodystrophic mice can mobilize stored liver fat. Blood glucose (A), liver weight (B), serum triglycerides (C), FFAs (D), insulin (E), and β-hydroxybutyrate (F) in 12-week-old random-fed or overnight-fasted control and F-IRKO mice. Results are mean ± SEM of 9 to 10 animals per group. G: FGF21 mRNA levels in the livers from 2.5-, 12-, and 52-week-old control, F-IGFRKO, F-IRKO, and F-IR/IGFRKO mice. Results are mean ± SEM of five to eight mice per group. *P < 0.05, **P < 0.01, and ***P < 0.001 compared with controls; ##P < 0.01 and ###P < 0.001 compared with fed F-IRKO mice; and §P < 0.05 and §§§P < 0.001 between adjacent groups.
Figure 3
Figure 3
F-IRKO and F-IR/IGFRKO mice develop progressive NAFLD with age. Liver weight (A) and body weight (B) of control, F-IGFRKO, F-IRKO, and F-IR/IGFRKO mice at 2.5, 5, 8, 12, and 52 weeks of age. Results are mean ± SEM of 12 to 30 animals per group. C: Triglyceride (TG) content was measured in the livers from mice at 2.5, 12, and 52 weeks of age. Acc1 (D), Fas (E), and Scd1 (F) mRNA expression in control, F-IGFRKO, F-IRKO, and F-IR/IGFRKO mice at 2.5, 12, and 52 weeks of age graphed as a fold-change over controls. Results are mean ± SEM of five to eight animals per group. Serum ALT (G) and AST (H) levels measured in 2.5-, 5-, 12-, and 52-week-old chow-fed control, F-IGFRKO, F-IRKO, and F-IR/IGFRKO mice. *P < 0.05, **P < 0.01, and ***P < 0.001 compared with controls.
Figure 4
Figure 4
Liver inflammation is apparent at 52 weeks of life. A: Liver sections from 52-week-old control, F-IGFRKO, F-IRKO, and F-IR/IGFRKO mice stained with H&E (original magnification ×100) (top panel). Arrows show pockets of inflammation. IHC for macrophage marker F4/80 is shown in the same mice (original magnification ×400) (bottom panel). One representative section from three mice per group is shown. Expression of genes involved in inflammation (B) and fibrosis (C) in chow-fed control, F-IGFRKO, F-IRKO, and F-IR/IGFRKO mice at 52 weeks of age. Results are mean ± SEM of four to eight animals per group. *P < 0.05, **P < 0.01, and ***P < 0.001 compared with controls. D: Liver sections from the same mice at 52 weeks of age stained with Masson’s trichrome (original magnification ×200). One representative section from four to six mice per group is shown.
Figure 5
Figure 5
Gluconeogenesis at 52 weeks of age. A: mRNA expression of G6pase, Pepck, Fbp1, and Pc in control, F-IGFRKO, F-IRKO, and F-IR/IGFRKO mice at the indicated times from 2.5 to 52 weeks of age graphed as fold-change over controls. Results are mean ± SEM of five to six animals per group. B: Random-fed and overnight-fasted blood glucose levels of chow-fed control, F-IGFRKO, F-IRKO, and F-IR/IGFRKO mice at 52 weeks of age. Blood glucose levels (C) assessed over 90 min after intraperitoneal glucagon challenge and serum glucagon levels (E) in control, F-IRKO, and F-IR/IGFRKO mice at indicated times. Results are mean ± SEM of five to six animals per group. *P < 0.05, **P < 0.01, and ***P < 0.001 compared with controls; #P < 0.05 compared with fed mice. D: PAS-stained liver sections from control, F-IGFRKO, F-IRKO, and F-IR/IGFRKO mice at 52 weeks of age. One representative section from five mice per group is shown.
Figure 6
Figure 6
Lipodystrophic mice develop liver tumors and increased glycolysis. A: Representative images of whole liver (upper panel), Masson’s trichrome stain (middle panel), and Ki67 staining (lower panel) in 1-year-old control, F-IGFRKO, F-IRKO, and F-IR/IGFRKO mice. Scale bars, 200 μm. B: Ki67 and PKM2 mRNA levels in livers from 2.5-, 12-, and 52-week-old mice. Results are mean ± SEM of five to eight animals per group. C: Vo2 and RER of control, F-IRKO, and F-IR/IGFRKO mice measured in metabolic cages at 12 and 52 weeks of age. Results are mean ± SEM of 5 to 11 mice per group. D: Western blot analysis and densitometric quantification of insulin-signaling molecules from the livers of control, F-IRKO, and F-IR/IGFRKO mice at 1 year of age. Results are mean ± SEM of four animals per group. E: Representative IHC images of PIP3 in livers of control, F-IRKO, and F-IR/IGFRKO mice at 1 year of age. *P < 0.05, **P < 0.01, and ***P < 0.001 compared with controls.
Figure 7
Figure 7
HFD accelerates liver injury in lipodystrophic mice. A: Body weight of control, F-IRKO, and F-IR/IGFRKO mice assessed during 12 weeks of HFD feeding. B: Blood glucose levels in the same mice assessed at the indicated times. C: Glucose tolerance test of control, F-IRKO, and F-IR/IGFRKO mice after 12 weeks of the HFD. Results are mean ± SEM of 6 to 11 animals per group. D: H&E-stained liver sections from the same mice. One representative section from six mice per group is shown. E: Liver weight of control, F-IRKO, and F-IR/IGFRKO mice after 12 weeks of the HFD. mRNA expression of gluconeogenic enzymes (F) and the expression of Pkm2 and Fgf21 mRNA (G) after 12 weeks of the HFD. mRNA levels of genes involved in de novo lipogenesis (H), inflammation (I) and fibrosis (J) after 12 weeks of the HFD. Results are mean ± SEM of four to six animals per group. *P < 0.05, **P < 0.01, and ***P < 0.001 compared with controls.

References

    1. He W, Barak Y, Hevener A, et al. Adipose-specific peroxisome proliferator-activated receptor gamma knockout causes insulin resistance in fat and liver but not in muscle. Proc Natl Acad Sci U S A 2003;100:15712–15717 - PMC - PubMed
    1. Moitra J, Mason MM, Olive M, et al. Life without white fat: a transgenic mouse. Genes Dev 1998;12:3168–3181 - PMC - PubMed
    1. Pajvani UB, Trujillo ME, Combs TP, et al. Fat apoptosis through targeted activation of caspase 8: a new mouse model of inducible and reversible lipoatrophy. Nat Med 2005;11:797–803 - PubMed
    1. Shimomura I, Hammer RE, Richardson JA, et al. Insulin resistance and diabetes mellitus in transgenic mice expressing nuclear SREBP-1c in adipose tissue: model for congenital generalized lipodystrophy. Genes Dev 1998;12:3182–3194 - PMC - PubMed
    1. Chalasani N, Younossi Z, Lavine JE, et al.; American Gastroenterological Association; American Association for the Study of Liver Diseases; American College of Gastroenterologyh . The diagnosis and management of non-alcoholic fatty liver disease: practice guideline by the American Gastroenterological Association, American Association for the Study of Liver Diseases, and American College of Gastroenterology. Gastroenterology 2012;142:1592–1609 - PubMed

Publication types

MeSH terms