

Genetic Evidence for a Link Between Favorable Adiposity and Lower Risk of Type 2 Diabetes, Hypertension, and Heart Disease
- PMID: 27207519
- PMCID: PMC5386140
- DOI: 10.2337/db15-1671
Genetic Evidence for a Link Between Favorable Adiposity and Lower Risk of Type 2 Diabetes, Hypertension, and Heart Disease
Abstract
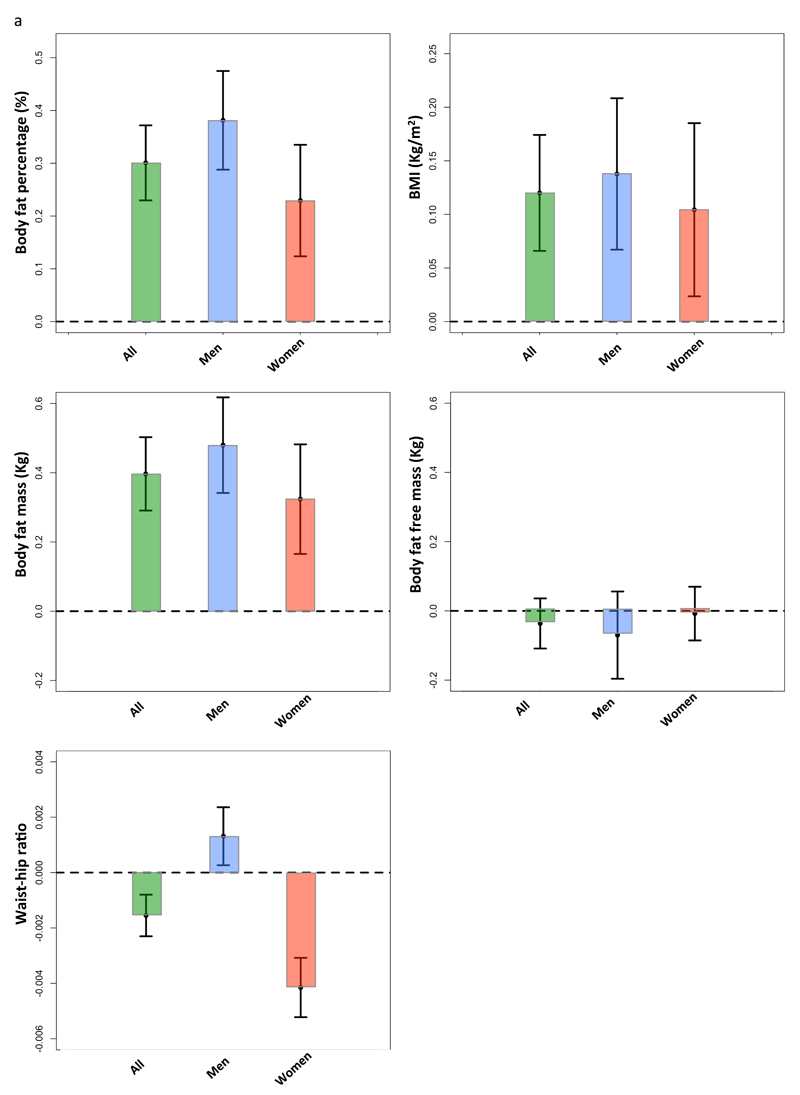
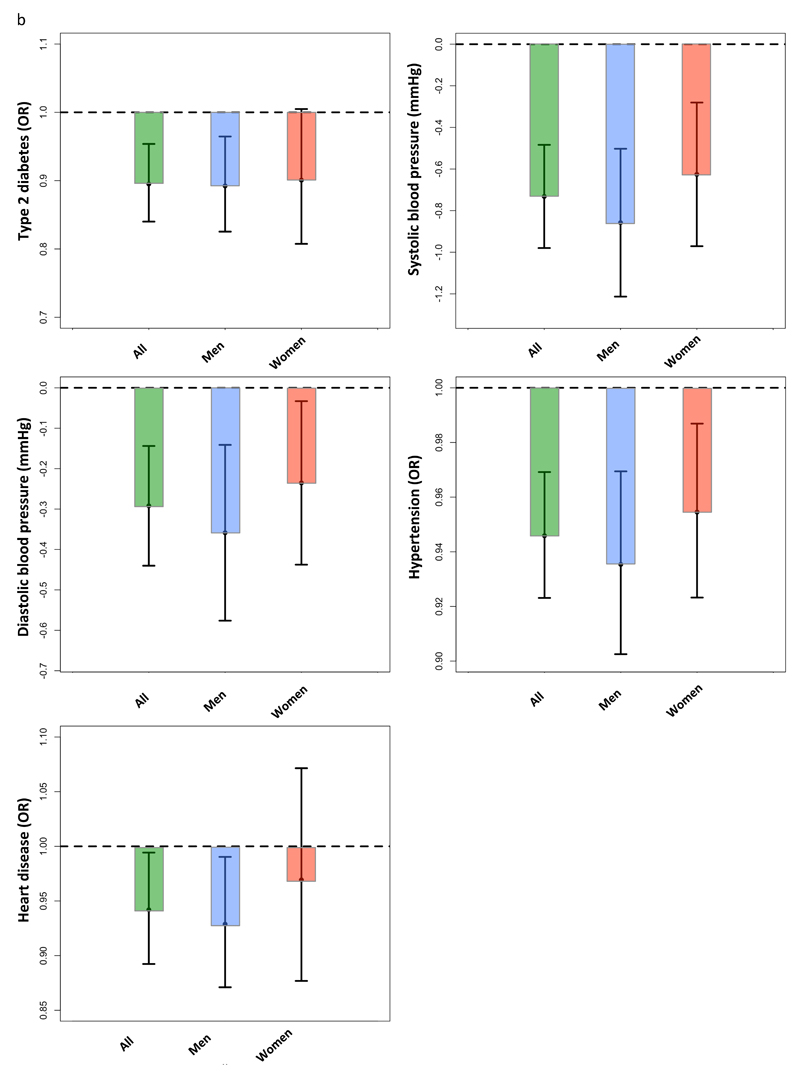
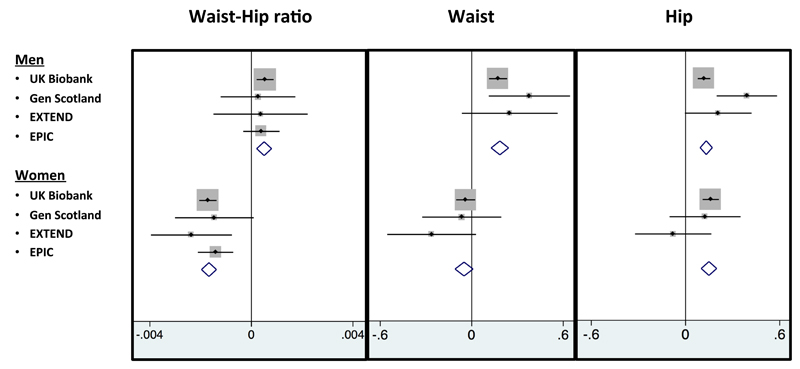
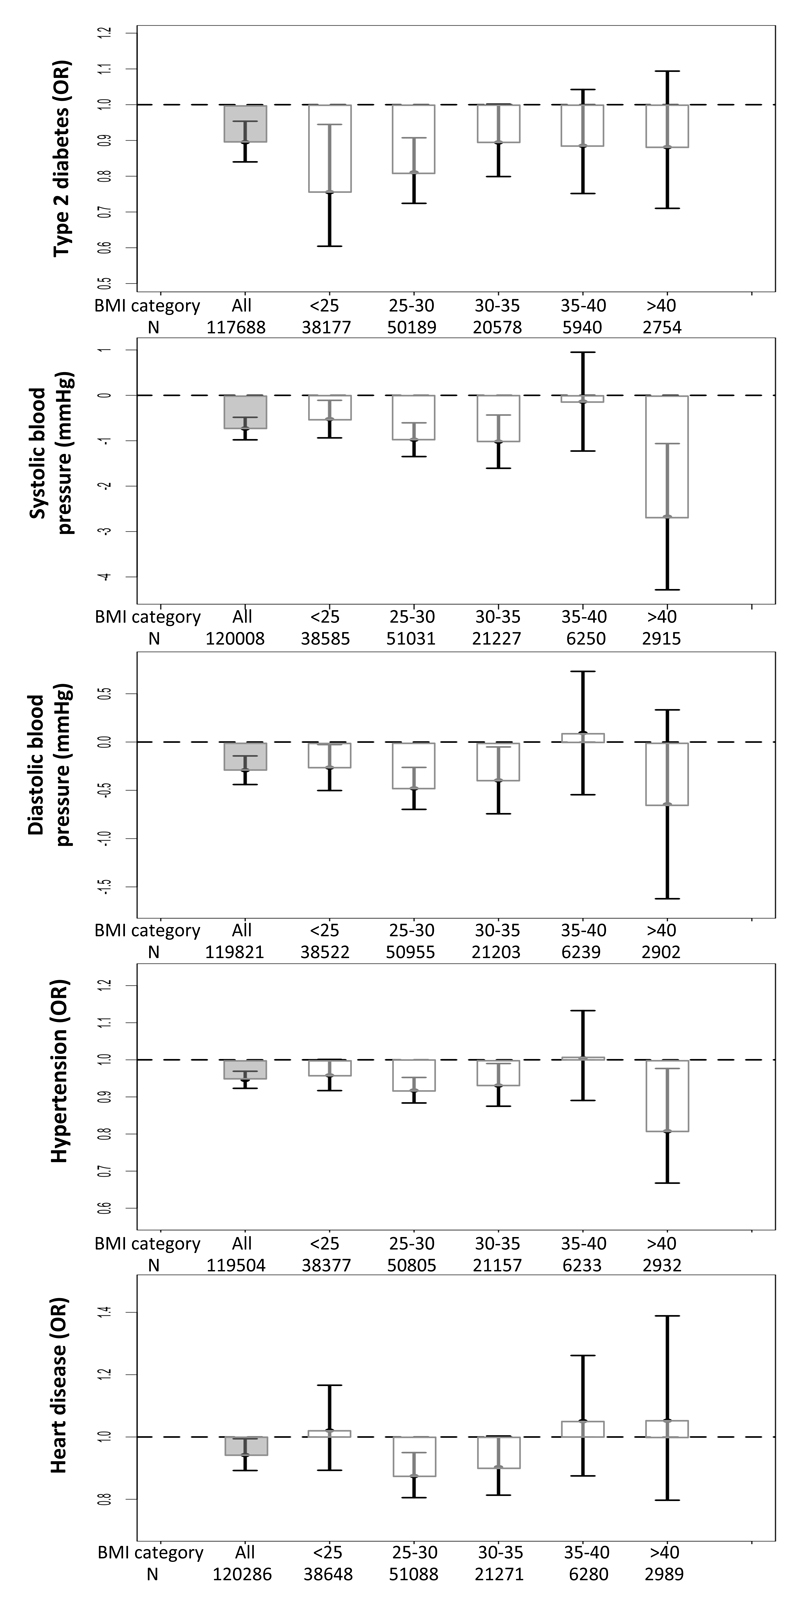
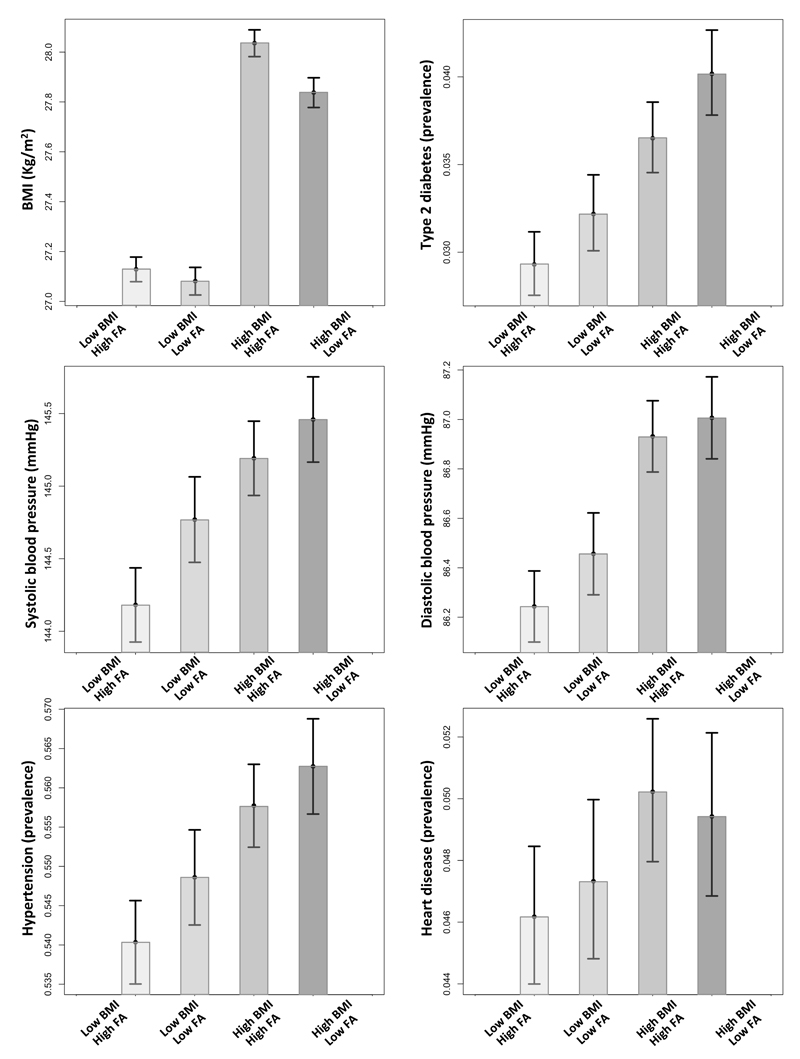
Recent genetic studies have identified some alleles that are associated with higher BMI but lower risk of type 2 diabetes, hypertension, and heart disease. These "favorable adiposity" alleles are collectively associated with lower insulin levels and higher subcutaneous-to-visceral adipose tissue ratio and may protect from disease through higher adipose storage capacity. We aimed to use data from 164,609 individuals from the UK Biobank and five other studies to replicate associations between a genetic score of 11 favorable adiposity variants and adiposity and risk of disease, to test for interactions between BMI and favorable adiposity genetics, and to test effects separately in men and women. In the UK Biobank, the 50% of individuals carrying the most favorable adiposity alleles had higher BMIs (0.120 kg/m(2) [95% CI 0.066, 0.174]; P = 1E-5) and higher body fat percentage (0.301% [0.230, 0.372]; P = 1E-16) compared with the 50% of individuals carrying the fewest alleles. For a given BMI, the 50% of individuals carrying the most favorable adiposity alleles were at lower risk of type 2 diabetes (odds ratio [OR] 0.837 [0.784, 0.894]; P = 1E-7), hypertension (OR 0.935 [0.911, 0.958]; P = 1E-7), and heart disease (OR 0.921 [0.872, 0.973]; P = 0.003) and had lower blood pressure (systolic -0.859 mmHg [-1.099, -0.618]; P = 3E-12 and diastolic -0.394 mmHg [-0.534, -0.254]; P = 4E-8). In women, these associations could be explained by the observation that the alleles associated with higher BMI but lower risk of disease were also associated with a favorable body fat distribution, with a lower waist-to-hip ratio (-0.004 cm [95% CI -0.005, -0.003] 50% vs. 50%; P = 3E-14), but in men, the favorable adiposity alleles were associated with higher waist circumference (0.454 cm [0.267, 0.641] 50% vs. 50%; P = 2E-6) and higher waist-to-hip ratio (0.0013 [0.0003, 0.0024] 50% vs. 50%; P = 0.01). Results were strengthened when a meta-analysis with five additional studies was conducted. There was no evidence of interaction between a genetic score consisting of known BMI variants and the favorable adiposity genetic score. In conclusion, different molecular mechanisms that lead to higher body fat percentage (with greater subcutaneous storage capacity) can have different impacts on cardiometabolic disease risk. Although higher BMI is associated with higher risk of diseases, better fat storage capacity could reduce the risk.
© 2016 by the American Diabetes Association. Readers may use this article as long as the work is properly cited, the use is educational and not for profit, and the work is not altered.
Conflict of interest statement
Figures
Comment in
-
Adipose tissue: Fat, yet fit.Nat Rev Endocrinol. 2016 Jul;12(7):375-6. doi: 10.1038/nrendo.2016.77. Epub 2016 May 27. Nat Rev Endocrinol. 2016. PMID: 27230950 No abstract available.
References
-
- Ruderman N, Chisholm D, Pi-Sunyer X, Schneider S. The metabolically obese, normal-weight individual revisited. Diabetes. 1998;47:699–713. - PubMed
-
- Ruderman NB, Schneider SH, Berchtold P. The "metabolically-obese," normal-weight individual. The American journal of clinical nutrition. 1981;34:1617–1621. - PubMed
-
- Virtue S, Vidal-Puig A. Adipose tissue expandability, lipotoxicity and the Metabolic Syndrome--an allostatic perspective. Biochimica et biophysica acta. 2010;1801:338–349. - PubMed
Publication types
MeSH terms
Grants and funding
LinkOut - more resources
Full Text Sources
Other Literature Sources
Medical
