. 2016 Aug;65(8):2201-13.
doi: 10.2337/db16-0212. Epub 2016 May 13.

Differential Roles of Insulin and IGF-1 Receptors in Adipose Tissue Development and Function

Affiliations

Differential Roles of Insulin and IGF-1 Receptors in Adipose Tissue Development and Function

Jeremie Boucher et al. Diabetes. 2016 Aug.

Abstract

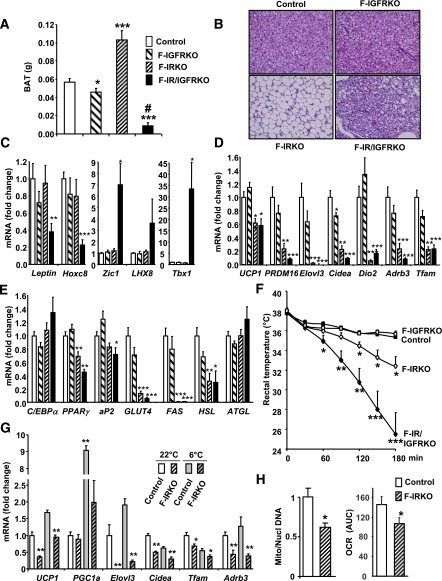
To determine the roles of insulin and insulin-like growth factor 1 (IGF-1) action in adipose tissue, we created mice lacking the insulin receptor (IR), IGF-1 receptor (IGF1R), or both using Cre-recombinase driven by the adiponectin promoter. Mice lacking IGF1R only (F-IGFRKO) had a ∼25% reduction in white adipose tissue (WAT) and brown adipose tissue (BAT), whereas mice lacking both IR and IGF1R (F-IR/IGFRKO) showed an almost complete absence of WAT and BAT. Interestingly, mice lacking only the IR (F-IRKO) had a 95% reduction in WAT, but a paradoxical 50% increase in BAT with accumulation of large unilocular lipid droplets. Both F-IRKO and F-IR/IGFRKO mice were unable to maintain body temperature in the cold and developed severe diabetes, ectopic lipid accumulation in liver and muscle, and pancreatic islet hyperplasia. Leptin treatment normalized blood glucose levels in both groups. Glucose levels also improved spontaneously by 1 year of age, despite sustained lipodystrophy and insulin resistance. Thus, loss of IR is sufficient to disrupt white fat formation, but not brown fat formation and/or maintenance, although it is required for normal BAT function and temperature homeostasis. IGF1R has only a modest contribution to both WAT and BAT formation and function.


Figures

Figure 1
Figure 1
Lipodystrophy in mice lacking IR and IR/IGF1R in fat. A: Subcutaneous (inguinal) and visceral (epididymal) WAT weights in 3-month-old control, F-IGFRKO, F-IRKO, and F-IR/IGFRKO mice. Results are mean ± SEM of 12–30 animals per group. B: H&E-stained sections of subcutaneous and visceral adipose tissues from the same mice in A. C: Circulating leptin, adiponectin, and resistin levels in 3-month-old random-fed mice. Results are mean ± SEM of 7–17 animals per group. D: mRNA levels in visceral WAT from 3-month-old control, F-IGFRKO, and F-IRKO mice. Results are mean ± SEM of 6–10 animals per group. *Significant difference compared with controls (*P < 0.05, **P < 0.01, ***P < 0.001); #significant difference between F-IRKO and F-IR/IGFRKO mice, P < 0.05.
Figure 2
Figure 2
Importance of IR and IGF1R in BAT development and function. A: BAT weight in 3-month-old control, F-IGFRKO, F-IRKO, and F-IR/IGFRKO mice. Results are mean ± SEM of 12–30 animals per group. B: H&E-stained sections of BAT from the same mice in A. CE: BAT mRNA levels from 3-month-old mice. Results are mean ± SEM of 6–10 animals per group. F: Rectal temperature measured in 3-month-old mice every 30 min for 3 h during exposure to a 6°C environment. Results are mean ± SEM of 10–15 mice per group. G: mRNA levels in BAT from 3-month-old mice at room temperature or exposed to a 6°C environment for 3 h prior to sacrifice. Results are mean ± SEM of five to six mice per group. H: Mitochondrial/nuclear DNA ratio (n = 9–11) and basal oxygen consumption rate (OCR; n = 4–6) in BAT from 3-month-old control and F-IRKO mice. Results are mean ± SEM. *Significant difference compared with controls (*P < 0.05, **P < 0.01, ***P < 0.001); #significant difference between F-IRKO and F-IR/IGFRKO mice, P < 0.05. AUC, area under the curve.
Figure 3
Figure 3
F-IRKO and F-IR/IGFRKO mice display lipoatrophic diabetes, which is reversible with leptin treatment. Blood glucose (A) and serum insulin levels (B) in random-fed 3-month-old control, F-IGFRKO, F-IRKO, and F-IR/IGFRKO mice. Results are mean ± SEM of 7–17 animals per group. C: Insulin tolerance test was performed in 3-month-old mice as described in research design and methods. Results are mean ± SEM of 12 animals per group. D: Serum TG, FFA, and cholesterol levels in random-fed mice at 3 months of age. Results are mean ± SEM of 7–17 animals per group. Blood glucose change (E) and body weight change (F) in random-fed 3-month-old F-IRKO and F-IR/IGFRKO mice during 2 weeks of leptin (10 μg/mouse/day) or saline treatment using Alzet osmotic minipumps. Saline-treated F-IRKO and F-IR/IGFRKO mice were pooled into a single control group. Results are mean ± SEM of six mice per group. Food intake (G) and water intake (H) were measured in metabolic cages in 3-month-old control, F-IRKO, and F-IR/IGFRKO mice. Results are mean ± SEM of 6–10 mice per group. *P < 0.05; **P < 0.01; ***P < 0.001.
Figure 4
Figure 4
β-Cell hyperplasia in F-IRKO and F-IR/IGFRKO mice. A: H&E-stained pancreatic sections from control, F-IGFRKO, F-IRKO, and F-IR/IGFRKO mice at 3 months of age. B: Percent islet cell area as compared with total area of the pancreas. Results are mean ± SEM of four to five animals per group. C: Immunofluorescence staining for insulin, Ki67, and DAPI in pancreatic sections of 3-month-old mice. D: Percent of Ki67-positive β-cells. Results are mean ± SEM of four to five animals per group. E: Angptl8/betatrophin and SerpinB1 mRNA levels in livers from 2.5- and 12-week-old mice. Results are mean ± SEM of five to eight animals per group. *Significant difference compared with controls (*P < 0.05, **P < 0.01).
Figure 5
Figure 5
Ectopic lipid accumulation and decreased muscle size in F-IRKO and F-IR/IGFRKO mice. A: TG content in TA muscles from 3-month-old control, F-IGFRKO, F-IRKO, and F-IR/IGFRKO mice. B: Nile Red staining shows lipid accumulation colocalized with oxidative SDH-positive–stained (purple) myofibers in TA from F-IRKO and F-IR/IGFRKO (scale bar, 100 μm). C: Percent of SDH-positive oxidative (purple) fibers per high-power field (HPF). D: Weight of TA muscle from control and knockout mice at 3 months of age. Results are mean ± SEM of 12–30 animals per group. Laminin immunofluorescence (E) and cross-sectional area distribution (F) of laminin-stained fibers in TA muscles from 3-month-old control and knockout mice (scale bar, 200 μm). Results are mean ± SEM of three animals per group. Western blot (G) and densitometric quantification of protein levels (H) of IR in quadriceps muscle of 3-month-old mice. I: mRNA levels of IR in quadriceps muscle from control and knockout mice. Results are mean ± SEM of three to six animals per group. *Significant difference compared with controls (*P < 0.05, **P < 0.01, ***P < 0.001).
Figure 6
Figure 6
Disease progression in mice with IR and/or IGF1R knockout in fat. Subcutaneous (inguinal) WAT (A), visceral (epididymal) WAT (B), and interscapular BAT mass (C) from mice at 2.5, 12, and 52 weeks of age. Results are mean ± SEM of 7–17 animals per group. D: Blood glucose was measured in random-fed control, F-IGFRKO, F-IRKO, and F-IR/IGFRKO mice at the indicated ages from 2.5 weeks old to 1 year old. Results are mean ± SEM of 8–15 animals per group. Serum TG (E) and serum FFA (F) in random-fed mice at 2.5, 12, and 52 weeks of age. Results are mean ± SEM of 7–17 animals per group. G: TG content of TA muscles from 52-week-old control and knockout mice. Results are mean ± SEM of five to eight animals per group. H: Serum insulin levels were measured in random-fed control, F-IGFRKO, F-IRKO, and F-IR/IGFRKO mice at the indicated ages from 2.5 weeks old to 1 year old. Results are mean ± SEM of 8–15 animals per group. I: H&E-stained pancreatic sections from 1-year-old control, F-IGFRKO, F-IRKO, and F-IR/IGFRKO mice. J: Angptl8/betatrophin and SerpinB1 mRNA levels in livers from 52-week-old mice. Results are mean ± SEM of five to eight animals per group. *P < 0.05; **P < 0.01; ***P < 0.001.

References

    1. Blüher S, Kratzsch J, Kiess W. Insulin-like growth factor I, growth hormone and insulin in white adipose tissue. Best Pract Res Clin Endocrinol Metab 2005;19:577–587 - PubMed
    1. Poulos SP, Hausman DB, Hausman GJ. The development and endocrine functions of adipose tissue. Mol Cell Endocrinol 2010;323:20–34 - PubMed
    1. Boucher J, Tseng YH, Kahn CR. Insulin and insulin-like growth factor-1 receptors act as ligand-specific amplitude modulators of a common pathway regulating gene transcription. J Biol Chem 2010;285:17235–17245 - PMC - PubMed
    1. Siddle K. Molecular basis of signaling specificity of insulin and IGF receptors: neglected corners and recent advances. Front Endocrinol (Lausanne) 2012;3:34. - PMC - PubMed
    1. Entingh-Pearsall A, Kahn CR. Differential roles of the insulin and insulin-like growth factor-I (IGF-I) receptors in response to insulin and IGF-I. J Biol Chem 2004;279:38016–38024 - PubMed

Publication types

MeSH terms