

Effects of hibernation on bone marrow transcriptome in thirteen-lined ground squirrels
- PMID: 27207617
- PMCID: PMC4967218
- DOI: 10.1152/physiolgenomics.00120.2015
Effects of hibernation on bone marrow transcriptome in thirteen-lined ground squirrels
Abstract
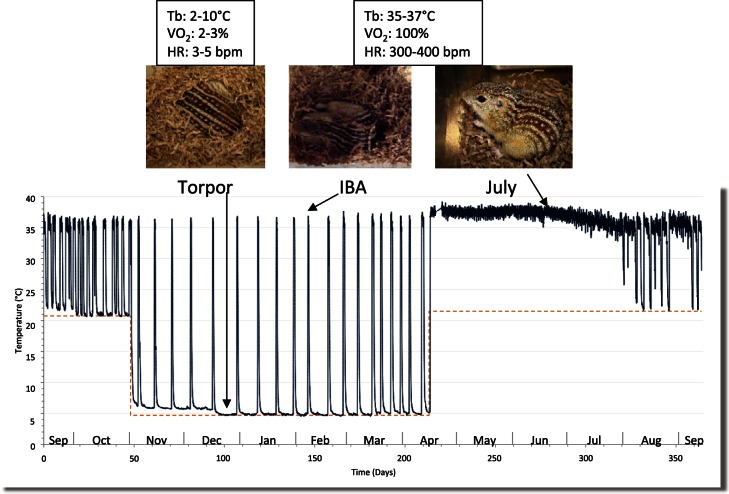
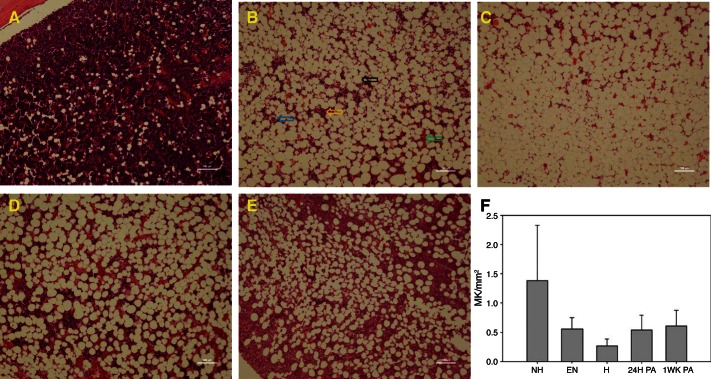
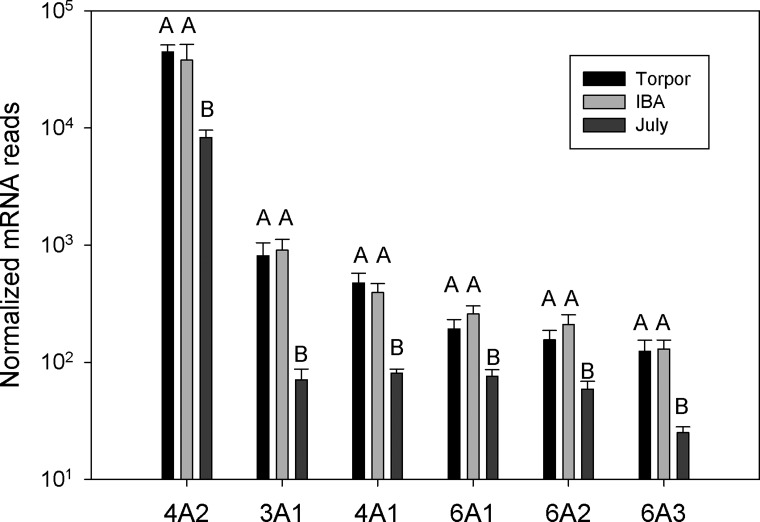
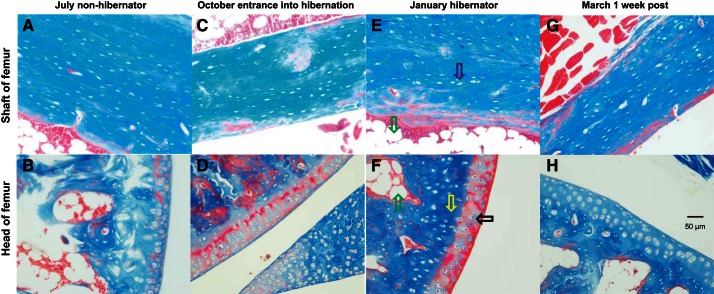
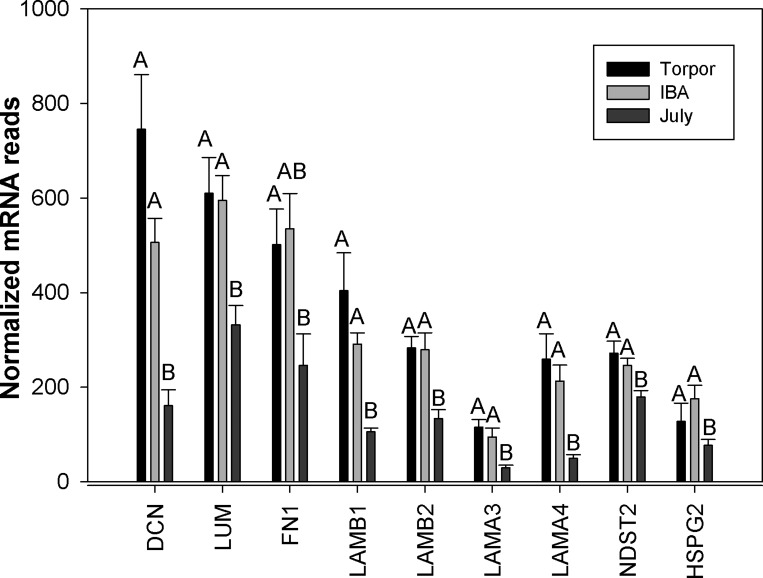
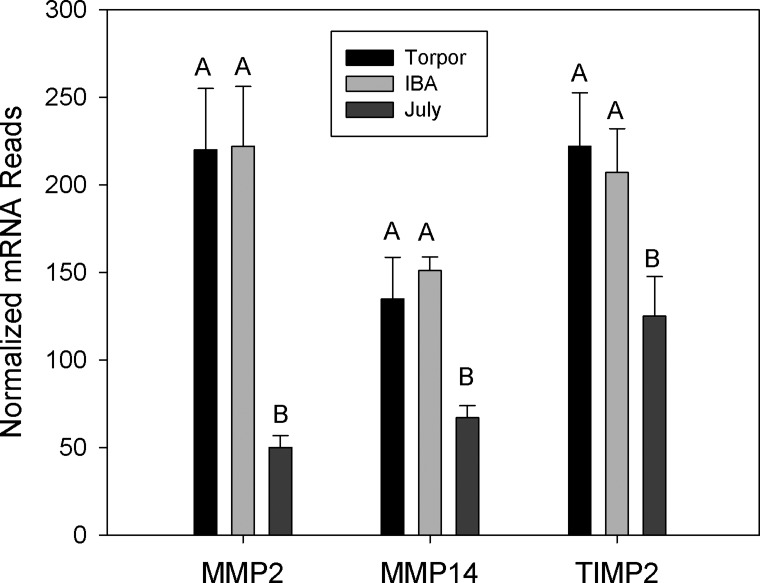
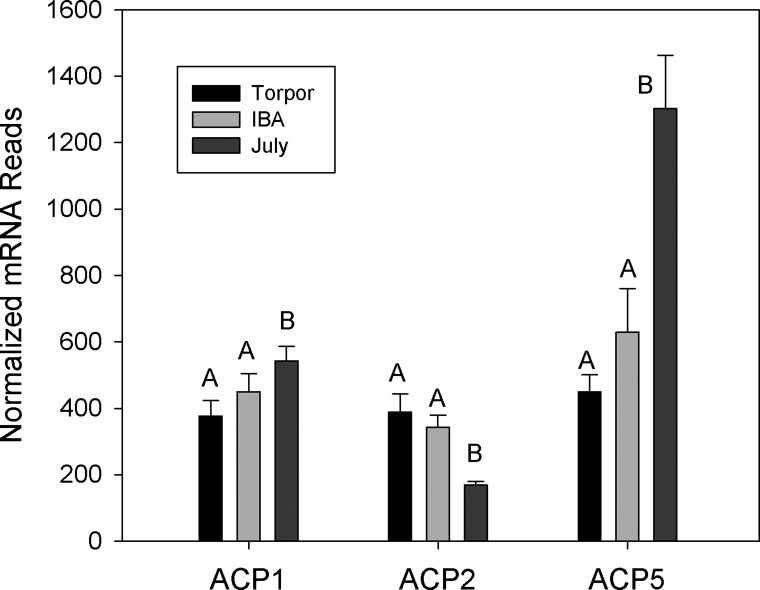
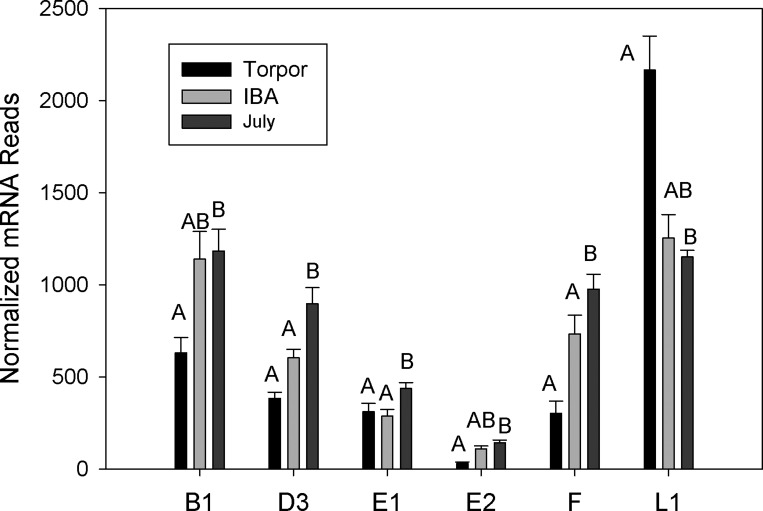
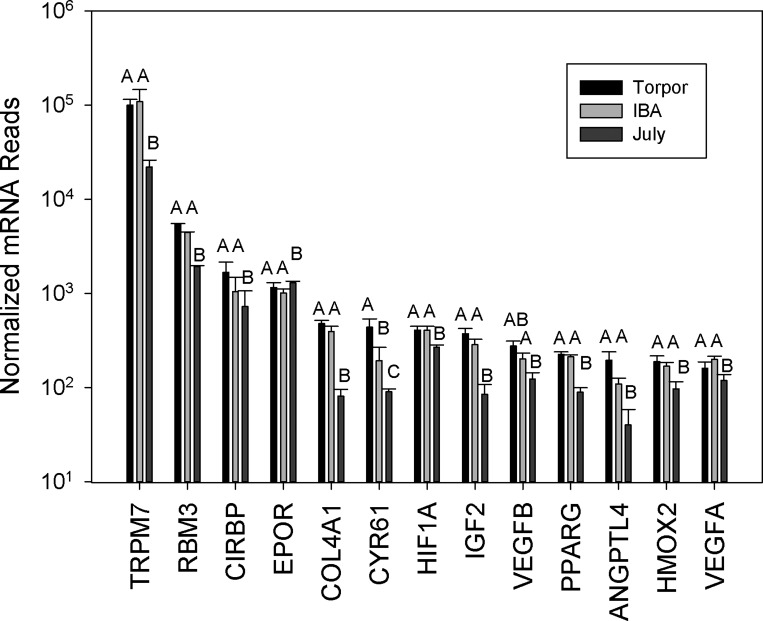
Mammalian hibernators adapt to prolonged periods of immobility, hypometabolism, hypothermia, and oxidative stress, each capable of reducing bone marrow activity. In this study bone marrow transcriptomes were compared among thirteen-lined ground squirrels collected in July, winter torpor, and winter interbout arousal (IBA). The results were consistent with a suppression of acquired immune responses, and a shift to innate immune responses during hibernation through higher complement expression. Consistent with the increase in adipocytes found in bone marrow of hibernators, expression of genes associated with white adipose tissue are higher during hibernation. Genes that should strengthen the bone by increasing extracellular matrix were higher during hibernation, especially the collagen genes. Finally, expression of heat shock proteins were lower, and cold-response genes were higher, during hibernation. No differential expression of hematopoietic genes involved in erythrocyte or megakaryocyte production was observed. This global view of the changes in the bone marrow transcriptome over both short term (torpor vs. IBA) and long term (torpor vs. July) hypothermia can explain several observations made about circulating blood cells and the structure and strength of the bone during hibernation.
Keywords: adipose; erythrocyte; leukocyte; megakaryocyte; osteoblast.
Copyright © 2016 the American Physiological Society.
Figures
Similar articles
-
Analysis of microRNA expression during the torpor-arousal cycle of a mammalian hibernator, the 13-lined ground squirrel.Physiol Genomics. 2016 Jun;48(6):388-96. doi: 10.1152/physiolgenomics.00005.2016. Epub 2016 Apr 15. Physiol Genomics. 2016. PMID: 27084747 Free PMC article.
-
Mitochondrial microRNA profiles are altered in thirteen-lined ground squirrels (Ictidomys tridecemlineatus) during hibernation.Physiol Genomics. 2024 Aug 1;56(8):555-566. doi: 10.1152/physiolgenomics.00017.2024. Epub 2024 Jun 17. Physiol Genomics. 2024. PMID: 38881427
-
Cytoskeletal regulation dominates temperature-sensitive proteomic changes of hibernation in forebrain of 13-lined ground squirrels.PLoS One. 2013 Aug 9;8(8):e71627. doi: 10.1371/journal.pone.0071627. eCollection 2013. PLoS One. 2013. PMID: 23951209 Free PMC article.
-
Molecular interactions underpinning the phenotype of hibernation in mammals.J Exp Biol. 2019 Jan 25;222(Pt 2):jeb160606. doi: 10.1242/jeb.160606. J Exp Biol. 2019. PMID: 30683731 Review.
-
Cold resistance of mammalian hibernators ∼ a matter of ferroptosis?Front Physiol. 2024 Apr 25;15:1377986. doi: 10.3389/fphys.2024.1377986. eCollection 2024. Front Physiol. 2024. PMID: 38725569 Free PMC article. Review.
Cited by
-
Hypoxia-ischemia-mediated effects on neurodevelopmentally regulated cold-shock proteins in neonatal mice under strict temperature control.Pediatr Res. 2022 Feb 19:10.1038/s41390-022-01990-4. doi: 10.1038/s41390-022-01990-4. Online ahead of print. Pediatr Res. 2022. PMID: 35184138 Free PMC article.
-
Red Blood Cell Metabolic Responses to Torpor and Arousal in the Hibernator Arctic Ground Squirrel.J Proteome Res. 2019 Apr 5;18(4):1827-1841. doi: 10.1021/acs.jproteome.9b00018. Epub 2019 Feb 28. J Proteome Res. 2019. PMID: 30793910 Free PMC article.
-
Platelet proteome dynamics in hibernating 13-lined ground squirrels.Physiol Genomics. 2021 Nov 1;53(11):473-485. doi: 10.1152/physiolgenomics.00078.2021. Epub 2021 Oct 22. Physiol Genomics. 2021. PMID: 34677084 Free PMC article.
-
Comparative tissue transcriptomics highlights dynamic differences among tissues but conserved metabolic transcript prioritization in preparation for arousal from torpor.J Comp Physiol B. 2017 Jul;187(5-6):735-748. doi: 10.1007/s00360-017-1073-x. Epub 2017 Mar 23. J Comp Physiol B. 2017. PMID: 28332019
-
Integrated Phenotypic and Transcriptomic Analyses of Osteoporosis in Type 2 Diabetic Mice.Int J Med Sci. 2025 Mar 10;22(8):1773-1790. doi: 10.7150/ijms.109537. eCollection 2025. Int J Med Sci. 2025. PMID: 40225857 Free PMC article.
References
-
- Akira S, Takeda K. Toll-like receptor signalling. Nat Rev Immunol 4: 499–511, 2004. - PubMed
-
- Andrews MT. Advances in molecular biology of hibernation in mammals. Bioessays 29: 431–40, 2007. - PubMed
-
- Barbu A, Hamad OA, Lind L, Ekdahl KN, Nilsson B. The role of complement factor C3 in lipid metabolism. Mol Immunol 67: 101–107, 2015. - PubMed
Publication types
MeSH terms
Substances
Grants and funding
LinkOut - more resources
Full Text Sources
Other Literature Sources