

BLVRB redox mutation defines heme degradation in a metabolic pathway of enhanced thrombopoiesis in humans
- PMID: 27207795
- PMCID: PMC4974201
- DOI: 10.1182/blood-2016-02-696997
BLVRB redox mutation defines heme degradation in a metabolic pathway of enhanced thrombopoiesis in humans
Abstract
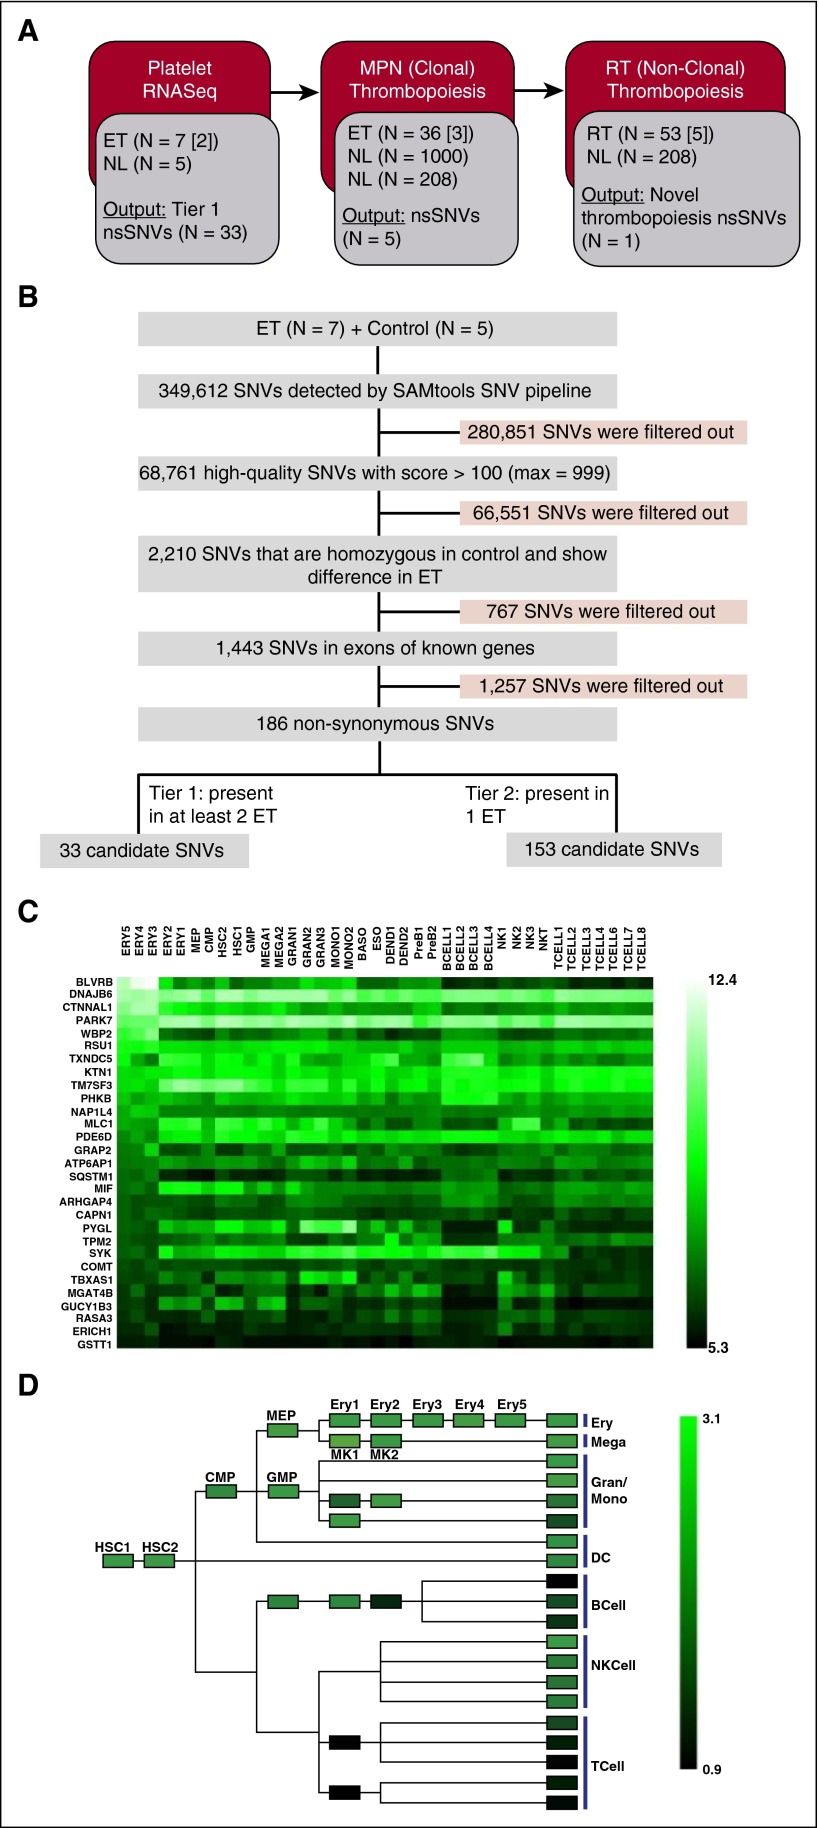
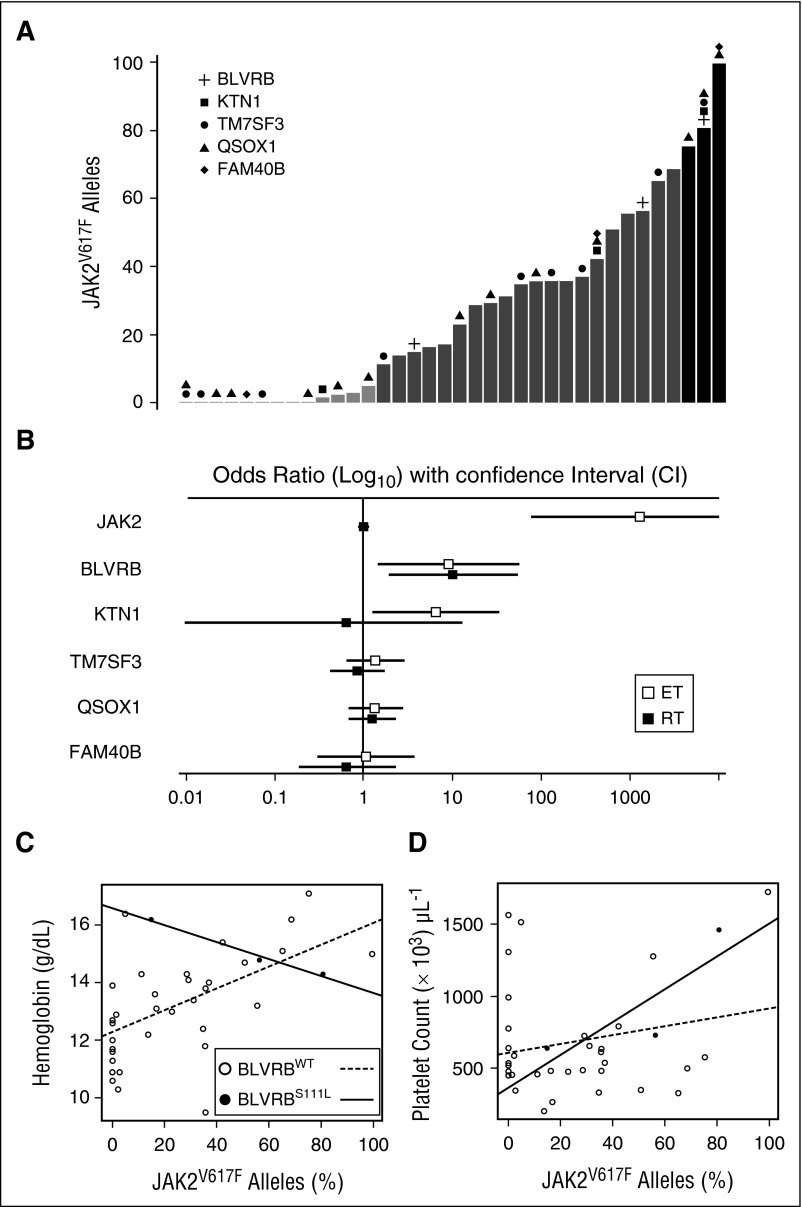
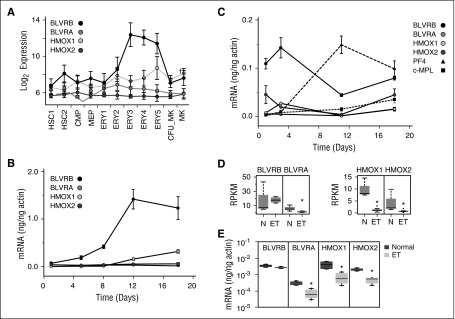
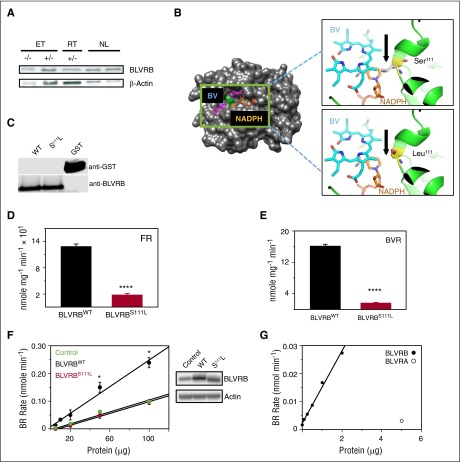
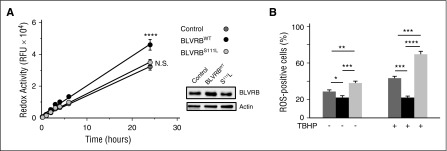
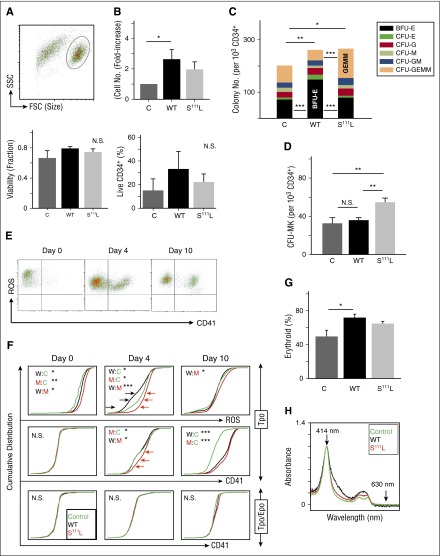
Human blood cell counts are tightly maintained within narrow physiologic ranges, largely controlled by cytokine-integrated signaling and transcriptional circuits that regulate multilineage hematopoietic specification. Known genetic loci influencing blood cell production account for <10% of platelet and red blood cell variability, and thrombopoietin/cellular myeloproliferative leukemia virus liganding is dispensable for definitive thrombopoiesis, establishing that fundamentally important modifier loci remain unelucidated. In this study, platelet transcriptome sequencing and extended thrombocytosis cohort analyses identified a single loss-of-function mutation (BLVRB(S111L)) causally associated with clonal and nonclonal disorders of enhanced platelet production. BLVRB(S111L) encompassed within the substrate/cofactor [α/β dinucleotide NAD(P)H] binding fold is a functionally defective redox coupler using flavin and biliverdin (BV) IXβ tetrapyrrole(s) and results in exaggerated reactive oxygen species accumulation as a putative metabolic signal leading to differential hematopoietic lineage commitment and enhanced thrombopoiesis. These data define the first physiologically relevant function of BLVRB and implicate its activity and/or heme-regulated BV tetrapyrrole(s) in a unique redox-regulated bioenergetic pathway governing terminal megakaryocytopoiesis; these observations also define a mechanistically restricted drug target retaining potential for enhancing human platelet counts.
© 2016 by The American Society of Hematology.
Figures
Comment in
-
ROS: novel regulators of thrombopoiesis.Blood. 2016 Aug 4;128(5):613-4. doi: 10.1182/blood-2016-06-718544. Blood. 2016. PMID: 27492312 No abstract available.
Similar articles
-
Metabolic Functions of Biliverdin IXβ Reductase in Redox-Regulated Hematopoietic Cell Fate.Antioxidants (Basel). 2023 May 7;12(5):1058. doi: 10.3390/antiox12051058. Antioxidants (Basel). 2023. PMID: 37237924 Free PMC article. Review.
-
Divergent erythroid megakaryocyte fates in Blvrb-deficient mice establish non-overlapping cytoprotective functions during stress hematopoiesis.Free Radic Biol Med. 2021 Feb 20;164:164-174. doi: 10.1016/j.freeradbiomed.2020.12.015. Epub 2020 Dec 24. Free Radic Biol Med. 2021. PMID: 33359909 Free PMC article.
-
Heme degradation enzyme biliverdin IXβ reductase is required for stem cell glutamine metabolism.Biochem J. 2018 Mar 29;475(6):1211-1223. doi: 10.1042/BCJ20180016. Biochem J. 2018. PMID: 29500232 Free PMC article.
-
In silico and crystallographic studies identify key structural features of biliverdin IXβ reductase inhibitors having nanomolar potency.J Biol Chem. 2018 Apr 13;293(15):5431-5446. doi: 10.1074/jbc.RA118.001803. Epub 2018 Feb 27. J Biol Chem. 2018. PMID: 29487133 Free PMC article.
-
Protein kinase C ε in hematopoiesis: conductor or selector?Semin Thromb Hemost. 2013 Feb;39(1):59-65. doi: 10.1055/s-0032-1331156. Epub 2012 Dec 24. Semin Thromb Hemost. 2013. PMID: 23266964 Review.
Cited by
-
Altered lncRNAs Transcriptomic Profiles in Atherosclerosis-Induced Ischemic Stroke.Cell Mol Neurobiol. 2022 Jan;42(1):265-278. doi: 10.1007/s10571-020-00918-y. Epub 2020 Jul 11. Cell Mol Neurobiol. 2022. PMID: 32653974 Free PMC article.
-
An Innovative Inhibitor with a New Chemical Moiety Aimed at Biliverdin IXβ Reductase for Thrombocytopenia and Resilient against Cellular Degradation.Pharmaceutics. 2024 Aug 30;16(9):1148. doi: 10.3390/pharmaceutics16091148. Pharmaceutics. 2024. PMID: 39339186 Free PMC article.
-
Metabolic Functions of Biliverdin IXβ Reductase in Redox-Regulated Hematopoietic Cell Fate.Antioxidants (Basel). 2023 May 7;12(5):1058. doi: 10.3390/antiox12051058. Antioxidants (Basel). 2023. PMID: 37237924 Free PMC article. Review.
-
Metabolomic and proteomic profiling of a burn-hemorrhagic shock swine model reveals a metabolomic signature associated with fatal outcomes.Eur J Med Res. 2025 Jan 7;30(1):10. doi: 10.1186/s40001-024-02245-0. Eur J Med Res. 2025. PMID: 39773520 Free PMC article.
-
Small molecule BLVRB redox inhibitor promotes megakaryocytopoiesis and stress thrombopoiesis in vivo.Nat Commun. 2025 Apr 11;16(1):3480. doi: 10.1038/s41467-025-58497-9. Nat Commun. 2025. PMID: 40216753 Free PMC article.
References
-
- Bahou WF. Disorders of platelets. In: Kumar D, editor. Genomics and Clinical Medicine . Oxford, UK: Oxford University Press; 2006. pp. 221–248.
-
- Bahou WF. Platelet systems biology using integrated genetic and proteomic platforms. Thromb Res. 2012;129(Suppl 1):S38–S45. - PubMed
-
- Debili N, Coulombel L, Croisille L, et al. Characterization of a bipotent erythro-megakaryocytic progenitor in human bone marrow. Blood. 1996;88(4):1284–1296. - PubMed
-
- Gurney AL, Carver-Moore K, de Sauvage FJ, Moore MW. Thrombocytopenia in c-mpl-deficient mice. Science. 1994;265(5177):1445–1447. - PubMed
Publication types
MeSH terms
Substances
Associated data
- Actions
- Actions
Grants and funding
LinkOut - more resources
Full Text Sources
Other Literature Sources
Molecular Biology Databases
Miscellaneous
