

Prediction of developmental chemical toxicity based on gene networks of human embryonic stem cells
- PMID: 27207879
- PMCID: PMC4937330
- DOI: 10.1093/nar/gkw450
Prediction of developmental chemical toxicity based on gene networks of human embryonic stem cells
Erratum in
-
Prediction of developmental chemical toxicity based on gene networks of human embryonic stem cells.Nucleic Acids Res. 2019 Feb 20;47(3):1600. doi: 10.1093/nar/gky1285. Nucleic Acids Res. 2019. PMID: 30566682 Free PMC article. No abstract available.
Abstract
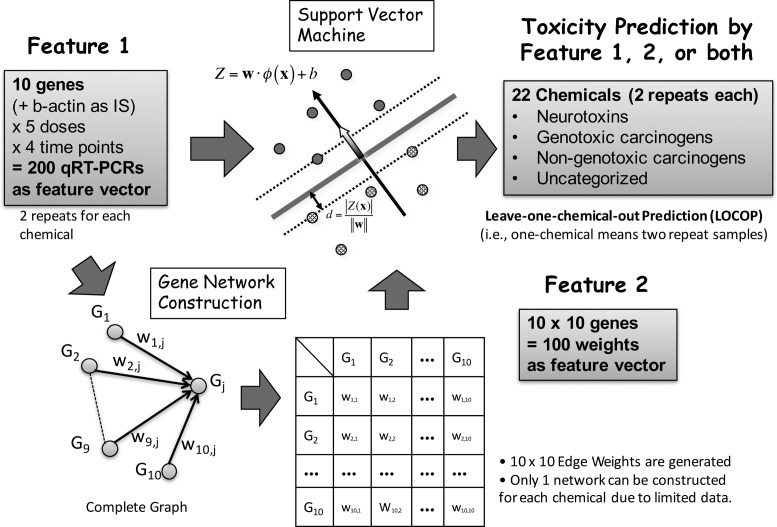
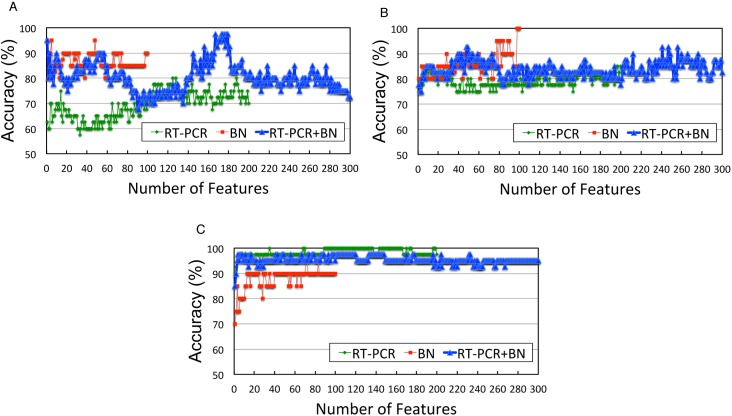
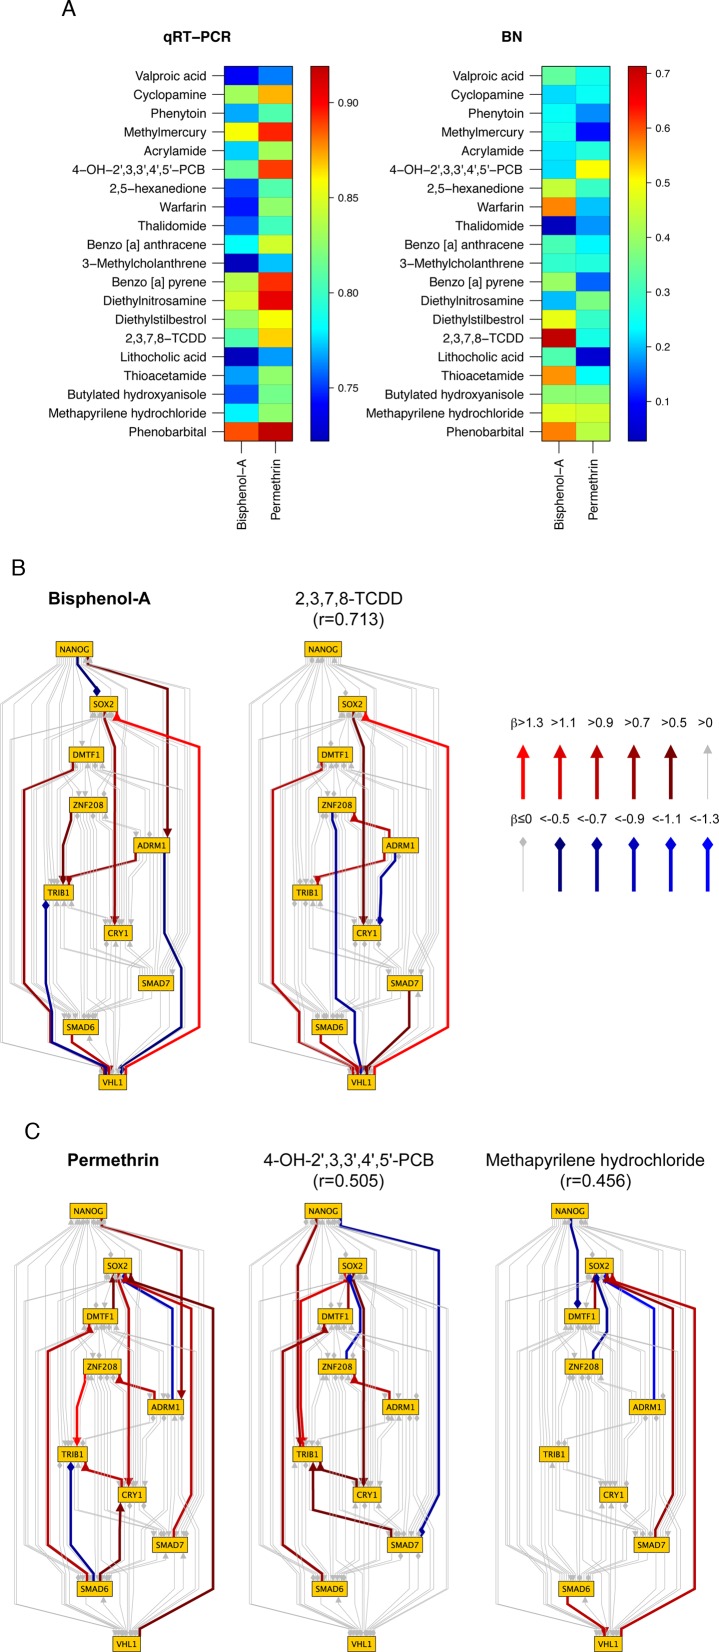
Predictive toxicology using stem cells or their derived tissues has gained increasing importance in biomedical and pharmaceutical research. Here, we show that toxicity category prediction by support vector machines (SVMs), which uses qRT-PCR data from 20 categorized chemicals based on a human embryonic stem cell (hESC) system, is improved by the adoption of gene networks, in which network edge weights are added as feature vectors when noisy qRT-PCR data fail to make accurate predictions. The accuracies of our system were 97.5-100% for three toxicity categories: neurotoxins (NTs), genotoxic carcinogens (GCs) and non-genotoxic carcinogens (NGCs). For two uncategorized chemicals, bisphenol-A and permethrin, our system yielded reasonable results: bisphenol-A was categorized as an NGC, and permethrin was categorized as an NT; both predictions were supported by recently published papers. Our study has two important features: (i) as the first study to employ gene networks without using conventional quantitative structure-activity relationships (QSARs) as input data for SVMs to analyze toxicogenomics data in an hESC validation system, it uses additional information of gene-to-gene interactions to significantly increase prediction accuracies for noisy gene expression data; and (ii) using only undifferentiated hESCs, our study has considerable potential to predict late-onset chemical toxicities, including abnormalities that occur during embryonic development.
© The Author(s) 2016. Published by Oxford University Press on behalf of Nucleic Acids Research.
Figures
Similar articles
-
[Construction of a High-precision Chemical Prediction System Using Human ESCs].Yakugaku Zasshi. 2018;138(6):815-822. doi: 10.1248/yakushi.17-00213-2. Yakugaku Zasshi. 2018. PMID: 29863053 Review. Japanese.
-
Stem Cell-Based Methods to Predict Developmental Chemical Toxicity.Methods Mol Biol. 2018;1800:475-483. doi: 10.1007/978-1-4939-7899-1_21. Methods Mol Biol. 2018. PMID: 29934906
-
Assessment of Bisphenol A (BPA) neurotoxicity in vitro with mouse embryonic stem cells.J Environ Sci (China). 2015 Oct 1;36:181-7. doi: 10.1016/j.jes.2015.06.004. Epub 2015 Jul 7. J Environ Sci (China). 2015. PMID: 26456621
-
Prediction model of potential hepatocarcinogenicity of rat hepatocarcinogens using a large-scale toxicogenomics database.Toxicol Appl Pharmacol. 2011 Sep 15;255(3):297-306. doi: 10.1016/j.taap.2011.07.001. Epub 2011 Jul 19. Toxicol Appl Pharmacol. 2011. PMID: 21784091
-
Characterizing and predicting carcinogenicity and mode of action using conventional and toxicogenomics methods.Mutat Res. 2010 Dec;705(3):184-200. doi: 10.1016/j.mrrev.2010.04.005. Epub 2010 Apr 24. Mutat Res. 2010. PMID: 20399889 Review.
Cited by
-
QSAR Models for Human Carcinogenicity: An Assessment Based on Oral and Inhalation Slope Factors.Molecules. 2020 Dec 29;26(1):127. doi: 10.3390/molecules26010127. Molecules. 2020. PMID: 33383938 Free PMC article.
-
Dose and Time Dependencies in Stress Pathway Responses during Chemical Exposure: Novel Insights from Gene Regulatory Networks.Front Genet. 2017 Oct 6;8:142. doi: 10.3389/fgene.2017.00142. eCollection 2017. Front Genet. 2017. PMID: 29085386 Free PMC article.
-
Knowledge graph aids comprehensive explanation of drug and chemical toxicity.CPT Pharmacometrics Syst Pharmacol. 2023 Aug;12(8):1072-1079. doi: 10.1002/psp4.12975. Epub 2023 Jul 20. CPT Pharmacometrics Syst Pharmacol. 2023. PMID: 37475158 Free PMC article.
-
Early Transcriptomic Changes upon Thalidomide Exposure Influence the Later Neuronal Development in Human Embryonic Stem Cell-Derived Spheres.Int J Mol Sci. 2020 Aug 3;21(15):5564. doi: 10.3390/ijms21155564. Int J Mol Sci. 2020. PMID: 32756504 Free PMC article.
-
Assessment of Toxic Effects of Ochratoxin A in Human Embryonic Stem Cells.Toxins (Basel). 2019 Apr 10;11(4):217. doi: 10.3390/toxins11040217. Toxins (Basel). 2019. PMID: 30974856 Free PMC article.
References
-
- Waters M., Stasiewicz S., Merrick B.A., Tomer K., Bushel P., Paules R., Stegman N., Nehls G., Yost K.J., Johnson C.H., et al. CEBS–Chemical Effects in Biological Systems: a public data repository integrating study design and toxicity data with microarray and proteomics data. Nucleic Acids Res. 2008;36(Suppl 1):D892–D900. - PMC - PubMed
-
- Noriyuki N., Igarashi Y., Ono A., Yamada H., Ohno Y., Urushidani T. Evaluation of DNA microarray results in the Toxicogenomics Project (TGP) consortium in Japan. J. Toxicol. Sci. 2011;37:791–801. - PubMed
-
- Hirai T., Kiyosawa N. Computational Toxicology. Humana Press; 2013. Developing a practical toxicogenomics data analysis system utilizing open-source software; pp. 357–374. - PubMed
Publication types
MeSH terms
Substances
LinkOut - more resources
Full Text Sources
Other Literature Sources
Molecular Biology Databases
Research Materials
