. 2016 Aug 19;44(14):e121.
doi: 10.1093/nar/gkw447. Epub 2016 May 20.

Engineering a robust DNA split proximity circuit with minimized circuit leakage

Affiliations

Engineering a robust DNA split proximity circuit with minimized circuit leakage

Yan Shan Ang et al. Nucleic Acids Res. .

Abstract

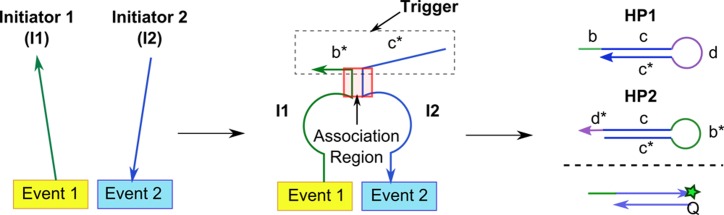
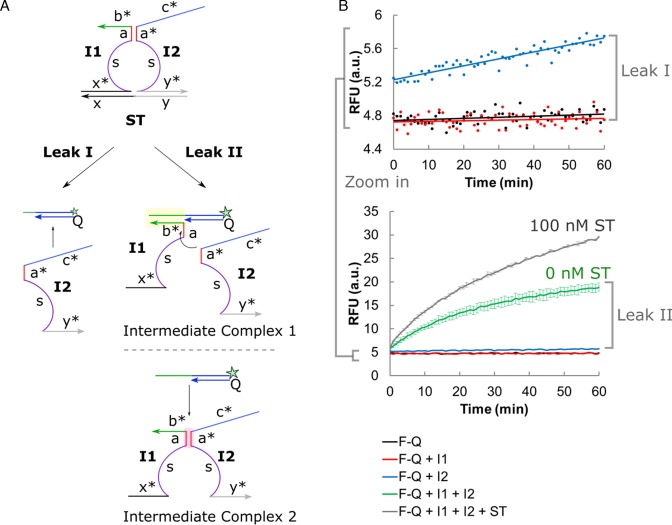
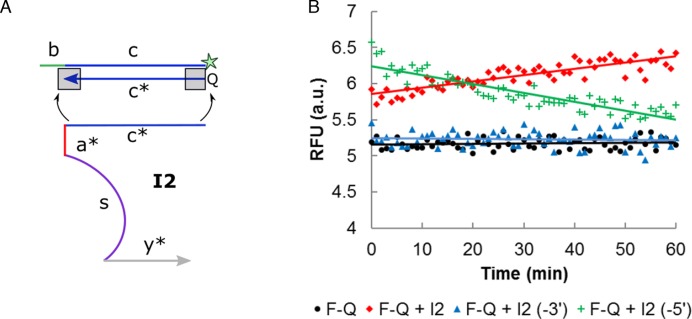
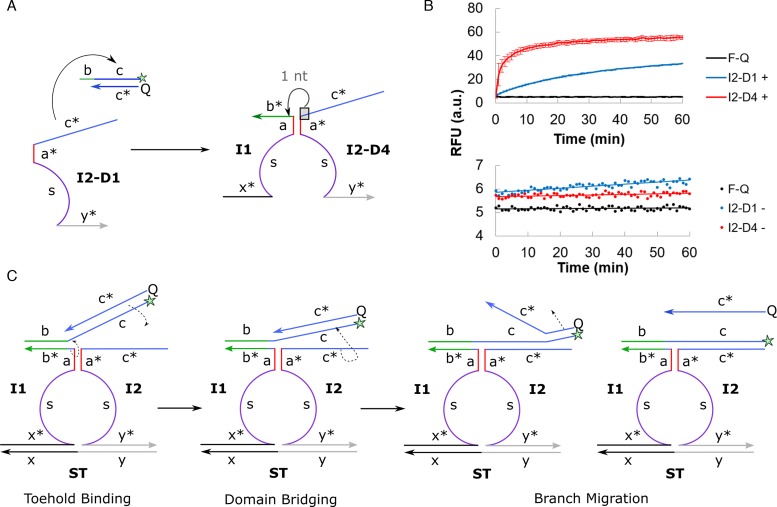
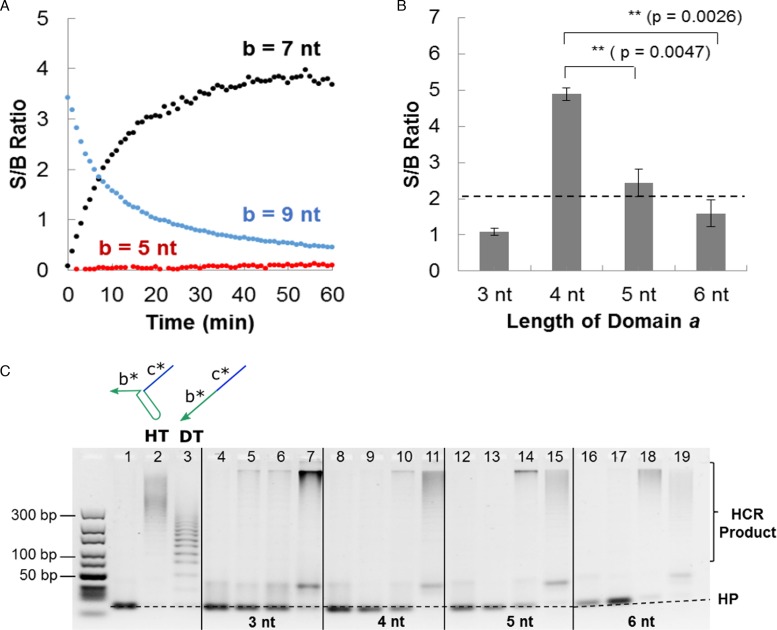
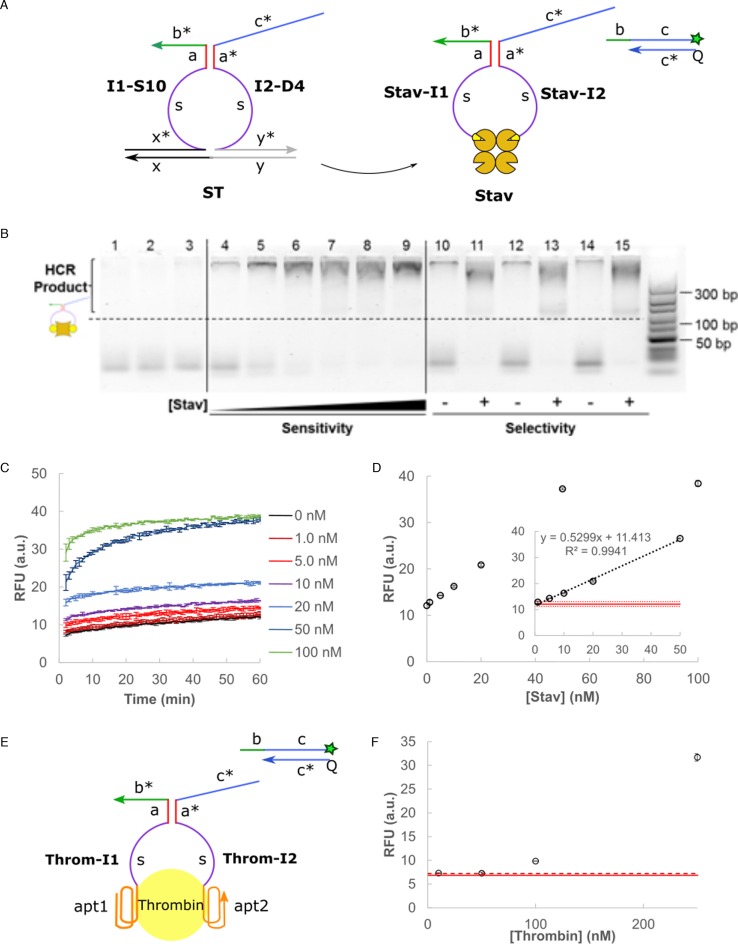
DNA circuit is a versatile and highly-programmable toolbox which can potentially be used for the autonomous sensing of dynamic events, such as biomolecular interactions. However, the experimental implementation of in silico circuit designs has been hindered by the problem of circuit leakage. Here, we systematically analyzed the sources and characteristics of various types of leakage in a split proximity circuit which was engineered to spatially probe for target sites held within close proximity. Direct evidence that 3'-truncated oligonucleotides were the major impurity contributing to circuit leakage was presented. More importantly, a unique strategy of translocating a single nucleotide between domains, termed 'inter-domain bridging', was introduced to eliminate toehold-independent leakages while enhancing the strand displacement kinetics across a three-way junction. We also analyzed the dynamics of intermediate complexes involved in the circuit computation in order to define the working range of domain lengths for the reporter toehold and association region respectively. The final circuit design was successfully implemented on a model streptavidin-biotin system and demonstrated to be robust against both circuit leakage and biological interferences. We anticipate that this simple signal transduction strategy can be used to probe for diverse biomolecular interactions when used in conjunction with specific target recognition moieties.


Figures

Figure 1.
Figure 1.
The split proximity circuit involved three steps: (1) binding of initiator 1 (I1) and initiator 2 (I2) strands to the respective recognition sites. (2) The close proximity of I1 and I2 kinetically favored the formation of a complete trigger strand (c* b*) which was stabilized by a short DNA association region to (3) initiate readout signals, e.g. hybridization chain reaction (HCR) or fluorophore–quencher (F-Q) system.
Figure 2.
Figure 2.
(A) The background noise could be attributed to two main sources of circuit leakage: Leak I - toehold-independent strand displacement by initiator 2 (I2), and Leak II - formation of intermediate complex 1 (I1–F–Q) or 2 (I1–I2) in presence of all DNA components except ST. (B) Different combinations of the DNA components (F–Q, I1, I2 and ST) revealed the types of leakages involved. Error bars shown indicate sample standard deviation of triplicate experiments. However, error bars were not shown for the narrow RFU range (top graph showing Leak I) to avoid congesting the plot.
Figure 3.
Figure 3.
(A) The initial leakage by I2 was attributed to the synthesis defect of Q strand. The corresponding nucleotide on I2 was removed to investigate the end (3′- or 5′-) which contributed predominantly to the leakage. (B) The omission of a single nucleotide at the 3′-end of I2 domain c*, i.e.I2 (-3′), was found to be most effective in minimizing the initial leakage. The mean values of triplicate readings were presented as scatter plot, while error bars were not shown for the narrow RFU range to avoid congesting the plot.
Figure 4.
Figure 4.
(A) A single nucleotide was translocated from domain c* to domain b* in I2–D4 design to minimize the asymptotic leakage in I2–D1. (B) The generation of positive signal (top) and Type I leakage (bottom) over time was evaluated in F–Q + I1 + I2 + ST and F–Q + I2 reaction mixture respectively. All reaction mixtures contained 100 nM of the relevant DNA components. Error bars shown for positive signal indicate sample standard deviation of triplicate experiments, while error bars were not shown for the narrow RFU range involved in circuit leakage to avoid congesting the plot. (C) The translocation of one nucleotide from domain c* to domain b* relieved the distinct separation of domains, in a strategy which we termed inter-domain bridging. First, toehold binding took place at domain b. Next, the single nucleotide brought over from domain c* initiated the displacement of the quencher (Q) strand and pulled the fluorophore–quencher (F–Q) complex towards domain c* of I2, effectively bridging the split domains spatially. Finally, strand displacement continued via the usual branch migration process.
Figure 5.
Figure 5.
(A) The length of domain b* was varied (5 nt, 7 nt and 9 nt) to understand the contribution to signal and background by intermediate complex 1. Refer to Supplementary Figure S4 for the decoupled signal and background time profiles. (B) An optimal association length (domain a*) of 4 nt resulted in maximum signal-to-background (S/B) ratio at t = 10 min using the fluorophore–quencher (F–Q) readout. Refer to Supplementary Figure S5 for the time evolution of S/B ratio using different lengths of domain a*. The error bars correspond to sample standard deviation (n = 3). ** indicates that P < 0.005 for Student's t-test (one-sided). The actual p-values are shown in bracket. (C) Gel electrophoresis was used to visualize the extent of signal and background formation. Lane 1 corresponds to hairpins (HP1 and HP2) only, lanes 2 and 3 correspond to positive controls using hairpin trigger (HT) and direct trigger (DT) respectively. Lanes representing each association region length (domain a*) are demarcated by solid lines and are shown in the following sequence (from left to right): HP1 + HP2 + I1, HP1 + HP2 + I2, HP1 + HP2 + I1 + I2, HP1 + HP2 + I1 + I2 + ST. 500 nM of individual DNA components was used. A 10–300 bp DNA ladder is shown on the left-hand side of the gel.
Figure 6.
Figure 6.
(A) The DNA split proximity circuit was tested on a model streptavidin (Stav)-biotin system. (B) The circuit performance was evaluated using gel electrophoresis and HCR readout. Lane 1 corresponds to hairpins (HP1 and HP2) only, lanes 2 and 3 correspond to controls with HP1 + HP2 + I1 and HP1 + HP2 + I2 respectively. Lanes 4–9 represent the signal developed in presence of 0 nM, 10 nM, 50 nM, 100 nM, 250 nM and 500 nM of Stav. Lanes 10– 15 represent the circuit selectivity in presence of interference from 500 nM BSA (lanes 10 and 11), 5000 nM BSA (lanes 12 and 13) and 10% FBS (lanes 14 and 15). 500 nM of individual DNA circuit components was used. A 10 – 300 bp DNA ladder is shown on the right-hand side of the gel. (C) Signal trace over time in 1 min intervals when varying concentration of Stav (0–100 nM) was added to the split proximity circuit. Error bars correspond to sample standard deviation (n = 3). (D) The equilibrium RFU signal at t = 1 h was plotted for the range of Stav concentrations tested. A linear trend was observed between 0 and 50 nM (inset). The solid red line corresponds to the mean background noise while the dotted red line corresponds to 3 standard deviations from the mean noise level. (E) The recognition moiety was replaced by thrombin binding aptamer with known binding affinities to thrombin target to demonstrate the versatility of this method. (F) Dosage dependence of the fluorescence signal on thrombin concentration was observed for the range tested (10–250 nM). The solid red line corresponds to the mean background noise while the dotted red line corresponds to 3 standard deviations from the mean noise level. The reaction buffer was modified as 10 mM Tris (pH 7.0), 140 mM NaCl, 10 mM KCl and 5 mM MgCl2 to maintain good aptamer-thrombin binding.

Similar articles

Cited by

References

    1. Fukuyama S., Kawaoka Y. The pathogenesis of influenza virus infections: the contributions of virus and host factors. Curr. Opin. Immunol. 2011;23:481–486. - PMC - PubMed
    1. Wu H. Higher-order assemblies in a new paradigm of signal transduction. Cell. 2013;153:287–292. - PMC - PubMed
    1. Legrain P., Rain J.-C. Twenty years of protein interaction studies for biological function deciphering. J. Proteomics. 2014;107:93–97. - PubMed
    1. Berggård T., Linse S., James P. Methods for the detection and analysis of protein–protein interactions. Proteomics. 2007;7:2833–2842. - PubMed
    1. Koussa M.A., Halvorsen K., Ward A., Wong W.P. DNA nanoswitches: a quantitative platform for gel-based biomolecular interaction analysis. Nat. Methods. 2015;12:123–126. - PMC - PubMed

Publication types