

Development and Validation of an Agency for Healthcare Research and Quality Indicator for Mortality After Congenital Heart Surgery Harmonized With Risk Adjustment for Congenital Heart Surgery (RACHS-1) Methodology
- PMID: 27207997
- PMCID: PMC4889177
- DOI: 10.1161/JAHA.115.003028
Development and Validation of an Agency for Healthcare Research and Quality Indicator for Mortality After Congenital Heart Surgery Harmonized With Risk Adjustment for Congenital Heart Surgery (RACHS-1) Methodology
Abstract
Background: The National Quality Forum previously approved a quality indicator for mortality after congenital heart surgery developed by the Agency for Healthcare Research and Quality (AHRQ). Several parameters of the validated Risk Adjustment for Congenital Heart Surgery (RACHS-1) method were included, but others differed. As part of the National Quality Forum endorsement maintenance process, developers were asked to harmonize the 2 methodologies.
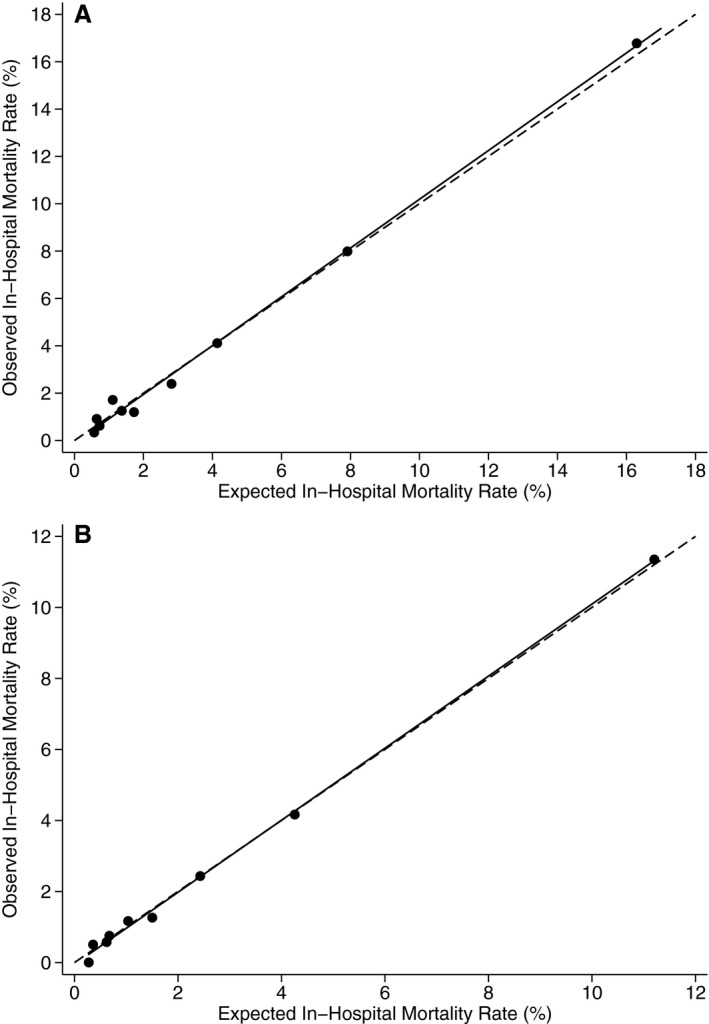
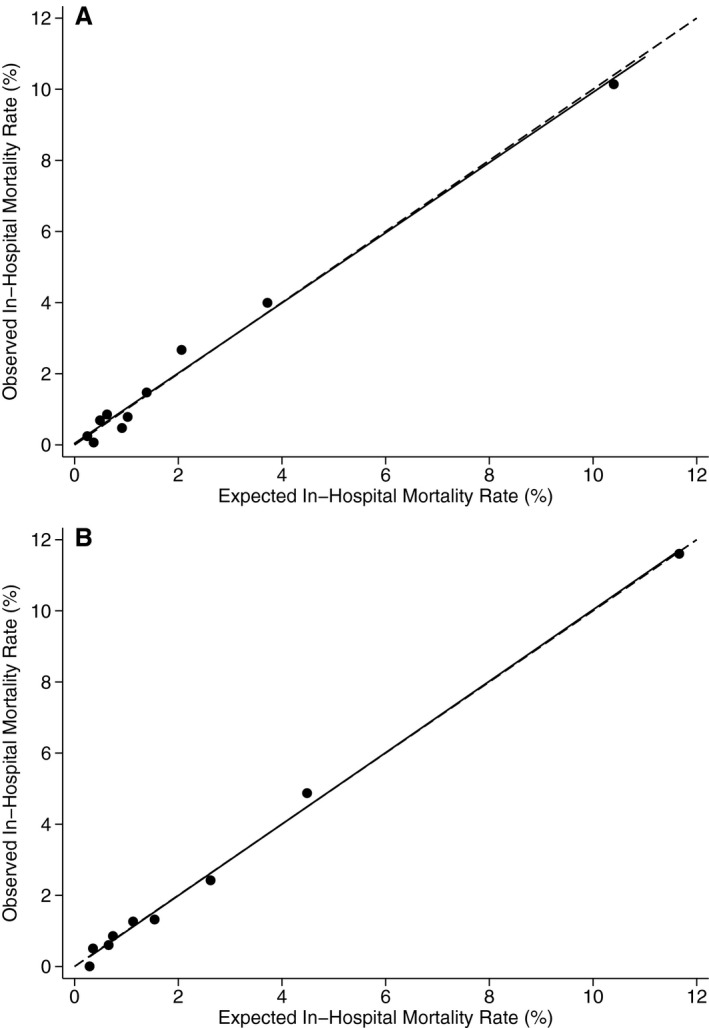
Methods and results: Parameters that were identical between the 2 methods were retained. AHRQ's Healthcare Cost and Utilization Project State Inpatient Databases (SID) 2008 were used to select optimal parameters where differences existed, with a goal to maximize model performance and face validity. Inclusion criteria were not changed and included all discharges for patients <18 years with International Classification of Diseases, Ninth Revision, Clinical Modification procedure codes for congenital heart surgery or nonspecific heart surgery combined with congenital heart disease diagnosis codes. The final model includes procedure risk group, age (0-28 days, 29-90 days, 91-364 days, 1-17 years), low birth weight (500-2499 g), other congenital anomalies (Clinical Classifications Software 217, except for 758.xx), multiple procedures, and transfer-in status. Among 17 945 eligible cases in the SID 2008, the c statistic for model performance was 0.82. In the SID 2013 validation data set, the c statistic was 0.82. Risk-adjusted mortality rates by center ranged from 0.9% to 4.1% (5th-95th percentile).
Conclusions: Congenital heart surgery programs can now obtain national benchmarking reports by applying AHRQ Quality Indicator software to hospital administrative data, based on the harmonized RACHS-1 method, with high discrimination and face validity.
Keywords: congenital heart defects; mortality; pediatrics; risk factors.
© 2016 The Authors. Published on behalf of the American Heart Association, Inc., by Wiley Blackwell.
Figures
Similar articles
-
Predictors of 90-day mortality after congenital heart surgery: the first report of risk models from a Japanese database.J Thorac Cardiovasc Surg. 2014 Nov;148(5):2201-6. doi: 10.1016/j.jtcvs.2013.01.053. Epub 2014 Jan 15. J Thorac Cardiovasc Surg. 2014. PMID: 25444193
-
Risk Stratification for Congenital Heart Surgery for ICD-10 Administrative Data (RACHS-2).J Am Coll Cardiol. 2022 Feb 8;79(5):465-478. doi: 10.1016/j.jacc.2021.11.036. J Am Coll Cardiol. 2022. PMID: 35115103 Free PMC article.
-
Measuring hospital performance in congenital heart surgery: administrative versus clinical registry data.Ann Thorac Surg. 2015 Mar;99(3):932-8. doi: 10.1016/j.athoracsur.2014.10.069. Epub 2015 Jan 24. Ann Thorac Surg. 2015. PMID: 25624057 Free PMC article.
-
Consensus-based method for risk adjustment for surgery for congenital heart disease.J Thorac Cardiovasc Surg. 2002 Jan;123(1):110-8. doi: 10.1067/mtc.2002.119064. J Thorac Cardiovasc Surg. 2002. PMID: 11782764 Review.
-
The science of assessing the outcomes and improving the quality of the congenital and paediatric cardiac care.Curr Opin Cardiol. 2015 Jan;30(1):100-11. doi: 10.1097/HCO.0000000000000133. Curr Opin Cardiol. 2015. PMID: 25469591 Review.
Cited by
-
[Clinical characteristics and prognostic analysis of children with congenital heart disease complicated by postoperative acute kidney injury].Zhongguo Dang Dai Er Ke Za Zhi. 2017 Nov;19(11):1196-1201. doi: 10.7499/j.issn.1008-8830.2017.11.014. Zhongguo Dang Dai Er Ke Za Zhi. 2017. PMID: 29132469 Free PMC article. Chinese.
-
Wider intraoperative glycemic fluctuation increases risk of acute kidney injury after pediatric cardiac surgery.Ren Fail. 2018 Nov;40(1):611-617. doi: 10.1080/0886022X.2018.1532908. Ren Fail. 2018. PMID: 30396300 Free PMC article.
-
Development of a set of quality indicators in paediatric and perinatal care in Japan with a modified Delphi method.BMJ Paediatr Open. 2023 Nov;7(1):e002209. doi: 10.1136/bmjpo-2023-002209. BMJ Paediatr Open. 2023. PMID: 37940343 Free PMC article.
-
RACHS - ANZ : A Modified Risk Adjustment in Congenital Heart Surgery Model for Outcome Surveillance in Australia and New Zealand.J Am Heart Assoc. 2019 May 7;8(9):e011390. doi: 10.1161/JAHA.118.011390. J Am Heart Assoc. 2019. PMID: 31039662 Free PMC article.
-
Establishing a High-Quality Congenital Cardiac Surgery Program in a Developing Country: Lessons Learned.Front Pediatr. 2020 Jul 30;8:357. doi: 10.3389/fped.2020.00357. eCollection 2020. Front Pediatr. 2020. PMID: 32850519 Free PMC article.
References
-
- Nembhard WN, Salemi JL, Ethen MK, Fixler DE, Dimaggio A, Canfield MA. Racial/Ethnic disparities in risk of early childhood mortality among children with congenital heart defects. Pediatrics. 2011;127:e1128–e1138. - PubMed
-
- McElhinney DB, Wernovsky G. Outcomes of neonates with congenital heart disease. Curr Opin Pediatr. 2001;13:104–110. - PubMed
-
- Jenkins KJ, Gauvreau K. Center‐specific differences in mortality: preliminary analyses using the risk adjustment in congenital heart surgery (RACHS‐1) method. J Thorac Cardiovasc Surg. 2002;124:97–104. - PubMed
-
- Jacobs JP, O'Brien SM, Pasquali SK, Jacobs ML, Lacour‐Gayet FG, Tchervenkov CI, Austin EH III, Pizarro C, Pourmoghadam KK, Scholl FG, Welke KF, Gaynor JW, Clarke DR, Mayer JE Jr, Mavroudis C. Variation in outcomes for risk‐stratified pediatric cardiac surgical operations: an analysis of the STS congenital heart surgery database. Ann Thorac Surg. 2012;94:564–571; discussion 571‐562. - PMC - PubMed
-
- Jacobs JP, O'Brien SM, Pasquali SK, Jacobs ML, Lacour‐Gayet FG, Tchervenkov CI, Austin EH III, Pizarro C, Pourmoghadam KK, Scholl FG, Welke KF, Mavroudis C. Variation in outcomes for benchmark operations: an analysis of the Society of Thoracic Surgeons Congenital Heart Surgery Database. Ann Thorac Surg. 2011;92:2184–2191; discussion 2191‐2182. - PMC - PubMed
Publication types
MeSH terms
LinkOut - more resources
Full Text Sources
Other Literature Sources
Medical
Research Materials
