

Integration of Life-Stage Physiologically Based Pharmacokinetic Models with Adverse Outcome Pathways and Environmental Exposure Models to Screen for Environmental Hazards
- PMID: 27208077
- PMCID: PMC5009469
- DOI: 10.1093/toxsci/kfw082
Integration of Life-Stage Physiologically Based Pharmacokinetic Models with Adverse Outcome Pathways and Environmental Exposure Models to Screen for Environmental Hazards
Abstract
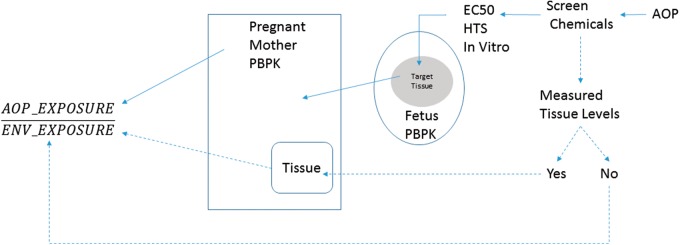
A computational framework was developed to assist in screening and prioritizing chemicals based on their dosimetry, toxicity, and potential exposures. The overall strategy started with contextualizing chemical activity observed in high-throughput toxicity screening (HTS) by mapping these assays to biological events described in Adverse Outcome Pathways (AOPs). Next, in vitro to in vivo (IVIVE) extrapolation was used to convert an in vitro dose to an external exposure level, which was compared with potential exposure levels to derive an AOP-based margins of exposure (MOE). In this study, the framework was applied to estimate MOEs for chemicals that can potentially cause developmental toxicity following a putative AOP for fetal vasculogenesis/angiogenesis. A physiologically based pharmacokinetic (PBPK) model was developed to describe chemical disposition during pregnancy, fetal, neonatal, and infant to adulthood stages. Using this life-stage PBPK model, maternal exposures were estimated that would yield fetal blood levels equivalent to the chemical concentration that altered in vitro activity of selected HTS assays related to the most sensitive vasculogenesis/angiogenesis putative AOP. The resulting maternal exposure estimates were then compared with potential exposure levels using literature data or exposure models to derive AOP-based MOEs.
Keywords: AOPs; PBPK; developmental toxicology; environmental toxicology; life-stage.
Published by Oxford University Press on behalf of the Society of Toxicology 2016. This work is written by US Government employees and is in the public domain in the US.
Figures


Similar articles
-
Species extrapolation of life-stage physiologically-based pharmacokinetic (PBPK) models to investigate the developmental toxicology of ethanol using in vitro to in vivo (IVIVE) methods.Toxicol Sci. 2015 Feb;143(2):512-35. doi: 10.1093/toxsci/kfu246. Epub 2014 Nov 18. Toxicol Sci. 2015. PMID: 25410581
-
Implementing Toxicity Testing in the 21st Century (TT21C): Making safety decisions using toxicity pathways, and progress in a prototype risk assessment.Toxicology. 2015 Jun 5;332:102-11. doi: 10.1016/j.tox.2014.02.007. Epub 2014 Feb 25. Toxicology. 2015. PMID: 24582757
-
Computational toxicology as implemented by the U.S. EPA: providing high throughput decision support tools for screening and assessing chemical exposure, hazard and risk.J Toxicol Environ Health B Crit Rev. 2010 Feb;13(2-4):197-217. doi: 10.1080/10937404.2010.483935. J Toxicol Environ Health B Crit Rev. 2010. PMID: 20574897
-
Approaches for applications of physiologically based pharmacokinetic models in risk assessment.J Toxicol Environ Health B Crit Rev. 2008 Aug;11(7):519-47. doi: 10.1080/10937400701724337. J Toxicol Environ Health B Crit Rev. 2008. PMID: 18584453 Review.
-
Determination of a site-specific reference dose for methylmercury for fish-eating populations.Toxicol Ind Health. 2000 Nov;16(9-10):335-438. doi: 10.1177/074823370001600901. Toxicol Ind Health. 2000. PMID: 11762928 Review.
Cited by
-
In vitro to in vivo extrapolation for high throughput prioritization and decision making.Toxicol In Vitro. 2018 Mar;47:213-227. doi: 10.1016/j.tiv.2017.11.016. Epub 2017 Dec 5. Toxicol In Vitro. 2018. PMID: 29203341 Free PMC article. Review.
-
Prediction Model with High-Performance Constitutive Androstane Receptor (CAR) Using DeepSnap-Deep Learning Approach from the Tox21 10K Compound Library.Int J Mol Sci. 2019 Sep 30;20(19):4855. doi: 10.3390/ijms20194855. Int J Mol Sci. 2019. PMID: 31574921 Free PMC article.
-
Use of computational toxicology tools to predict in vivo endpoints associated with Mode of Action and the endocannabinoid system: A case study with chlorpyrifos, chlorpyrifos-oxon and Δ9Tetrahydrocannabinol.Curr Res Toxicol. 2022 Feb 7;3:100064. doi: 10.1016/j.crtox.2022.100064. eCollection 2022. Curr Res Toxicol. 2022. PMID: 35243363 Free PMC article.
-
Advances in computational methods along the exposure to toxicological response paradigm.Toxicol Appl Pharmacol. 2022 Sep 1;450:116141. doi: 10.1016/j.taap.2022.116141. Epub 2022 Jun 29. Toxicol Appl Pharmacol. 2022. PMID: 35777528 Free PMC article.
-
High-Throughput Analysis of Ovarian Cycle Disruption by Mixtures of Aromatase Inhibitors.Environ Health Perspect. 2017 Jul 19;125(7):077012. doi: 10.1289/EHP742. Environ Health Perspect. 2017. PMID: 28886606 Free PMC article.
References
-
- Alcorn J., McNamara P. J. (2003). Pharmacokinetics in the newborn. Adv. Drug Deliv. Rev. 55, 667–686. - PubMed
-
- Ankley G. T., Bennett R. S., Erickson R. J., Hoff D. J., Hornung M. W., Johnson R. D., Mount D. R., Nichols J. W., Russom C. L., Schmieder P. K., et al. (2010). Adverse outcome pathways: A conceptual framework to support ecotoxicology research and risk assessment. Environ. Toxicol. Chem. 29, 730–741. - PubMed
-
- Agency for Toxic Substances and Disease Registry (ATSDR). (2015). Draft toxicological profile for perfluoroalkyls In U.S. Department of Health and Human Services. Public Health Services, Atlanta, GA.
-
- Barter Z. E., Bayliss M. K., Beaune P. H., Boobis A. R., Carlile D. J., Edwards R. J., Houston J. B., Lake B. G., Lipscomb J. C., Pelkonen O. R., et al. (2007). Scaling factors for the extrapolation of in vivo metabolic drug clearance from in vitro data: reaching a consensus on values of human microsomal protein and hepatocellularity per gram of liver. Curr. Drug Metab. 8, 33–45. - PubMed
-
- Baschat A. A. (2006). The fetal circulation and essential organs-a new twist to an old tale. Ultrasound Obstet. Gynecol. 27, 349–354. - PubMed
MeSH terms
Substances
LinkOut - more resources
Full Text Sources
Other Literature Sources
