. 2016 Aug;152(2):323-39.
doi: 10.1093/toxsci/kfw092. Epub 2016 May 20.

Editor's Highlight: Analysis of the Effects of Cell Stress and Cytotoxicity on In Vitro Assay Activity Across a Diverse Chemical and Assay Space

Affiliations

Editor's Highlight: Analysis of the Effects of Cell Stress and Cytotoxicity on In Vitro Assay Activity Across a Diverse Chemical and Assay Space

Richard Judson et al. Toxicol Sci. 2016 Aug.

Erratum in

Abstract

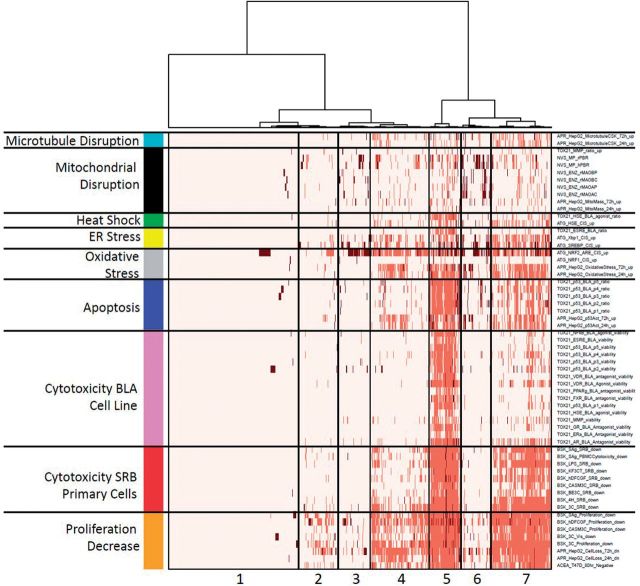
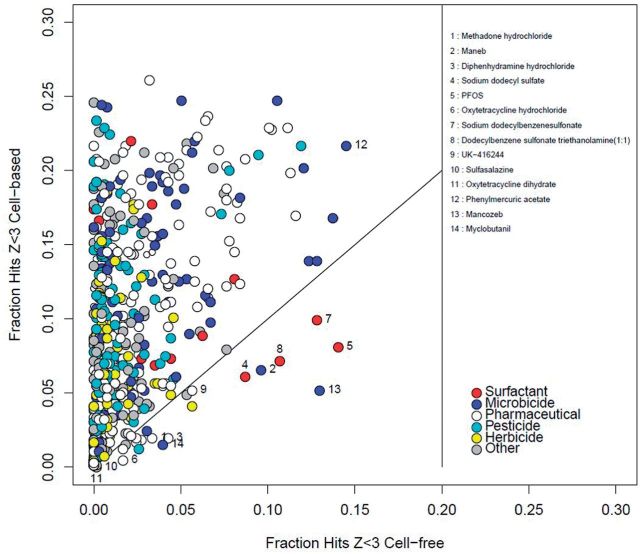
Chemical toxicity can arise from disruption of specific biomolecular functions or through more generalized cell stress and cytotoxicity-mediated processes. Here, responses of 1060 chemicals including pharmaceuticals, natural products, pesticidals, consumer, and industrial chemicals across a battery of 815 in vitro assay endpoints from 7 high-throughput assay technology platforms were analyzed in order to distinguish between these types of activities. Both cell-based and cell-free assays showed a rapid increase in the frequency of responses at concentrations where cell stress/cytotoxicity responses were observed in cell-based assays. Chemicals that were positive on at least 2 viability/cytotoxicity assays within the concentration range tested (typically up to 100 μM) activated a median of 12% of assay endpoints whereas those that were not cytotoxic in this concentration range activated 1.3% of the assays endpoints. The results suggest that activity can be broadly divided into: (1) specific biomolecular interactions against one or more targets (eg, receptors or enzymes) at concentrations below which overt cytotoxicity-associated activity is observed; and (2) activity associated with cell stress or cytotoxicity, which may result from triggering specific cell stress pathways, chemical reactivity, physico-chemical disruption of proteins or membranes, or broad low-affinity non-covalent interactions. Chemicals showing a greater number of specific biomolecular interactions are generally designed to be bioactive (pharmaceuticals or pesticidal active ingredients), whereas intentional food-use chemicals tended to show the fewest specific interactions. The analyses presented here provide context for use of these data in ongoing studies to predict in vivo toxicity from chemicals lacking extensive hazard assessment.

Keywords: In vitro; cell stress; cytotoxicity; high-throughput screening; oxidative stress.


Figures

FIG. 1.
FIG. 1.
Illustration of the high incidence of assay hits overlapping the cytotoxicity concentration region for 3 hypothetical chemicals (left panel), compared with the same distribution normalized to the Z-score space (right panel) to allow cross-chemical cytotoxicity region comparisons. For approximately 50% of chemicals tested, we observe cytotoxicity in the range of concentrations tested (up to ∼100 μM). For most of these chemicals, we also observe a large number of assay hits with AC50 values within the cytotoxicity region, represented by gray shading. The Z-score is a measure of how many MAD units below the median cytotoxicity value we observe a specific AC50, and allows for alignment of cytotoxicity regions across chemicals, independent of specific AC50s. The red “T” indicates the median and width (3 MAD) of the cytotoxicity AC50s. The activities of the third (bottom) chemical are inferred, because they occur at concentrations above those tested.
FIG. 2.
FIG. 2.
A, Examples showing assay activities both within and outside of the region of cytotoxicity for 4 bisphenol compounds. The histogram shows the distribution of AC50 values across the full assay set for each chemical. The vertical red bar shows the median of the log(AC50) of the cytotoxicity assays, and the gray box indicates the cytotoxicity region, starting 3 cytotoxicity-MAD (0.293 log units) below the median. The red stars indicate the AC50 values for the cytotoxicity assays activated by these chemicals (8 or more cytotoxity-related assays were active in each case). The x-axis (concentration) positions of the triangles indicate the AC50 values for estrogen receptor pathway assays. The y-axis positions for the triangles are randomly generated to prevent overlap of the symbols. Different colors indicate different technologies (black = NovaScreen, pink = Attagene, green = Tox21, gray = Odyssey Thera, red = ACEA). Up-arrows are agonist assays and down-arrows are antagonist assays. In the legend, ntry is the number of assay endpoints tested, excluding cytotoxicity endpoints, nhit is the number active, and nhit (Z > 3) is the number active with Z > 3. The cytotoxicity median and min are in units of μM and give the position of the red vertical line and the left end of the gray cytotoxicity region box (Z = 3). B, Structures of the example chemicals. BPA = bisphenol A, BPAF = bisphenol AF, BPB = bisphenol B, TB-BPA = 3,3’,5,5’-tetrabromo bisphenol A.
FIG. 3.
FIG. 3.
Distributions of Z-scores for all assays from 4 representative technologies, 2 cell-free (NVS_NR, NVS_ADME) and 2 cell-based (ATG_TRANS and BSK_up). Each histogram bar represents the number of assay-active chemicals in a particular Z-score range (AC50s transformed to Z-score based on cytotoxicity threshold for a particular chemical, equation 1), and the y-axis is scaled to the maximum number of hits in each case. The left hand column contains data for the cytotoxic chemicals (n = 529, ≥2 cytotoxicity assays hit), whereas the right hand contains data for the non-cytotoxic chemicals (n = 531, <2 cytotoxicity assays hit). The lines are placed at Z = 0 and 3. Plots for all technologies are given in Supplementary Data.
FIG. 4.
FIG. 4.
Boxplots showing the fraction of assays per chemical with Z > 3 (High-Z, left) and Z < 3 (Low-Z, right) in the aggregated use categories. The number at the top of each column is the number of chemicals in each group. Below that is the t-test P-value comparing the distribution of hit-fractions for each group versus the Food category. In all cases except for Solvents in the High-Z plot, all groups were more active than the Food group. NS indicates that there was no statistically significant difference. In each boxplot, the median is indicated by the dark horizontal line; the second and third quartiles by the box; the 95th percentile by the whiskers; and outliers by the circles.
FIG. 5.
FIG. 5.
Heatmap of activity in the 64 cytotoxicity and cell stress response assays. The ordering of assays was fixed as shown, but chemicals were hierarchically clustered. The top color bar indicates the total number of assays hit by a chemical: blue (<10), green (<50), yellow (<100), orange (<150), and red (>150). The color code in the heatmap is: no activity (white), activity with Z < 3 (light red), and activity with Z > 3 (dark red/brown).
FIG. 6.
FIG. 6.
Analysis of hit-frequency in cell-based versus cell-free assays: Each circle show the information for a single chemical where the x and y values are the fraction of assays in the cell-free and cell-based classes, respectively. The diagonal line shows a 1:1 ratio. Points are colored as indicated in the legend. The text discusses the named chemicals.

Similar articles

Cited by

References

    1. Abassi Y. A., Xi B., Zhang W., Ye P., Kirstein S. L., Gaylord M. R., Feinstein S. C., Wang X., Xu X. (2009). Kinetic cell-based morphological screening: prediction of mechanism of compound action and off-target effects. Chem. Biol. 16, 712–723. - PMC - PubMed
    1. Akaike H. (1998). Information Theory and an Extension of the Maximum Likelihood Principle. Springer, New York.
    1. Ankley G. T., Bennett R. S., Erickson R. J., Hoff D. J., Hornung M. W., Johnson R. D., Mount D. R., Nichols J. W., Russom C. L., Schmieder P. K., et al. (2010). Adverse outcome pathways: a conceptual framework to support ecotoxicology research and risk assessment. Environ. Toxicol. Chem. 29, 730–741. - PubMed
    1. Ashburner M., Ball C. A., Blake J. A., Botstein D., Butler H., Cherry J. M., Davis A. P., Dolinski K., Dwight S. S., Eppig J. T., et al. (2000). Gene ontology: Tool for the unification of biology. The Gene Ontology Consortium. Nat. Genet. 25, 25–29. - PMC - PubMed
    1. Attene-Ramos M. S., Huang R., Michael S., Witt K. L., Richard A., Tice R. R., Simeonov A., Austin C. P., Xia M. (2015). Profiling of the Tox21 chemical collection for mitochondrial function to identify compounds that acutely decrease mitochondrial membrane potential. Environ. Health Perspect. 123, 49–56. - PMC - PubMed

Publication types