. 2016 Jun 7;113(23):E3300-6.
doi: 10.1073/pnas.1605973113. Epub 2016 May 20.

Combinatorial effects of odorants on mouse behavior

Affiliations

Combinatorial effects of odorants on mouse behavior

Luis R Saraiva et al. Proc Natl Acad Sci U S A. .

Abstract

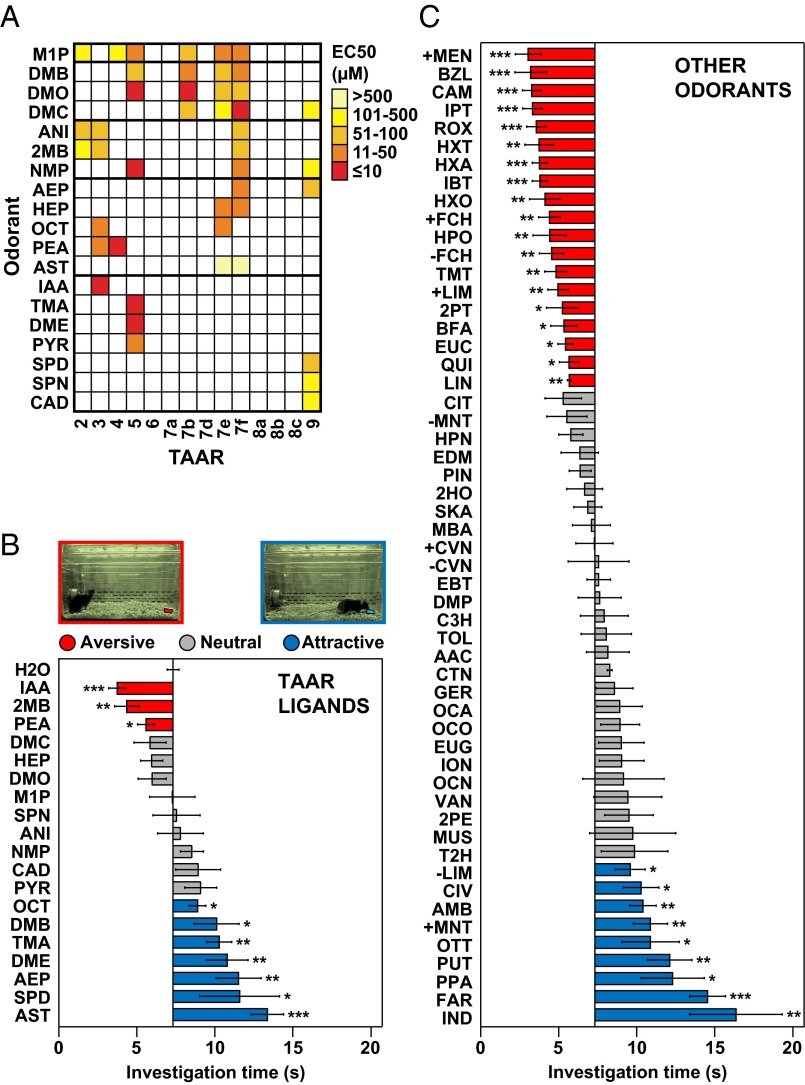
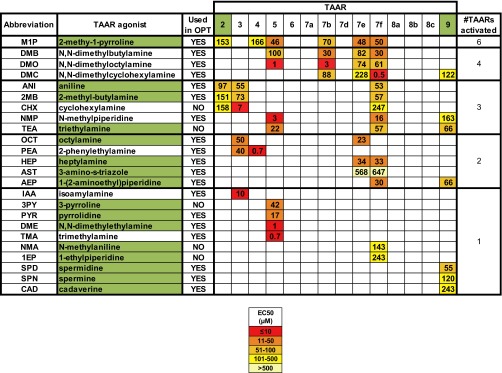
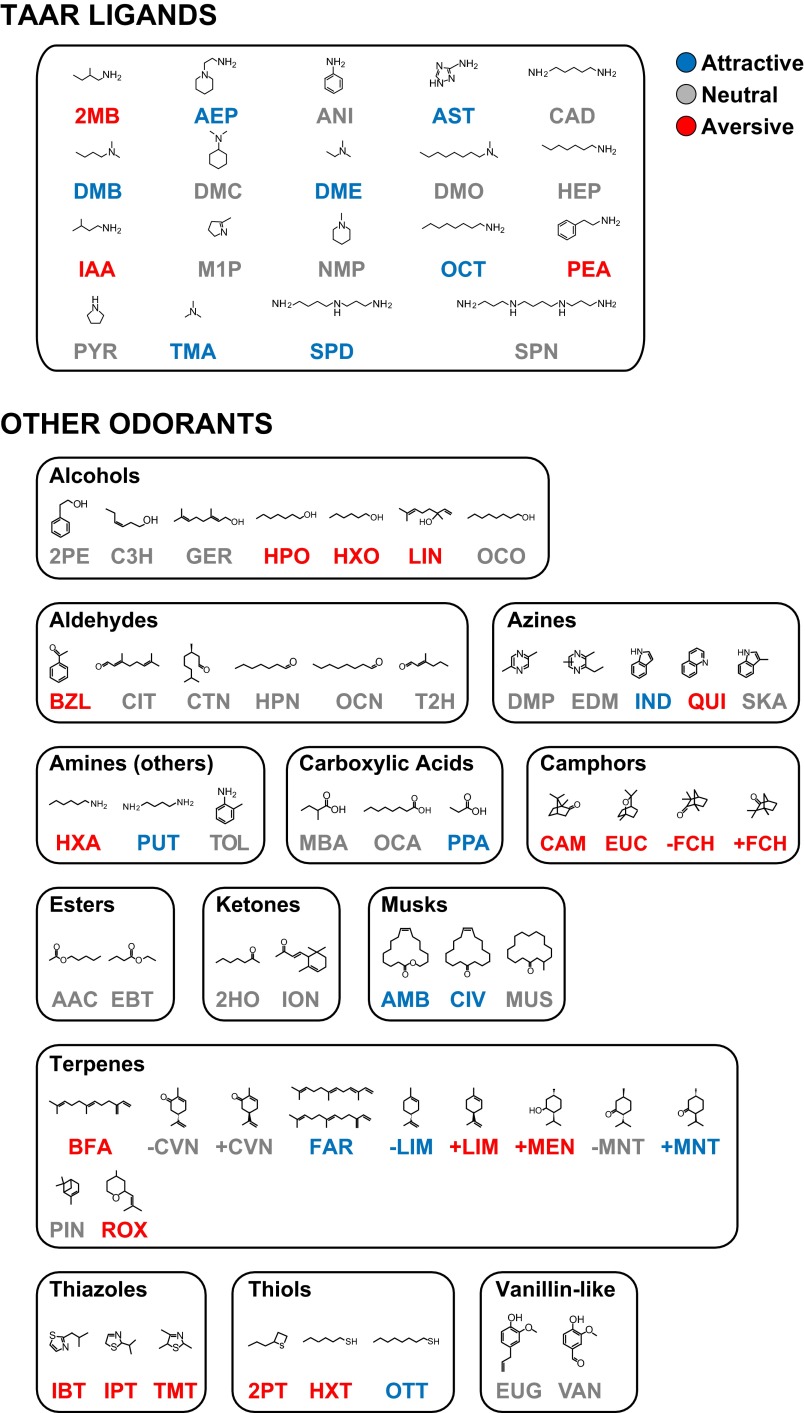
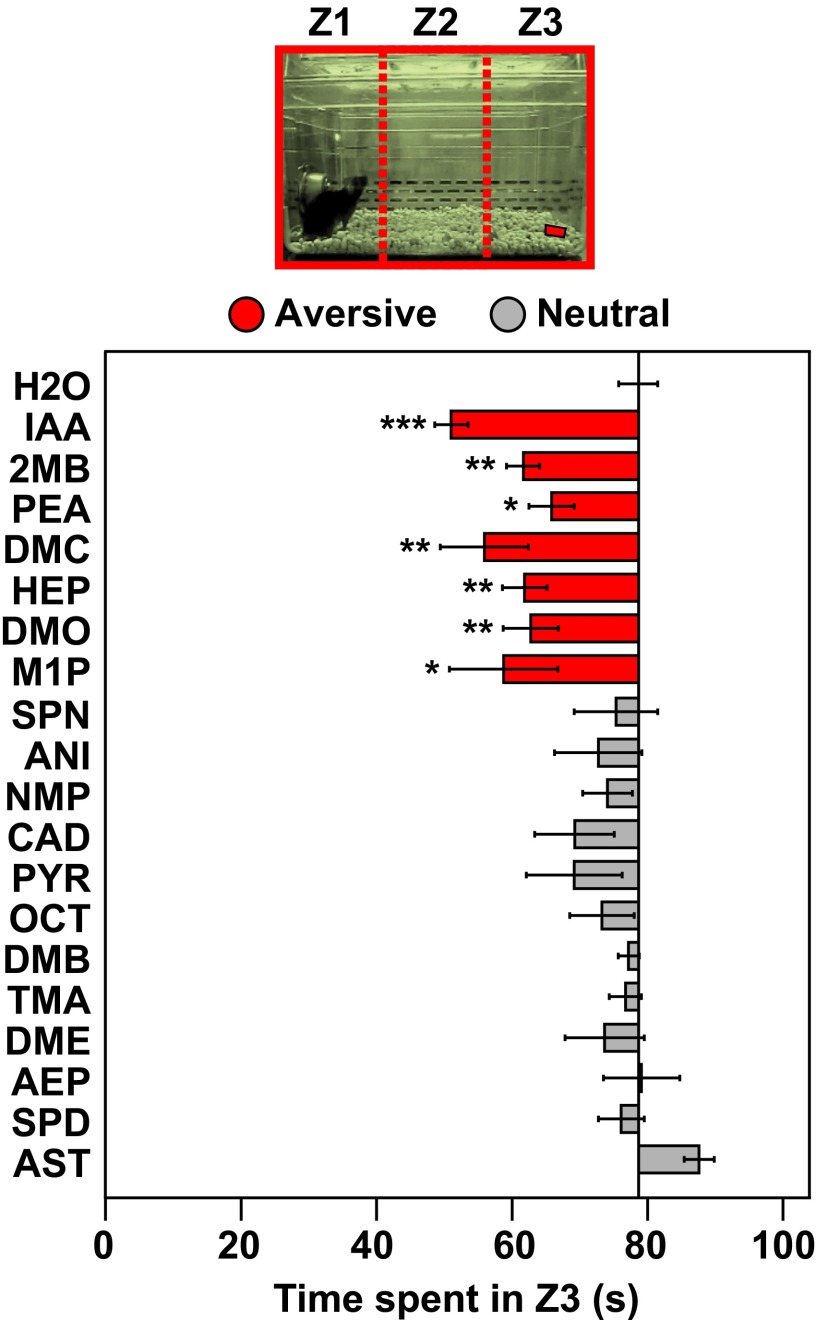
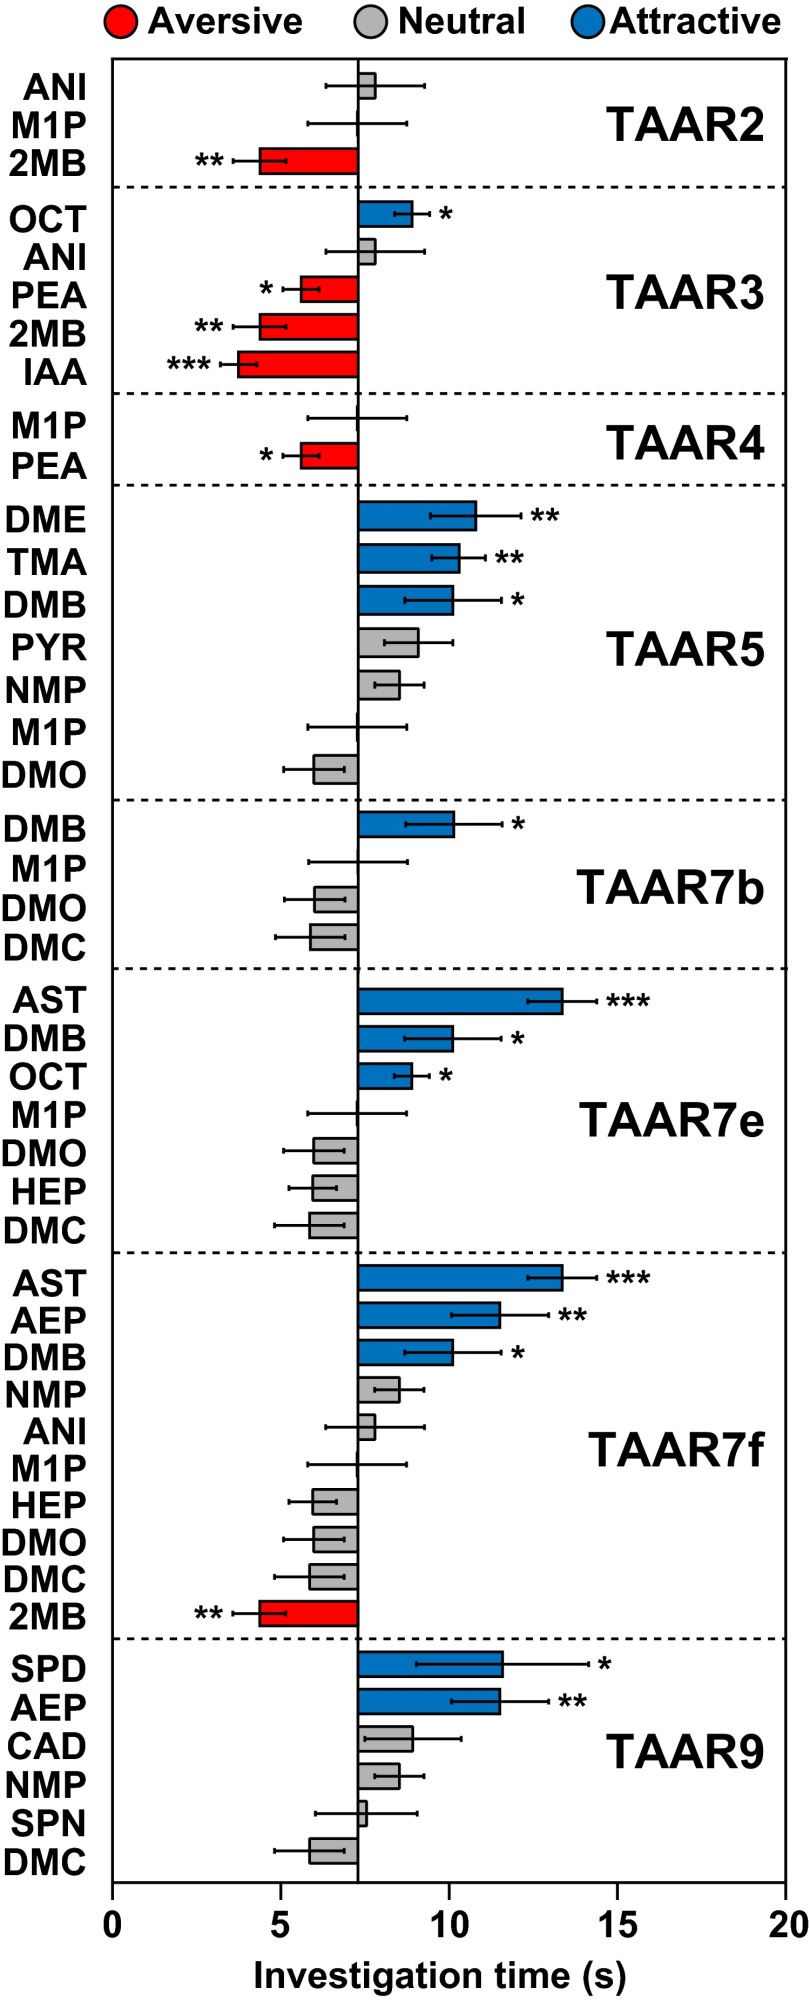
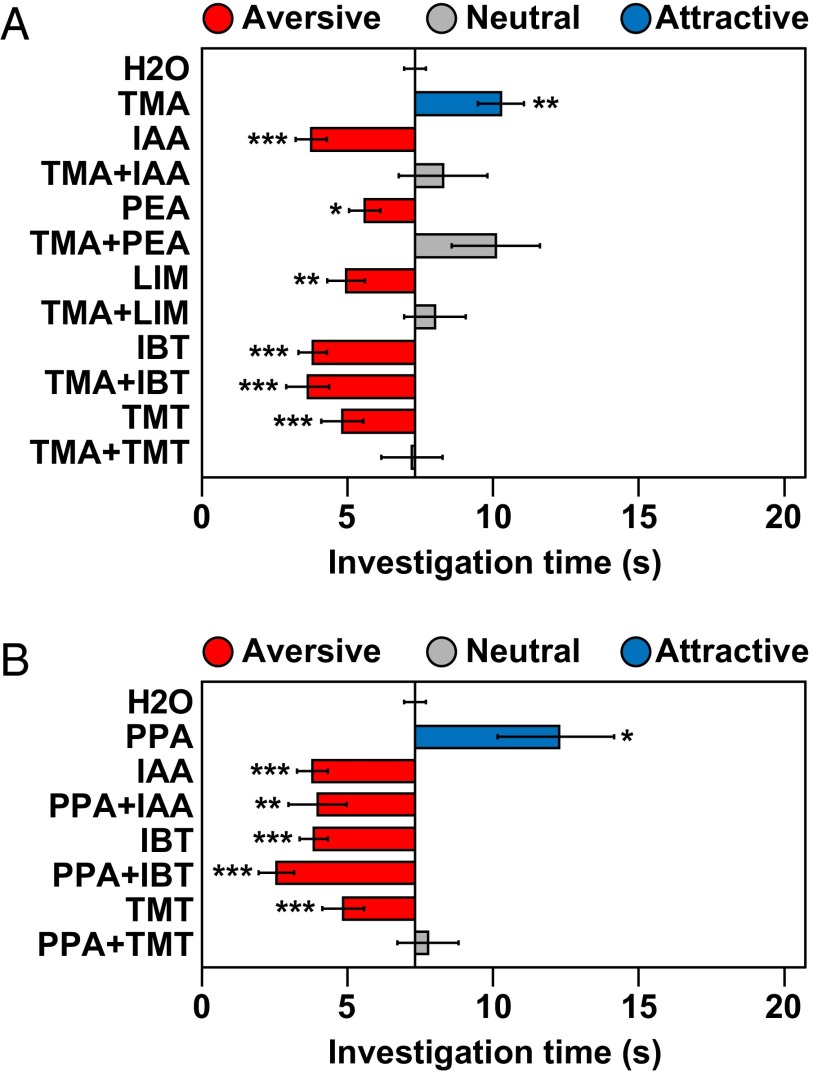
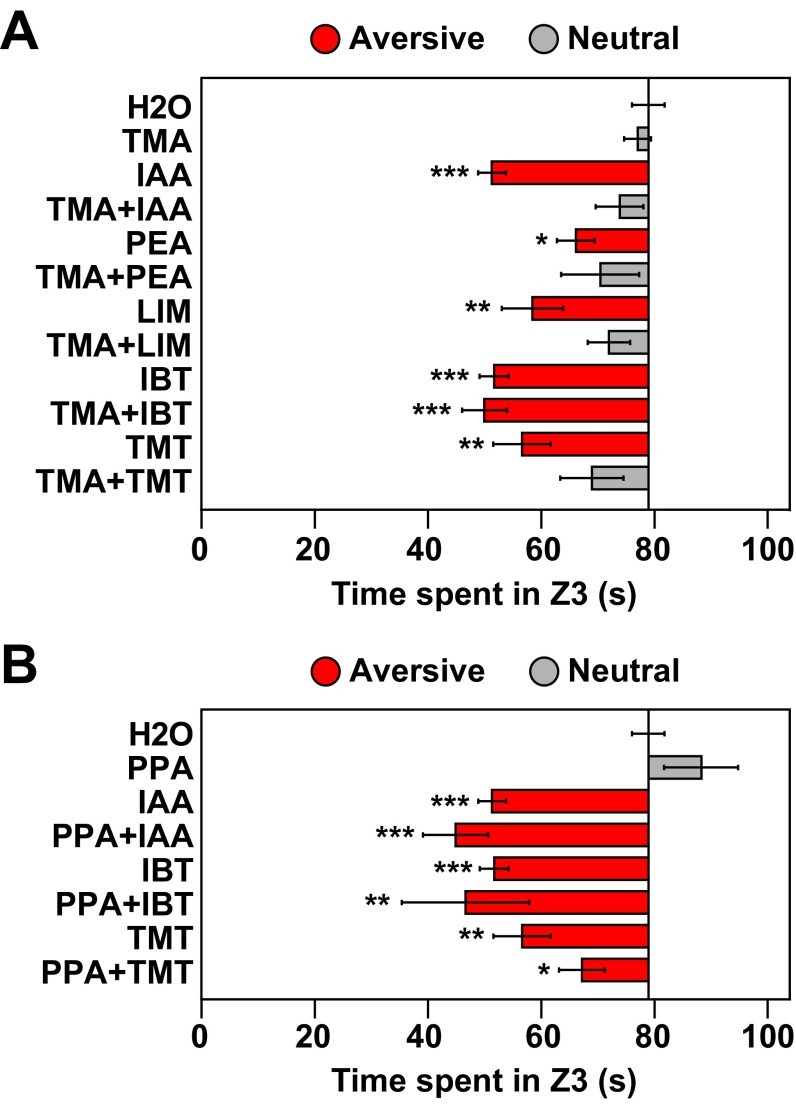
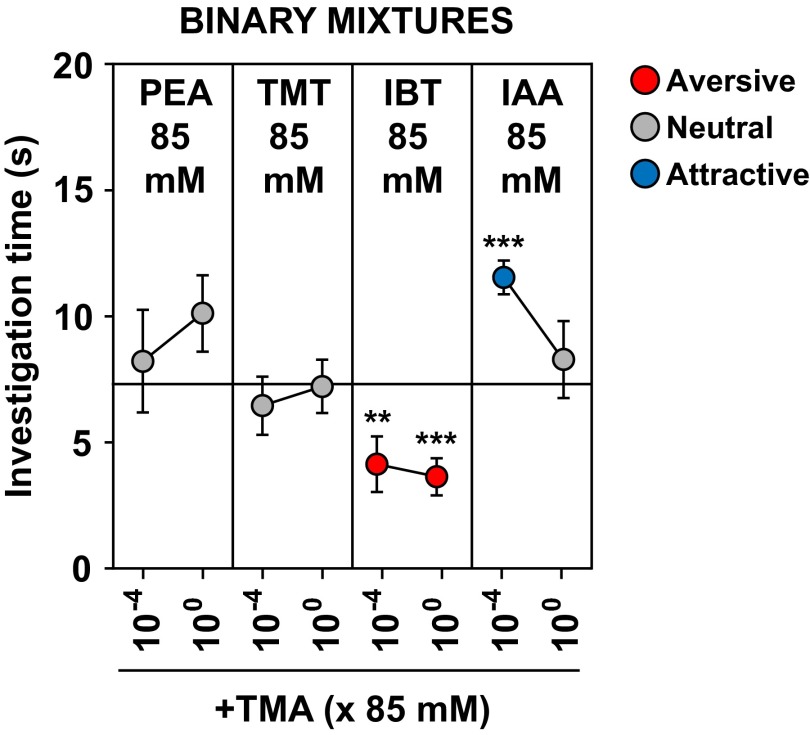
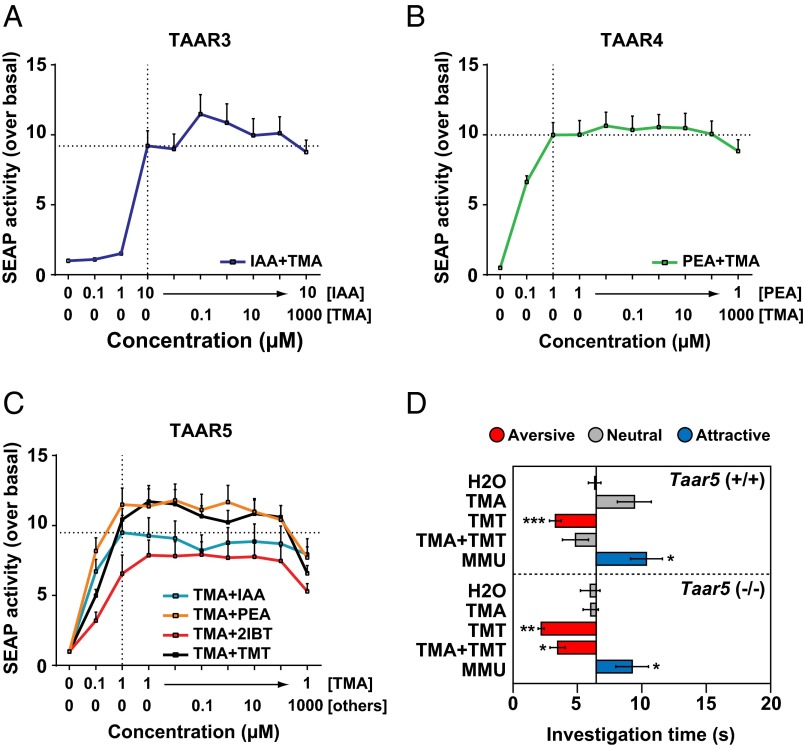
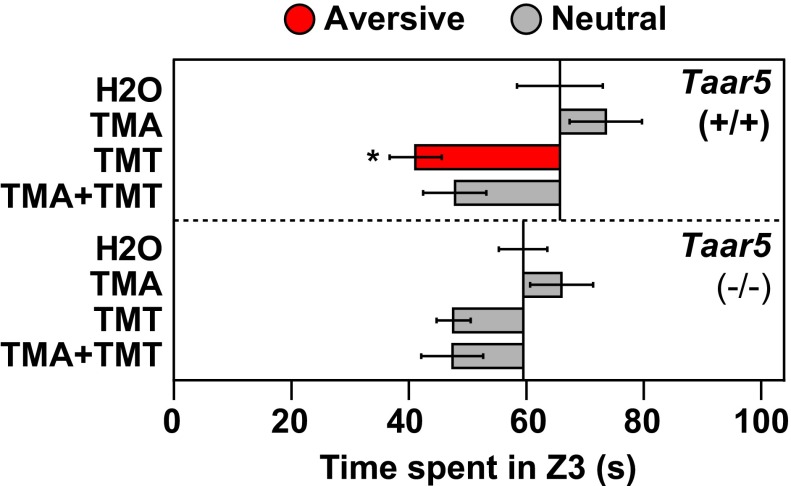
The mechanisms by which odors induce instinctive behaviors are largely unknown. Odor detection in the mouse nose is mediated by >1, 000 different odorant receptors (ORs) and trace amine-associated receptors (TAARs). Odor perceptions are encoded combinatorially by ORs and can be altered by slight changes in the combination of activated receptors. However, the stereotyped nature of instinctive odor responses suggests the involvement of specific receptors and genetically programmed neural circuits relatively immune to extraneous odor stimuli and receptor inputs. Here, we report that, contrary to expectation, innate odor-induced behaviors can be context-dependent. First, different ligands for a given TAAR can vary in behavioral effect. Second, when combined, some attractive and aversive odorants neutralize one another's behavioral effects. Both a TAAR ligand and a common odorant block aversion to a predator odor, indicating that this ability is not unique to TAARs and can extend to an aversive response of potential importance to survival. In vitro testing of single receptors with binary odorant mixtures indicates that behavioral blocking can occur without receptor antagonism in the nose. Moreover, genetic ablation of a single receptor prevents its cognate ligand from blocking predator odor aversion, indicating that the blocking requires sensory input from the receptor. Together, these findings indicate that innate odor-induced behaviors can depend on context, that signals from a single receptor can block innate odor aversion, and that instinctive behavioral responses to odors can be modulated by interactions in the brain among signals derived from different receptors.

Keywords: TAAR; behavior; odorants; olfaction.


Conflict of interest statement

The authors declare no conflict of interest.

Figures

Fig. 1.
Fig. 1.
A number of TAAR ligands and other odorants elicit innate attraction or aversion. (A) Individual mouse TAARs were expressed in HEK293 cells and tested for responses to different odorants. Shown here are 19 of 24 odorants, all amines, which activated one or more TAARs (see Materials and Methods for full names). Colored boxes indicate EC50 values. Individual odorants activated one to six TAARs. (B and C) The olfactory preference test was used to assess the ability of 19 TAAR ligands (B) and 54 other odorants (C) to elicit attractive or aversive behavior. The test measures the time an animal spends investigating filter paper containing odorant or water during a 3-min period. Odorant abbreviations are shown at left (see Materials and Methods for full names). Bars indicate mean investigation time and error bars show SEM (n = 5–10 animals/odorant or water). Asterisks indicate responses significantly different from water (unpaired t test; two-tailed): *P < 0.05; **P < 0.01; ***P < 0.001. Bars are colored to indicate aversion (red), attraction (blue), or a neutral response (gray). Images of mice displaying aversive and attractive responses to filter paper (pseudocolored in red or blue) are seen above in B.
Fig. S1.
Fig. S1.
EC50 values of TAAR agonists. Individual mouse TAARs were expressed in HEK293 cells and tested for responses to different odorants. Shown here are EC50 values for 24 odorants that activated one or more TAARs, as determined in dose–response experiments. The abbreviation for each TAAR agonist is shown at left, followed by its chemical name. Those used in the olfactory preference test (OPT) are indicated. Some odorants activated only one TAAR, whereas others activated two to six TAARs. TAAR ligands newly identified in these studies are highlighted by green boxes.
Fig. S2.
Fig. S2.
Structures and behavioral effects of TAAR ligands and other odorants. Shown here are the structures of 19 TAAR ligands and 54 other odorants. The other odorants are assorted into 13 structural classes. The abbreviation of each odorant is colored according to whether it elicited an attractive, neutral, or aversive behavioral response, as indicated (Fig. 1; see Materials and Methods for full names of odorants.)
Fig. S3.
Fig. S3.
Innate avoidance test using TAAR ligands. Video recordings of mice exposed to TAAR ligands in the olfactory preference test (Fig. 1B) were additionally analyzed in a three-compartment innate avoidance test. Using Ethovision XT11 software, the test cage was divided into three zones of equal size [Zone 1 (Z1), Zone 2 (Z2), and Zone 3 (Z3)], and the time an animal spent in Z3 during a 3-min period was measured. Filter paper containing odorant or water was located in Z3. If an animal spent significantly less time in Z3 when exposed to an odorant versus water, it was considered an avoidance response. Bars indicate mean investigation time and error bars show SEM (n = 5–9 animals/odorant or water). Asterisks indicate responses significantly different from water (unpaired t test, two-tailed): *P < 0.05; **P < 0.01; ***P < 0.001. Bars are colored to indicate avoidance (red) or a neutral response (gray). Attractive responses were not seen with this assay. Seven TAAR agonists elicited aversion, including the three that caused aversion in the innate olfactory preference test (Fig. 1B).
Fig. S4.
Fig. S4.
Male and female mouse urine elicit attraction. The olfactory preference test was used to assess the response of naive adult male mice to urine from adult male or female mice (MMU or FMU) (see legend to Fig. 1). Filter paper containing mouse urine was placed at one end of the animal's cage at the beginning of the test and the observed responses compared with those obtained when animals were exposed to water. Bars indicate mean investigation time and error bars show SEM (n = 5–9 animals/urine or water). Asterisks indicate responses significantly different from the response to water (unpaired t test, two-tailed): ***P < 0.001. The mice showed attraction to both male and female urine.
Fig. S5.
Fig. S5.
Behavioral effects of odorants assigned to different structural classes. The 19 TAAR ligands used in these studies are all amines whereas the 54 other odorants can be assorted into 13 structural classes. This diagram shows the number of odorants in each class that elicited attraction (blue), aversion (red), or a neutral response (gray) using the olfactory preference test (see Fig. 1 for responses and Materials and Methods for names and abbreviations of odorants in each structural class). Odorants in some classes varied in their behavioral effects whereas the camphors and thiazoles tested uniformly caused aversion and the esters, ketones, and vanillin-like compounds all elicited a neutral response.
Fig. S6.
Fig. S6.
Concentration effects on behavioral responses to odorants. The olfactory preference test (see legend to Fig. 1) was used to assess the effects of concentration on responses to specific odorants that were aversive (A), neutral (B), or attractive (C) at 85 mM, as seen in Fig. 1. Shown here are results obtained using 85 mM (10−0) and 102- and 104-fold dilutions. Balls and error bars show mean investigation time ± SEM (n = 5–9 animals/odorant or water) and are colored, as indicated, according to whether they reflected attraction, aversion, or a neutral response. Asterisks indicate responses significantly different from water (unpaired t test, two-tailed): *P < 0.05; **P < 0.01; ***P < 0.001.
Fig. 2.
Fig. 2.
Ligands for the same TAAR elicit different behaviors. (A) A graphical display emphasizes that different agonists for the same TAAR vary in their behavioral effects. Attractive, aversive, and neutral responses are indicated in blue, red, and gray, respectively. (B) Hierarchical clustering analysis of TAARs that detected different odorants failed to reveal a consistent correlation between TAARs activated by different odorants and the odorants' behavioral effects. Attractive, aversive, and neutral responses are indicated in blue, red, and gray, respectively.
Fig. S7.
Fig. S7.
Behavioral effects of different ligands for individual TAARs. Odorants detected by individual TAARs are shown together with the behavioral responses to those ligands seen in Fig. 1. Asterisks indicate responses significantly different from water (unpaired t test, two-tailed): *P < 0.05; **P < 0.01; ***P < 0.001. Eight TAARs recognized more than one odorant. In every case, ligands for the same TAAR elicited different behaviors. Aversive, neutral, and attractive behavioral responses are shown in different colors, as indicated.
Fig. 3.
Fig. 3.
Odorants can block one another’s effects on behavior. The effects of binary odorant mixtures on behavior were assessed using the olfactory preference test and compared with responses to single odorants in Fig. 1 (see legend to Fig. 1). Bars and error bars show mean investigation time ± SEM (n = 5–11 animals/odorant or water). Bars are colored, as indicated, according to whether odorants elicited attraction, aversion, or a neutral response. Asterisks indicate responses significantly different from water (unpaired t test, two-tailed): *P < 0.05; **P < 0.01; ***P < 0.001. The TAAR5 ligand TMA (A) and the attractive common odorant PPA (B) differed in their ability to block avoidance to specific aversive odorants.
Fig. S8.
Fig. S8.
Innate avoidance test of responses to odorant mixtures. Video recordings of mice exposed to single odorants versus binary odorant mixtures in the olfactory preference test (Figs. 1 and 3) were also analyzed in the three-compartment innate avoidance test using Ethovision XT11 software (see legend to Fig. S3). Bars indicate mean investigation time and error bars show SEM (n = 5–11 animals/odorant or water). Asterisks indicate responses significantly different from water (unpaired t test, two-tailed): *P < 0.05; **P < 0.01; ***P < 0.001. Bars are colored to indicate avoidance (red) or a neutral response (gray). No attractive responses were observed with this assay. As in the olfactory preference test (Fig. 3A), TMA blocked aversion to IAA, PEA, LIM, and TMT, but not IBT (A). However, PPA blocked aversion to TMT in the olfactory preference test (Fig. 3B) but not the innate avoidance test (B).
Fig. S9.
Fig. S9.
Effects of odorant concentration on responses to odorant mixtures. The olfactory preference test (see legend to Fig. 1) was used to test whether lowering the concentration of TMA would affect its ability to block aversion to other odorants. Responses obtained using 85 mM each odorant (Fig. 3A) are compared here with responses obtained using 85 mM each aversive odorant, but a 104-fold lower concentration of TMA. Circles indicate mean investigation time and error bars show SEM (n = 5–11 animals/odorant or water). Circles are colored to indicate aversion (red), attraction (blue), or a neutral response (gray) compared with water exposure. Asterisks indicate responses significantly different from water (unpaired t test, two-tailed): **P < 0.01; ***P < 0.001. Lowering the concentration of TMA 10,00-fold did not alter its effect on aversion to PEA, TMT, IBT, or IAA.
Fig. 4.
Fig. 4.
Odor blocking can occur within the brain. (A–C) HEK293 cells expressing TAAR3, TAAR4, or TAAR5 were tested with different concentrations of their respective ligands (IAA, PEA, or TMA) paired with varied concentrations of odorants that blocked the ligand's behavioral effects. Receptor activation was scored using a cAMP reporter assay that measures SEAP activity. SEAP activity over basal (no odorant) is shown in relative fluorescence units. Error bars indicate SEM (n = 8–24). Responses of TAARs to their cognate ligands were not significantly altered by pairing those ligands with another odorant (two-way ANOVA followed by post hoc Fisher LSD tests). (D) KO mice lacking TAAR5 [Taar5(−/−)] or their WT littermates [Taar5(+/+)] were tested for behavioral attraction or aversion to single or paired odorants using the olfactory preference test (see legend to Fig. 1) [n = 6–10 per condition for Taar5(−/−) mice and n = 5–11 per condition for Taar5(+/+) mice]. Asterisks indicate responses significantly different from responses to water: *P < 0.05; **P < 0.01; ***P < 0.001 (unpaired t test, two tailed). WhereasTaar5(+/+) mice showed a neutral response to TMT+TMA, Taar5(−/−) mice lacking Taar5 showed aversion to TMT+TMA, similar to that seen with TMT alone. Thus, TAAR5 is required for TMA to block aversion to TMT.
Fig. S10.
Fig. S10.
Innate avoidance test in TAAR5 KO animals. The innate avoidance test (Fig. S3) was used to assess the behavioral effects of TMA, TMT, and the binary mixture TMA+TMT in KO mice lacking TAAR5. Bars indicate mean investigation time and error bars show SEM (n = 5–11 animals/odorant or water). Asterisks indicate responses significantly different from water (unpaired t test, two-tailed): *P < 0.05. Bars are colored to indicate avoidance (red), attraction (blue), or a neutral response (gray). Similar to the results obtained in the innate olfactory preference test (Fig. 4D), Taar5 WT(+/+) animals displayed avoidance to TMT, but not to the TMT+TMA mixture. In contrast, TAAR5 KO(−/−) animals did not display aversion to TMT or to TMT+TMA, although they showed aversion to both in the olfactory preference test.

Similar articles

Cited by

References

    1. Buck LB, Bargmann C. Smell and taste: The chemical senses. In: Kandel E, Schwartz J, Jessell T, Siegelbaum S, Hudspeth AJ, editors. Principles of Neuroscience. McGraw-Hill; New York: 2012. pp. 712–742.
    1. Munger SD, Leinders-Zufall T, Zufall F. Subsystem organization of the mammalian sense of smell. Annu Rev Physiol. 2009;71:115–140. - PubMed
    1. Stowers L, Kuo TH. Mammalian pheromones: Emerging properties and mechanisms of detection. Curr Opin Neurobiol. 2015;34:103–109. - PMC - PubMed
    1. Buck L, Axel R. A novel multigene family may encode odorant receptors: A molecular basis for odor recognition. Cell. 1991;65(1):175–187. - PubMed
    1. Ressler KJ, Sullivan SL, Buck LB. A zonal organization of odorant receptor gene expression in the olfactory epithelium. Cell. 1993;73(3):597–609. - PubMed

Publication types

LinkOut - more resources