. 2016 Jun 30;82(14):4350-4362.
doi: 10.1128/AEM.00906-16. Print 2016 Jul 15.

Mechanism of Antiactivation at the Pseudomonas sp. Strain ADP σN-Dependent PatzT Promoter

Affiliations

Mechanism of Antiactivation at the Pseudomonas sp. Strain ADP σN-Dependent PatzT Promoter

Ana Isabel Platero et al. Appl Environ Microbiol. .

Abstract

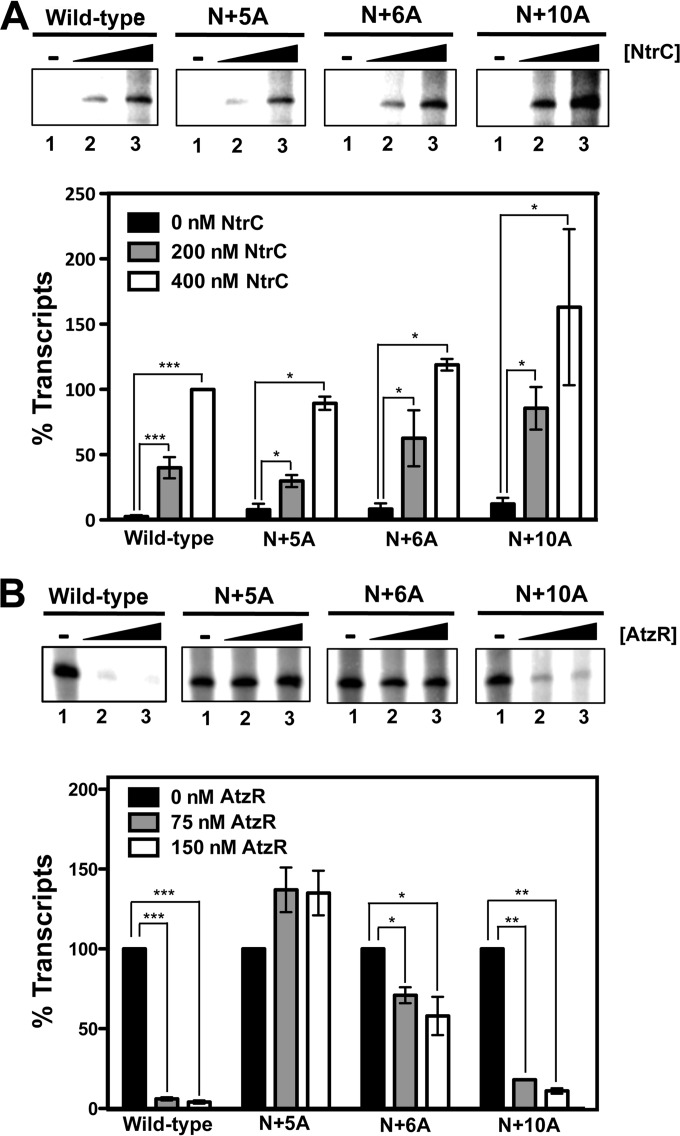
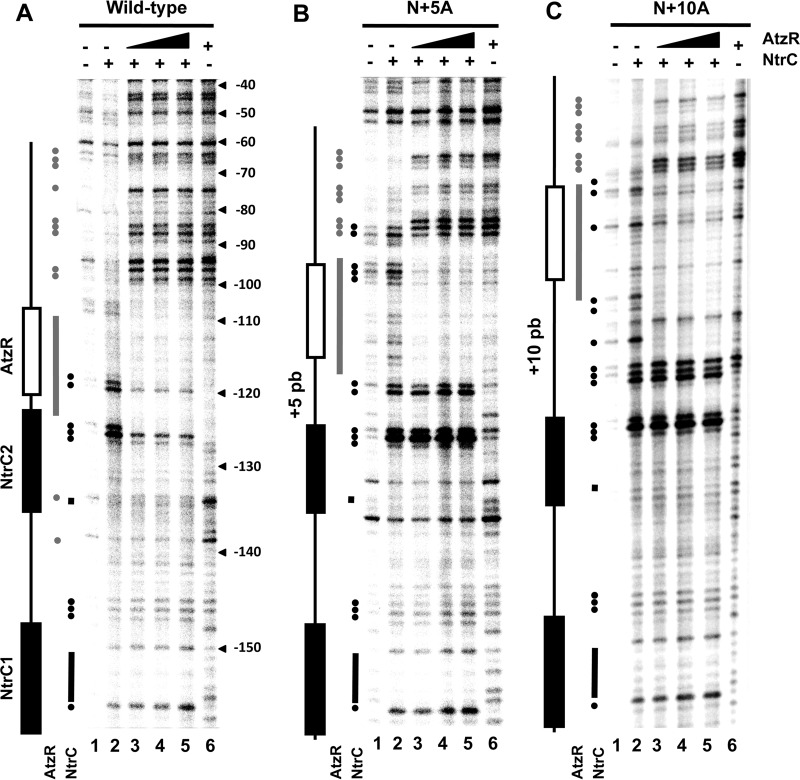
PatzT is an internal promoter of the atzRSTUVW operon that directs the synthesis of AtzT, AtzU, AtzV, and AtzW, components of an ABC-type cyanuric acid transport system. PatzT is σ(N) dependent, activated by the general nitrogen control regulator NtrC with the assistance of protein integration host factor (IHF), and repressed by the LysR-type transcriptional regulator (LTTR) AtzR. We have used a variety of in vivo and in vitro gene expression and protein-DNA interaction assays to assess the mechanisms underlying AtzR-dependent repression of PatzT Here, we show that repression only occurs when AtzR and NtrC interact simultaneously with the PatzT promoter region, indicating that AtzR acts as an antiactivator to antagonize activation by NtrC. Furthermore, repression requires precise rotational orientation of the AtzR and NtrC binding sites, strongly suggesting protein-protein interaction between the two proteins on the promoter region. Further exploration of the antiactivation mechanism showed that although AtzR-dependent repression occurs prior to open complex formation, AtzR does not alter the oligomerization state of NtrC or inhibit NtrC ATPase activity when bound to the PatzT promoter region. Taken together, these results strongly suggest that PatzT-bound AtzR interacts with NtrC to prevent the coupling of NtrC-mediated ATP hydrolysis with the remodeling of the interactions between E-σ(N) and PatzT that lead to open complex formation.

Importance: Here, we describe a unique mechanism by which the regulatory protein AtzR prevents the activation of the σ(N)-dependent promoter PatzT Promoters of this family are always positively regulated, but there are a few examples of overlapping negative regulation. The mechanism described here is highly unconventional and involves an interaction between the repressor and activator proteins to prevent the action of the repressor protein on the RNA polymerase-promoter complex.


Figures

FIG 1
FIG 1
Comparison of the PatzR and PatzT promoter regions. Cartoon depicting the identified cis-acting elements at the PatzR (top) and PatzT (bottom) promoter regions. Promoters are indicated with black arrows, NtrC binding sites are indicated with black boxes, the symmetrical AtzR-binding sites are indicated with two white boxes, and the IHF binding site is indicated with a gray box. The scale indicates coordinates relative to the transcription start point.
FIG 2
FIG 2
In vitro repression of the PatzT promoter. In vitro transcription assays using the PatzT promoter region as a template. Isomerization to the open complex was triggered by addition of NtrCD55E,S161F to an ATP-containing mixture (A) or by addition of ATP to an NtrCD55E,S161F-containing reaction mixture (B). Each panel shows an autoradiograph of the representative PAGE gel (top) and a plot of the quantified relative transcript abundance (bottom). AtzR-His6 concentrations were 0 nM (lane 1), 40 nM (lane 2), 80 nM (lane 3), 160 nM (lane 4), or 240 nM (lane 5). Legends denote the order of AtzR-His6 addition before (AtzR-NtrC or AtzR-ATP) or after (NtrC-AtzR or ATP-AtzR) open complex formation. Symbols and error bars represent the averages and standard deviations of at least three independent assays. The significances of the differences between the two data sets for each experiment were assessed by the t test for unpaired samples not assuming equal variances. *, P < 0.05; **, P < 0.01; ***, P < 0.001. Differences were not significant when not indicated.
FIG 3
FIG 3
Gel mobility shift assay of AtzR and NtrC on the PatzT promoter region. Autoradiograph of a representative PAGE gel. Lane 1 shows a free PatzT probe. Lanes 2 to 6 show a preformed complex containing 2 μM NtrCD55E,S161F challenged with 0 nM (lane 2), 50 nM (lane 3), 100 nM (lane 4), 200 nM (lane 5), or 400 nM AtzR-His6. Lanes 7 to 11 show a preformed complex containing 400 nM AtzR-His6, challenged with 0 nM (lane 7), 250 nM (lane 8), 500 nM (lane 9), 1 μM (lane 10), or 2 μM (lane 11) NtrCD55E,S161F. AtzR-DNA, NtrC-DNA, and AtzR-NtrC-DNA complexes are denoted by black, gray, and white arrows, respectively.
FIG 4
FIG 4
DNase I footprinting assay of AtzR and NtrC on the PatzT promoter region. Autoradiograph of a representative PAGE gel. Lane 1 shows a free PatzT probe. Lanes 2 to 6 show a preformed complex containing 2 μM NtrCD55E,S161F challenged with 0 nM (lane 2), 50 nM (lane 3), 100 nM (lane 4), 200 nM (lane 5), or 400 nM AtzR-His6. Lanes 7 to 11 show a preformed complex containing 400 nM AtzR-His6, challenged with 0 nM (lane 7), 250 nM (lane 8), 500 nM (lane 9), 1 μM (lane 10), or 2 μM (lane 11) NtrCD55E,S161F. Coordinates relative to PatzT transcriptional start are indicated on the right. The approximate locations of the NtrC and AtzR binding sites are denoted by black and white boxes, respectively. Black bars and circles indicate positions rendered protected or hypersensitive, respectively, by NtrC binding. Gray bars and circles indicate positions rendered protected or hypersensitive, respectively, by AtzR binding.
FIG 5
FIG 5
β-Galactosidase activity of PatzT-lacZ fusions. (A) Schematic of the PatzT promoter derivatives used for gene fusion analysis. Sequences of the NtrC2, AtzR, and IHF binding sites are shown. Binding sites are coded as in Fig. 1. Vertical arrows indicate the location of the insertions. Plasmid name, construct designation, and the number and identity of the nucleotides inserted is shown for each construct. (B) Results of the β-galactosidase assays performed with the PatzT promoter derivatives above fused to lacZ in pMPO234. Columns and error bars represent the averages and standard deviations of at least three independent assays. Significance of AtzR regulation (−AtzR versus +AtzR) was assessed for each promoter variant under nitrogen sufficiency and nitrogen limitation by the t test for unpaired samples not assuming equal variances. *, P < 0.05; **, P < 0.01; ***, P < 0.001. Differences were not significant when not indicated. Significance of nitrogen regulation (ammonium versus serine) was also assessed, and differences were found to be significant (0.05 > P > 0.00002) in all cases (not shown).
FIG 6
FIG 6
In vitro activation and repression of PatzT promoter derivatives. In vitro transcription assays using PatzT promoter region derivatives as the templates. (A) Activation of PatzT promoter derivatives in the presence of 75 mM IHF and 0 nM (lane 1), 200 nM (lane 2), or 400 nM (lane 3) NtrCD55E,S161F. (B) Repression of PatzT promoter region derivatives in the presence of 400 nM NtrCD55E,S161F, 75 nM IHF, and 0 nM (lane 1), 75 nM (lane 2), or 150 nM (lane 3) AtzR-His6. Each panel shows an autoradiograph of a representative PAGE gel (top) and a plot of the quantified relative transcript abundance (bottom). Bars represent the averages and standard deviations of at least three independent assays. Significances of NtrC-dependent activation (A) and AtzR-dependent repression (B) were assessed for each promoter variant by the t test for unpaired samples not assuming equal variances. *, P < 0.05; **, P < 0.01; ***, P < 0.001. Differences were not significant when not indicated.
FIG 7
FIG 7
Gel mobility shift assay of AtzR on PatzT promoter region derivatives. Autoradiograph of a representative PAGE gel, containing the indicated PatzT promoter derivative probes and 0 nM (lane 1), 50 nM (lane 2), or 100 nM (lane 3) AtzR-His6.
FIG 8
FIG 8
DNase I footprinting assay of AtzR and NtrC on PatzT promoter region derivatives. Autoradiograph of representative PAGE gels containing the wild-type (A), N+5A (B), or N+10A (C) probe. Lane 1 shows a free PatzT probe. Lanes 2 to 6 show a preformed complex containing 2 μM NtrCD55E,S161F challenged with 0 nM (lane 2), 50 nM (lane 3), 100 nM (lane 4), 200 nM (lane 5), or 400 nM AtzR-His6. The approximate locations of the NtrC and AtzR binding sites are denoted by black and white boxes, respectively. Black bars and circles indicate positions rendered protected or hypersensitive, respectively, by NtrC binding. Gray bars and circles indicate positions rendered protected or hypersensitive, respectively, by AtzR binding.
FIG 9
FIG 9
Effect of AtzR and PatzT promoter DNA on NtrC ATPase activity. ATPase activity assay of NtrCD55E,S161F (231 nM) in the presence or in the absence of AtzR-His6 (240 nM) and/or PatzT promoter region DNA (770 nM). Data show specific molar activity, assuming that the NtrC active form is a hexamer. Bars represent the averages and standard deviations of at least three independent assays. Significance was assessed by the t test for unpaired samples not assuming equal variances. *, P < 0.05. Differences were not significant when not indicated.

Similar articles

Cited by

References

    1. Morett E, Segovia L. 1993. The sigma 54 bacterial enhancer-binding protein family: mechanism of action and phylogenetic relationship of their functional domains. J Bacteriol 175:6067–6074. - PMC - PubMed
    1. Buck M, Gallegos MT, Studholme DJ, Guo Y, Gralla JD. 2000. The bacterial enhancer-dependent sigma(54) (sigma(N)) transcription factor. J Bacteriol 182:4129–4136. doi:10.1128/JB.182.15.4129-4136.2000. - DOI - PMC - PubMed
    1. Zhang X, Chaney M, Wigneshweraraj SR, Schumacher J, Bordes P, Cannon W, Buck M. 2002. Mechanochemical ATPases and transcriptional activation. Mol Microbiol 45:895–903. doi:10.1046/j.1365-2958.2002.03065.x. - DOI - PubMed
    1. Studholme DJ, Dixon R. 2003. Domain architectures of σ54-dependent transcriptional activators. J Bacteriol 185:1757–1767. doi:10.1128/JB.185.6.1757-1767.2003. - DOI - PMC - PubMed
    1. Schumacher J, Joly N, Rappas M, Zhang X, Buck M. 2006. Structures and organisation of AAA+ enhancer binding proteins in transcriptional activation. J Struct Biol 156:190–199. doi:10.1016/j.jsb.2006.01.006. - DOI - PubMed

Publication types

MeSH terms

LinkOut - more resources